LSBM203 - Managerial Finance: Ratio Analysis and Investment Appraisal
VerifiedAdded on 2023/06/15
|14
|3807
|295
Report
AI Summary
This report provides a managerial finance analysis, dividing into two portfolios: ratio analysis of B&M and Morrison, and investment appraisal techniques. Portfolio 1 assesses growth, profitability, and financial ratios, highlighting areas where Morrison underperforms compared to B&M, particularly in liquidity, profit margins, and gearing ratios. Recommendations suggest Morrison needs significant improvements. The report also acknowledges the limitations of financial ratios. Portfolio 2 focuses on capital investment appraisal techniques and their limitations. Desklib offers this and similar resources to aid students in their studies.

Managerial Finance
Paraphrase This Document
Need a fresh take? Get an instant paraphrase of this document with our AI Paraphraser
Contents
Contents...........................................................................................................................................2
INTRODUCTION...........................................................................................................................1
Portfolio 1........................................................................................................................................1
Summary......................................................................................................................................1
Recommendation.........................................................................................................................7
Limitations of Financial Ratios...................................................................................................7
Portfolio 2........................................................................................................................................8
Capital investment Appraisal Techniques...................................................................................8
Limitation of Investment appraisal techniques............................................................................9
Limitations of Investment Appraisal Techniques......................................................................10
CONCLUSION..............................................................................................................................10
REFERENCES..............................................................................................................................11

⊘ This is a preview!⊘
Do you want full access?
Subscribe today to unlock all pages.
Trusted by 1+ million students worldwide
INTRODUCTION
Managerial finance is an important aspect as it is related with the funds of the company
which can be used in an impactful manner so as to add value to the company in the long run so
that it can achieve its goals and objectives that are made in the starting as a whole (Akhigbe,
Newman and Whyte, 2017). The below report is divided into 2 parts that is portfolio 1 and
portfolio 2 and both the portfolios carries a lot of value in the long run for the firm. In the first
part there is an evaluation of the company’s ratios that is B&M and Morrison while in the part 2
there is an analysis of the techniques used is done so that the firm can take appropriate decisions
on the investing part of the firm.
Portfolio 1
Summary
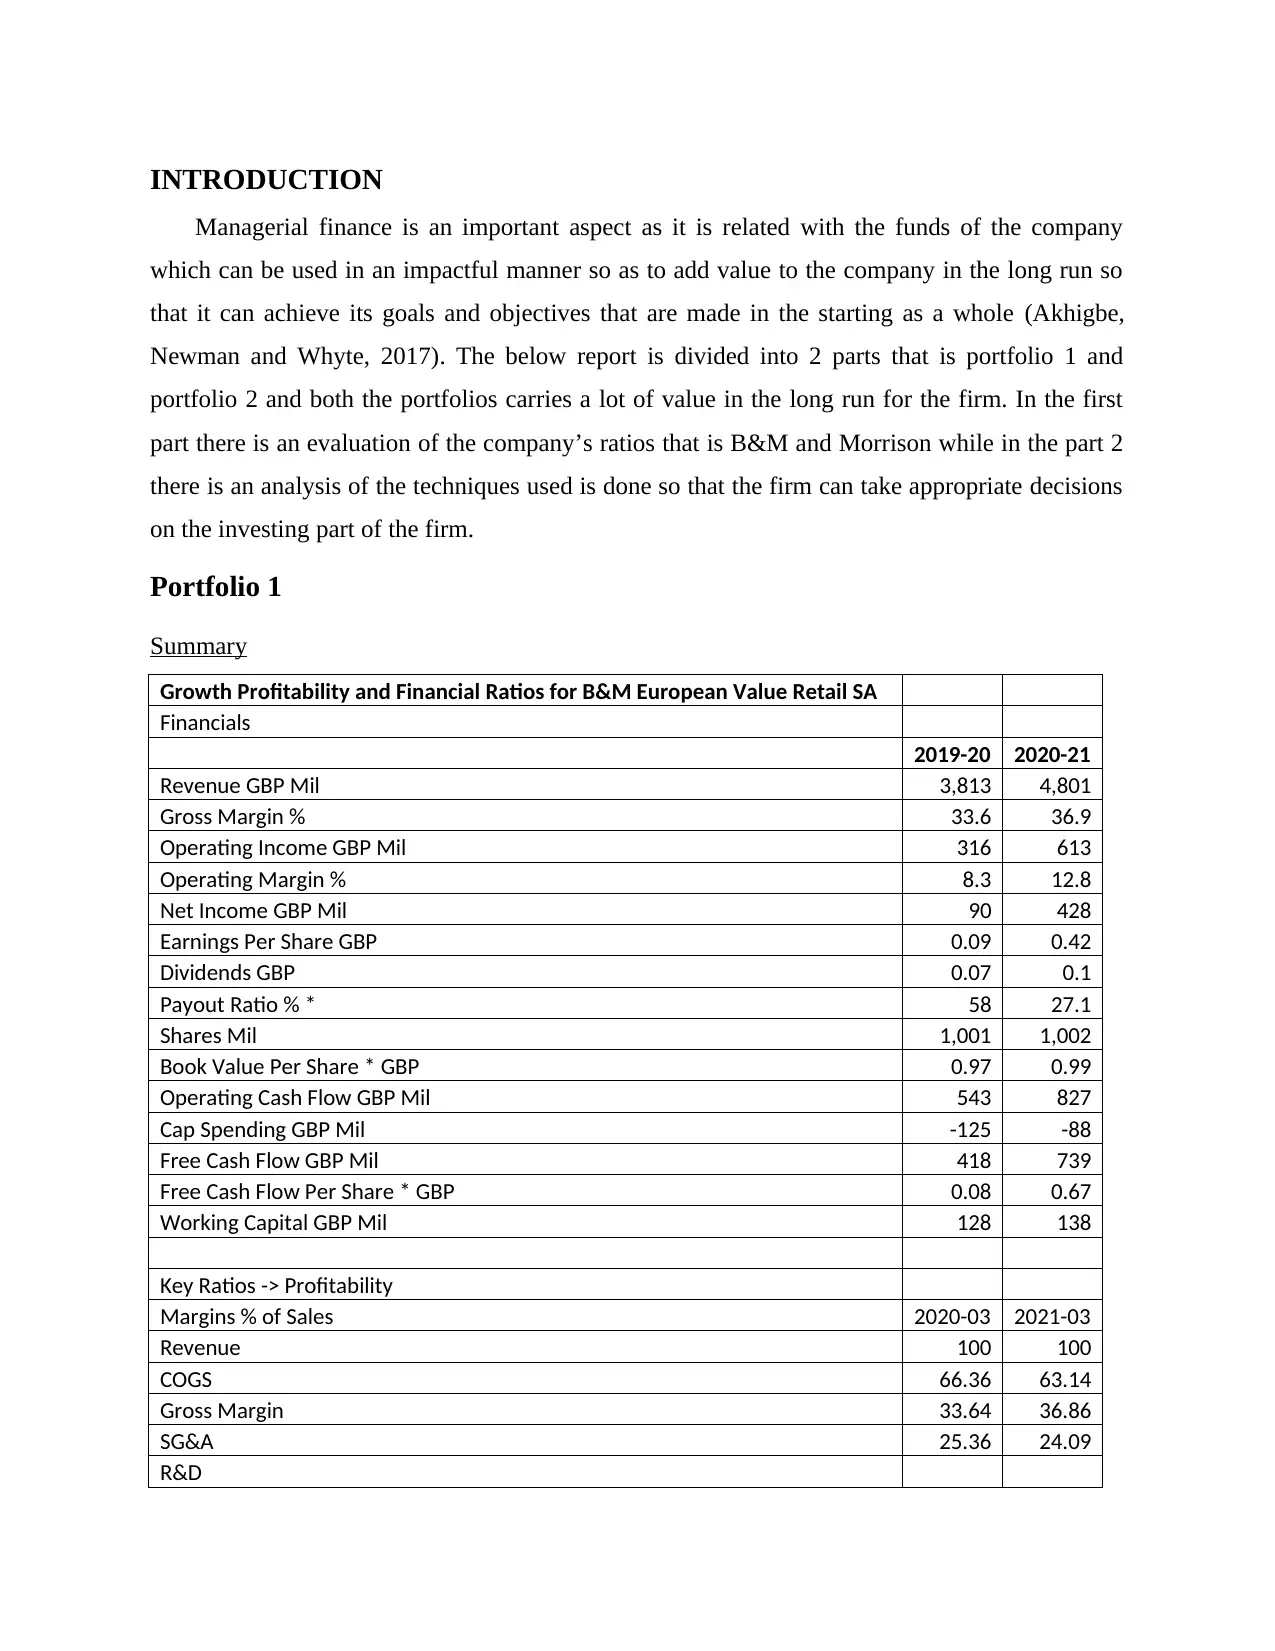
Growth Profitability and Financial Ratios for B&M European Value Retail SA
Financials
2019-20 2020-21
Revenue GBP Mil 3,813 4,801
Gross Margin % 33.6 36.9
Operating Income GBP Mil 316 613
Operating Margin % 8.3 12.8
Net Income GBP Mil 90 428
Earnings Per Share GBP 0.09 0.42
Dividends GBP 0.07 0.1
Payout Ratio % * 58 27.1
Shares Mil 1,001 1,002
Book Value Per Share * GBP 0.97 0.99
Operating Cash Flow GBP Mil 543 827
Cap Spending GBP Mil -125 -88
Free Cash Flow GBP Mil 418 739
Free Cash Flow Per Share * GBP 0.08 0.67
Working Capital GBP Mil 128 138
Key Ratios -> Profitability
Margins % of Sales 2020-03 2021-03
Revenue 100 100
COGS 66.36 63.14
Gross Margin 33.64 36.86
SG&A 25.36 24.09
R&D
Managerial finance is an important aspect as it is related with the funds of the company
which can be used in an impactful manner so as to add value to the company in the long run so
that it can achieve its goals and objectives that are made in the starting as a whole (Akhigbe,
Newman and Whyte, 2017). The below report is divided into 2 parts that is portfolio 1 and
portfolio 2 and both the portfolios carries a lot of value in the long run for the firm. In the first
part there is an evaluation of the company’s ratios that is B&M and Morrison while in the part 2
there is an analysis of the techniques used is done so that the firm can take appropriate decisions
on the investing part of the firm.
Portfolio 1
Summary
Growth Profitability and Financial Ratios for B&M European Value Retail SA
Financials
2019-20 2020-21
Revenue GBP Mil 3,813 4,801
Gross Margin % 33.6 36.9
Operating Income GBP Mil 316 613
Operating Margin % 8.3 12.8
Net Income GBP Mil 90 428
Earnings Per Share GBP 0.09 0.42
Dividends GBP 0.07 0.1
Payout Ratio % * 58 27.1
Shares Mil 1,001 1,002
Book Value Per Share * GBP 0.97 0.99
Operating Cash Flow GBP Mil 543 827
Cap Spending GBP Mil -125 -88
Free Cash Flow GBP Mil 418 739
Free Cash Flow Per Share * GBP 0.08 0.67
Working Capital GBP Mil 128 138
Key Ratios -> Profitability
Margins % of Sales 2020-03 2021-03
Revenue 100 100
COGS 66.36 63.14
Gross Margin 33.64 36.86
SG&A 25.36 24.09
R&D
Paraphrase This Document
Need a fresh take? Get an instant paraphrase of this document with our AI Paraphraser
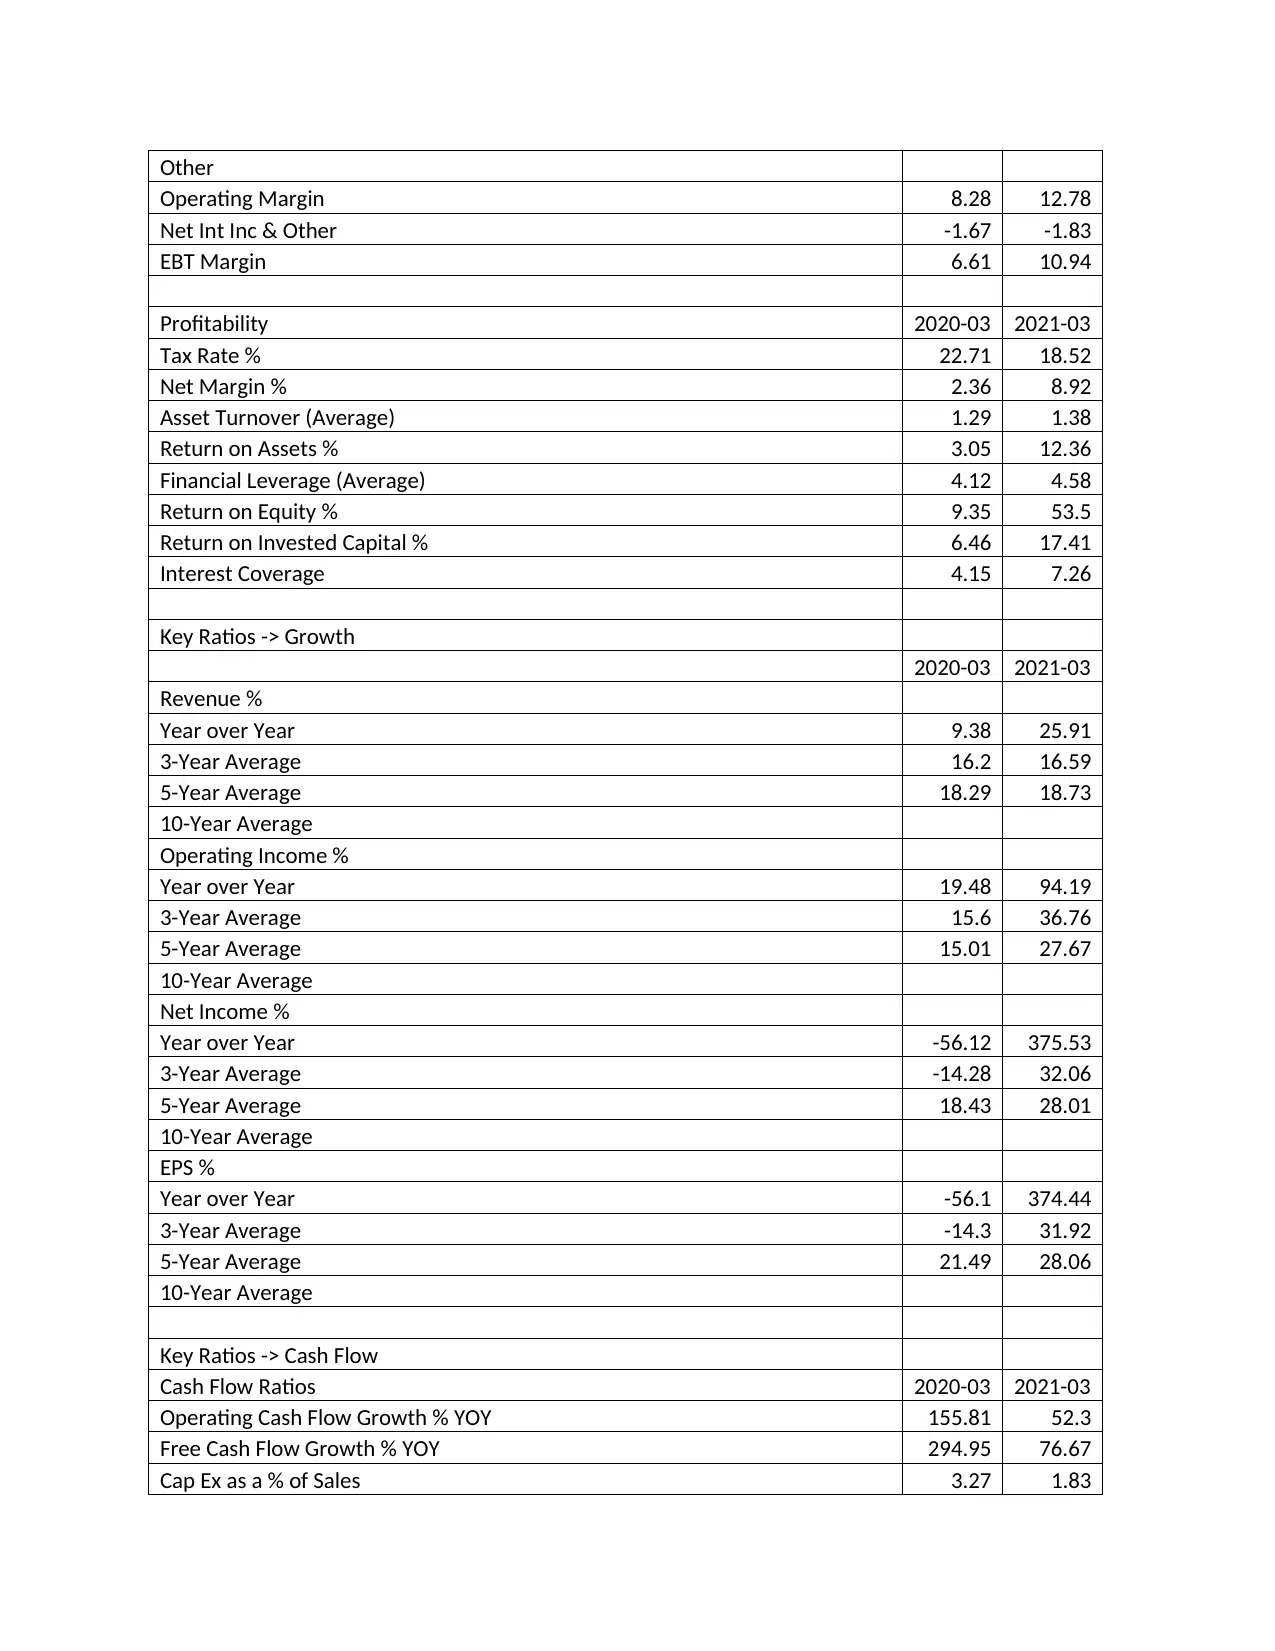
Other
Operating Margin 8.28 12.78
Net Int Inc & Other -1.67 -1.83
EBT Margin 6.61 10.94
Profitability 2020-03 2021-03
Tax Rate % 22.71 18.52
Net Margin % 2.36 8.92
Asset Turnover (Average) 1.29 1.38
Return on Assets % 3.05 12.36
Financial Leverage (Average) 4.12 4.58
Return on Equity % 9.35 53.5
Return on Invested Capital % 6.46 17.41
Interest Coverage 4.15 7.26
Key Ratios -> Growth
2020-03 2021-03
Revenue %
Year over Year 9.38 25.91
3-Year Average 16.2 16.59
5-Year Average 18.29 18.73
10-Year Average
Operating Income %
Year over Year 19.48 94.19
3-Year Average 15.6 36.76
5-Year Average 15.01 27.67
10-Year Average
Net Income %
Year over Year -56.12 375.53
3-Year Average -14.28 32.06
5-Year Average 18.43 28.01
10-Year Average
EPS %
Year over Year -56.1 374.44
3-Year Average -14.3 31.92
5-Year Average 21.49 28.06
10-Year Average
Key Ratios -> Cash Flow
Cash Flow Ratios 2020-03 2021-03
Operating Cash Flow Growth % YOY 155.81 52.3
Free Cash Flow Growth % YOY 294.95 76.67
Cap Ex as a % of Sales 3.27 1.83
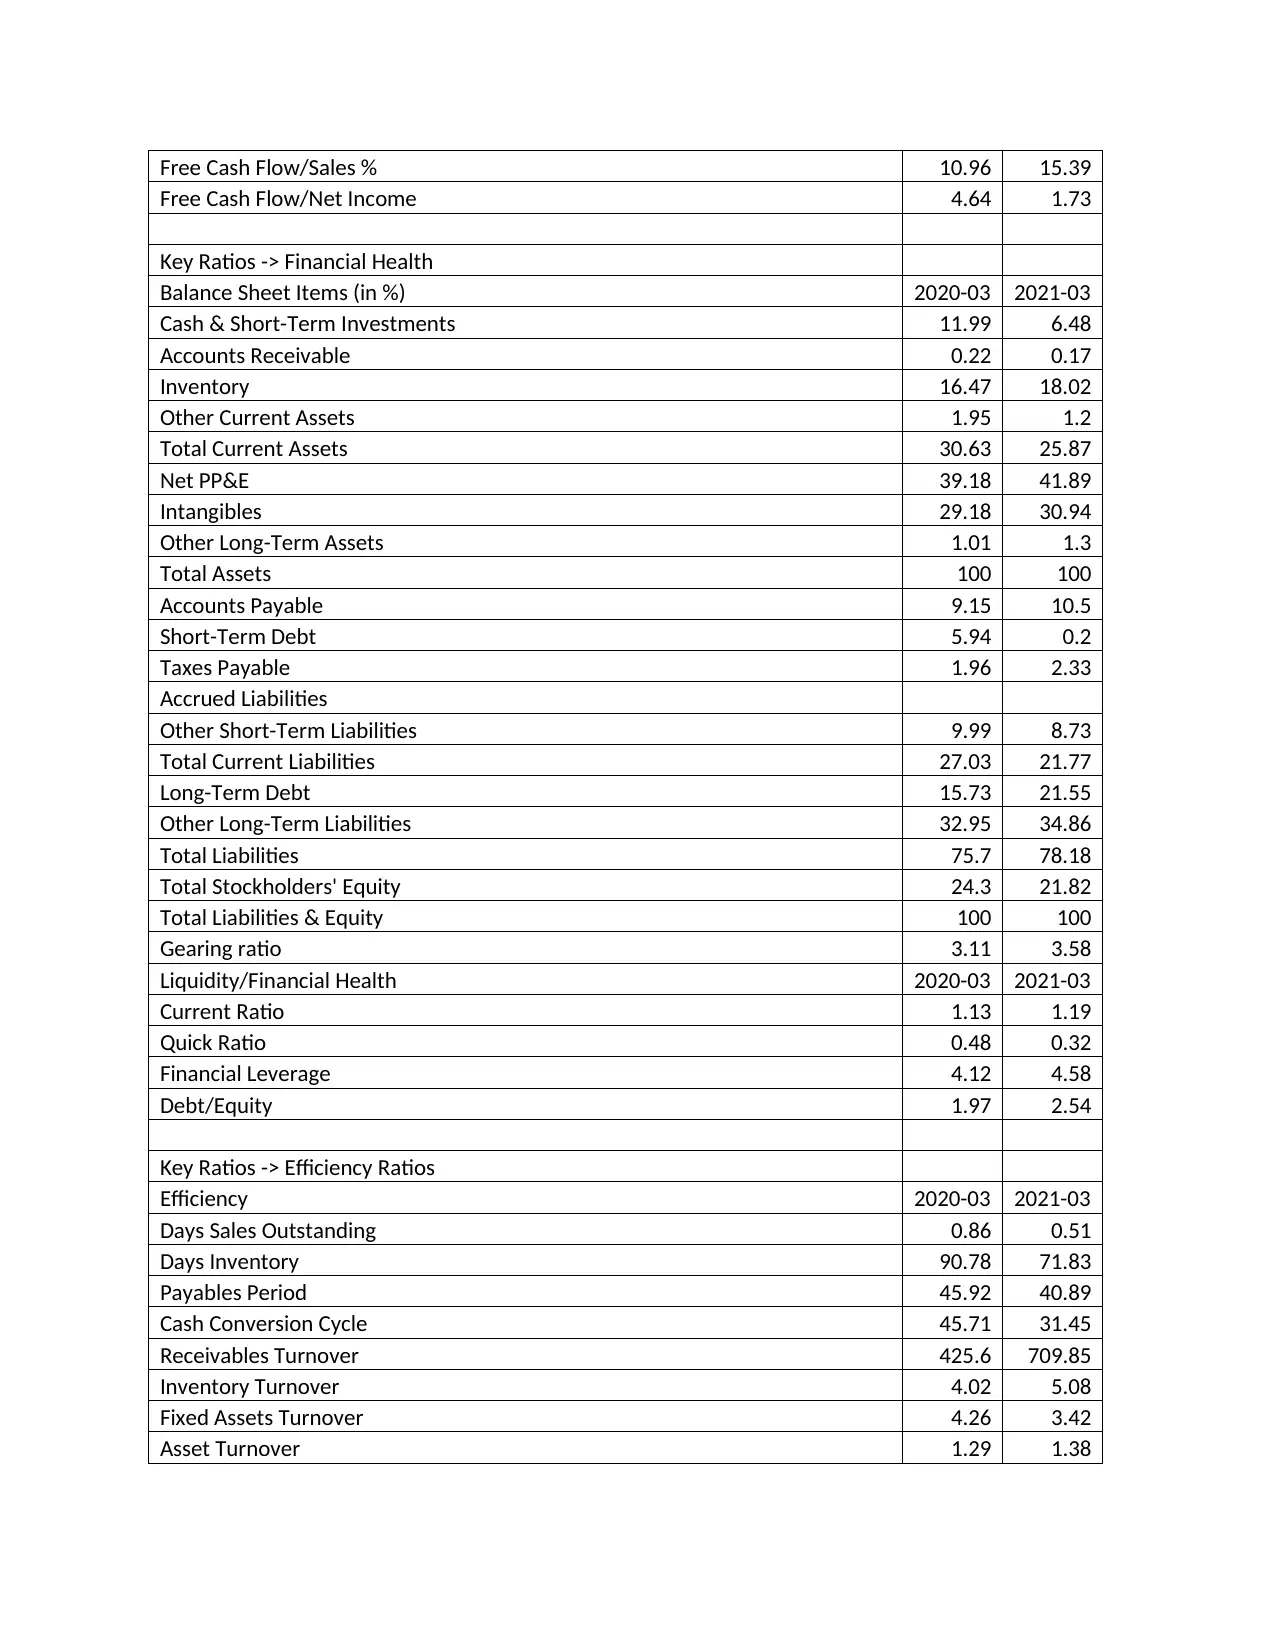
Free Cash Flow/Sales % 10.96 15.39
Free Cash Flow/Net Income 4.64 1.73
Key Ratios -> Financial Health
Balance Sheet Items (in %) 2020-03 2021-03
Cash & Short-Term Investments 11.99 6.48
Accounts Receivable 0.22 0.17
Inventory 16.47 18.02
Other Current Assets 1.95 1.2
Total Current Assets 30.63 25.87
Net PP&E 39.18 41.89
Intangibles 29.18 30.94
Other Long-Term Assets 1.01 1.3
Total Assets 100 100
Accounts Payable 9.15 10.5
Short-Term Debt 5.94 0.2
Taxes Payable 1.96 2.33
Accrued Liabilities
Other Short-Term Liabilities 9.99 8.73
Total Current Liabilities 27.03 21.77
Long-Term Debt 15.73 21.55
Other Long-Term Liabilities 32.95 34.86
Total Liabilities 75.7 78.18
Total Stockholders' Equity 24.3 21.82
Total Liabilities & Equity 100 100
Gearing ratio 3.11 3.58
Liquidity/Financial Health 2020-03 2021-03
Current Ratio 1.13 1.19
Quick Ratio 0.48 0.32
Financial Leverage 4.12 4.58
Debt/Equity 1.97 2.54
Key Ratios -> Efficiency Ratios
Efficiency 2020-03 2021-03
Days Sales Outstanding 0.86 0.51
Days Inventory 90.78 71.83
Payables Period 45.92 40.89
Cash Conversion Cycle 45.71 31.45
Receivables Turnover 425.6 709.85
Inventory Turnover 4.02 5.08
Fixed Assets Turnover 4.26 3.42
Asset Turnover 1.29 1.38
⊘ This is a preview!⊘
Do you want full access?
Subscribe today to unlock all pages.
Trusted by 1+ million students worldwide
Growth Profitability and Financial Ratios for Morrison 2019-20 2020-21
Fiscal Year Ends
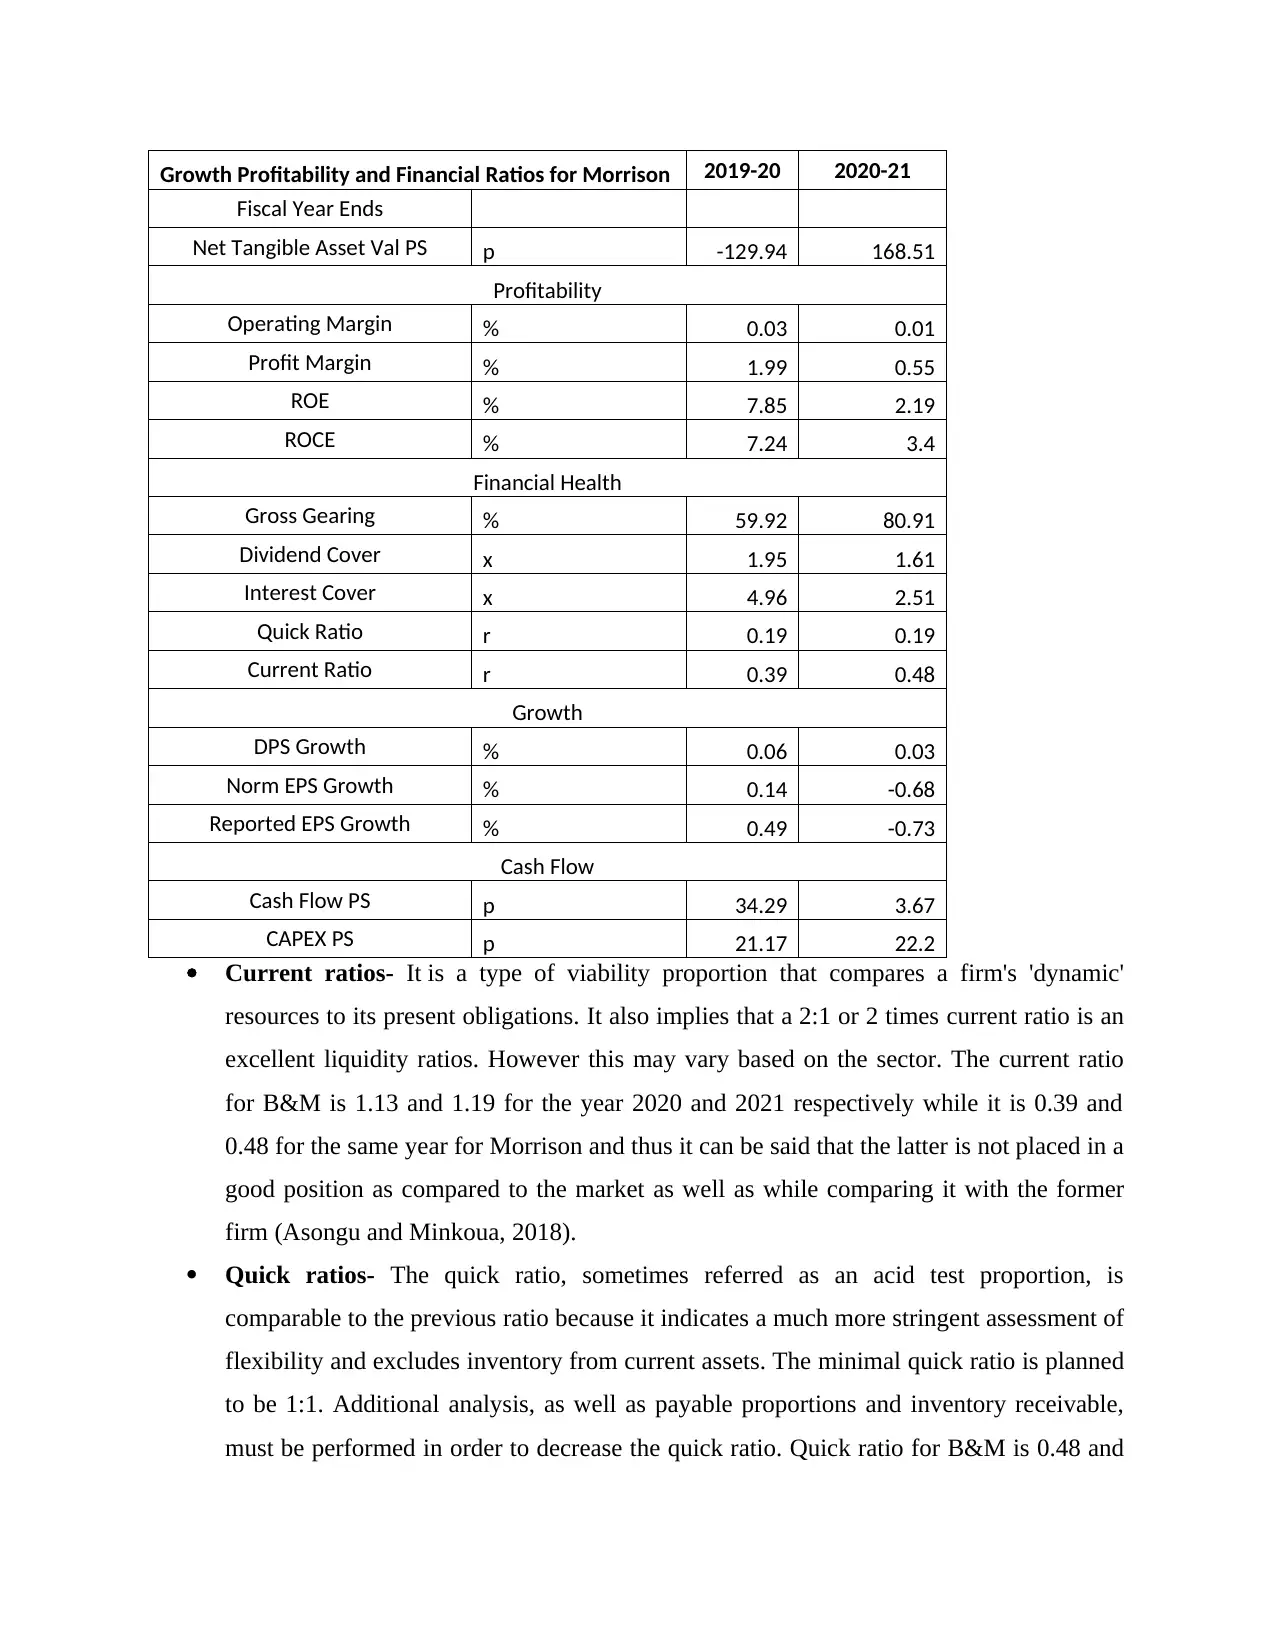
Net Tangible Asset Val PS p -129.94 168.51
Profitability
Operating Margin % 0.03 0.01
Profit Margin % 1.99 0.55
ROE % 7.85 2.19
ROCE % 7.24 3.4
Financial Health
Gross Gearing % 59.92 80.91
Dividend Cover x 1.95 1.61
Interest Cover x 4.96 2.51
Quick Ratio r 0.19 0.19
Current Ratio r 0.39 0.48
Growth
DPS Growth % 0.06 0.03
Norm EPS Growth % 0.14 -0.68
Reported EPS Growth % 0.49 -0.73
Cash Flow
Cash Flow PS p 34.29 3.67
CAPEX PS p 21.17 22.2
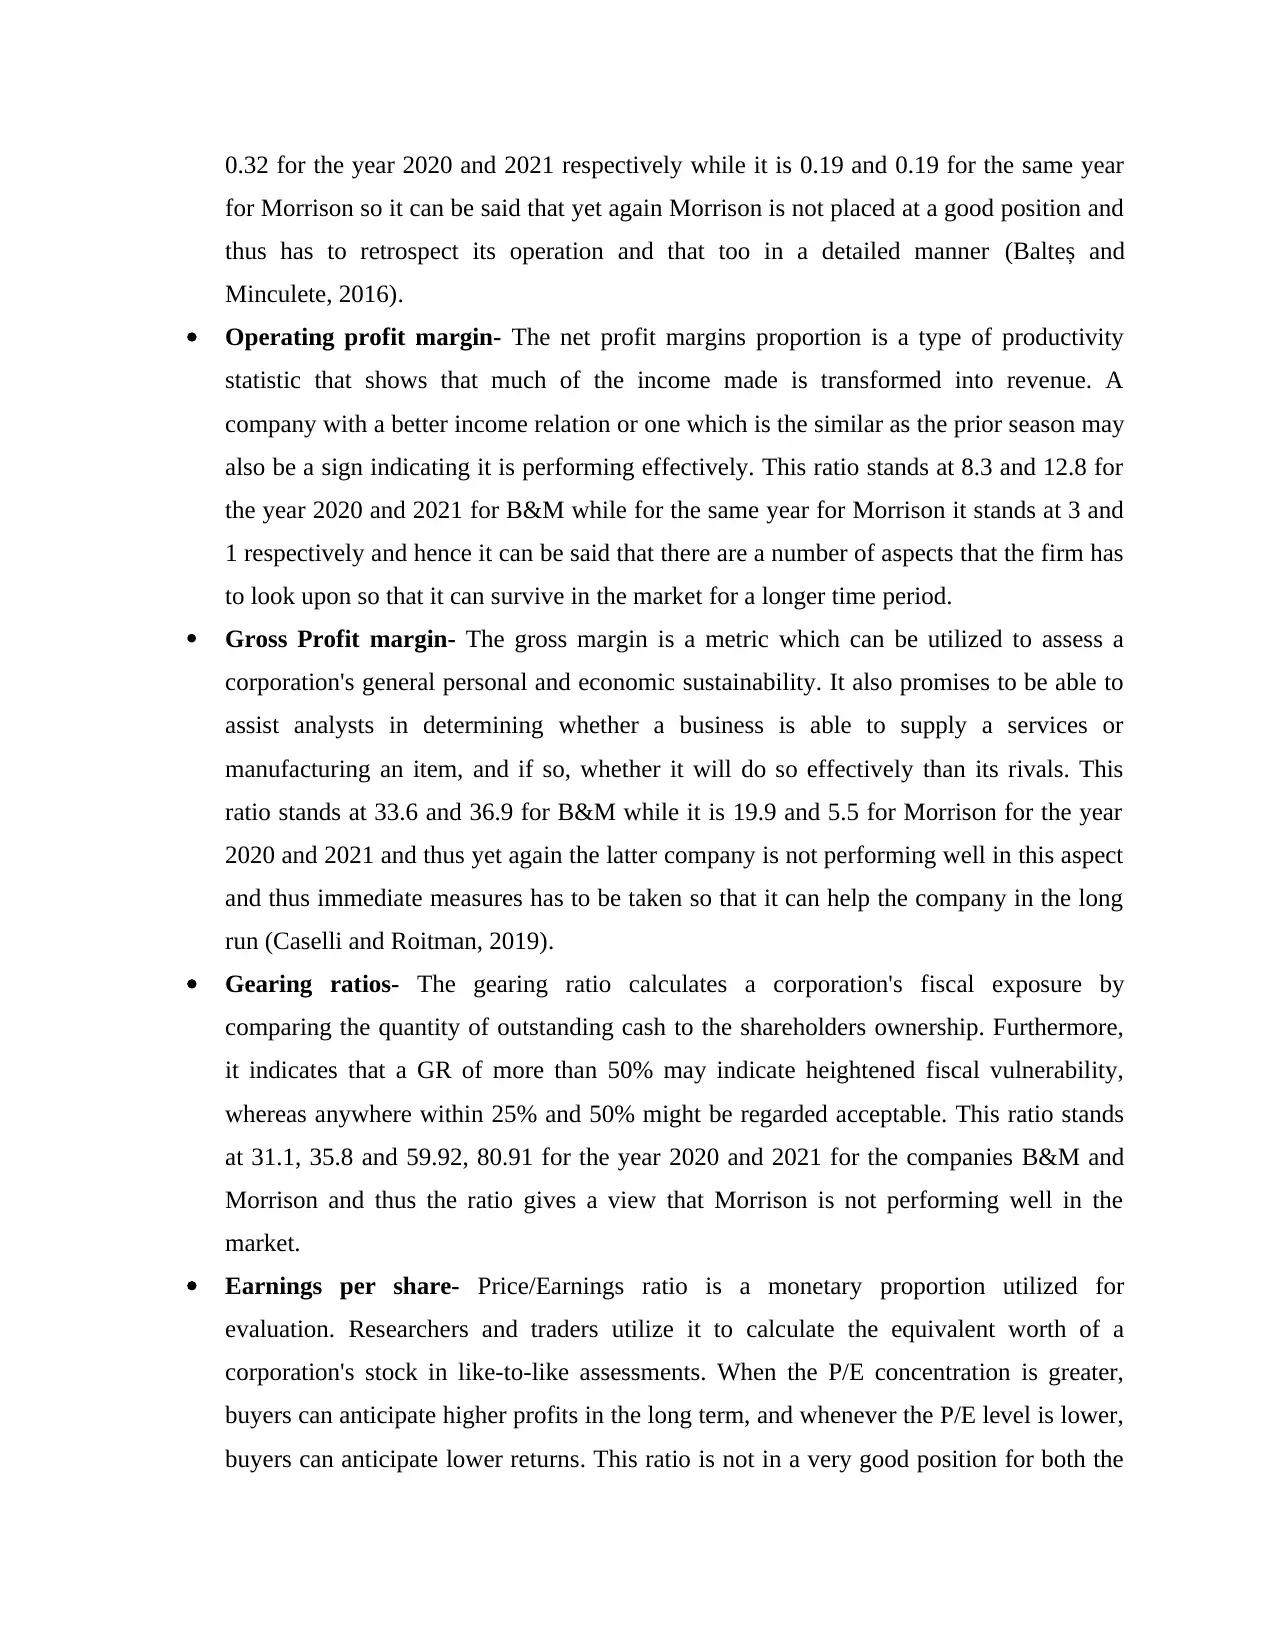
Current ratios- It is a type of viability proportion that compares a firm's 'dynamic'
resources to its present obligations. It also implies that a 2:1 or 2 times current ratio is an
excellent liquidity ratios. However this may vary based on the sector. The current ratio
for B&M is 1.13 and 1.19 for the year 2020 and 2021 respectively while it is 0.39 and
0.48 for the same year for Morrison and thus it can be said that the latter is not placed in a
good position as compared to the market as well as while comparing it with the former
firm (Asongu and Minkoua, 2018).
Quick ratios- The quick ratio, sometimes referred as an acid test proportion, is
comparable to the previous ratio because it indicates a much more stringent assessment of
flexibility and excludes inventory from current assets. The minimal quick ratio is planned
to be 1:1. Additional analysis, as well as payable proportions and inventory receivable,
must be performed in order to decrease the quick ratio. Quick ratio for B&M is 0.48 and
Fiscal Year Ends
Net Tangible Asset Val PS p -129.94 168.51
Profitability
Operating Margin % 0.03 0.01
Profit Margin % 1.99 0.55
ROE % 7.85 2.19
ROCE % 7.24 3.4
Financial Health
Gross Gearing % 59.92 80.91
Dividend Cover x 1.95 1.61
Interest Cover x 4.96 2.51
Quick Ratio r 0.19 0.19
Current Ratio r 0.39 0.48
Growth
DPS Growth % 0.06 0.03
Norm EPS Growth % 0.14 -0.68
Reported EPS Growth % 0.49 -0.73
Cash Flow
Cash Flow PS p 34.29 3.67
CAPEX PS p 21.17 22.2
Current ratios- It is a type of viability proportion that compares a firm's 'dynamic'
resources to its present obligations. It also implies that a 2:1 or 2 times current ratio is an
excellent liquidity ratios. However this may vary based on the sector. The current ratio
for B&M is 1.13 and 1.19 for the year 2020 and 2021 respectively while it is 0.39 and
0.48 for the same year for Morrison and thus it can be said that the latter is not placed in a
good position as compared to the market as well as while comparing it with the former
firm (Asongu and Minkoua, 2018).
Quick ratios- The quick ratio, sometimes referred as an acid test proportion, is
comparable to the previous ratio because it indicates a much more stringent assessment of
flexibility and excludes inventory from current assets. The minimal quick ratio is planned
to be 1:1. Additional analysis, as well as payable proportions and inventory receivable,
must be performed in order to decrease the quick ratio. Quick ratio for B&M is 0.48 and
Paraphrase This Document
Need a fresh take? Get an instant paraphrase of this document with our AI Paraphraser
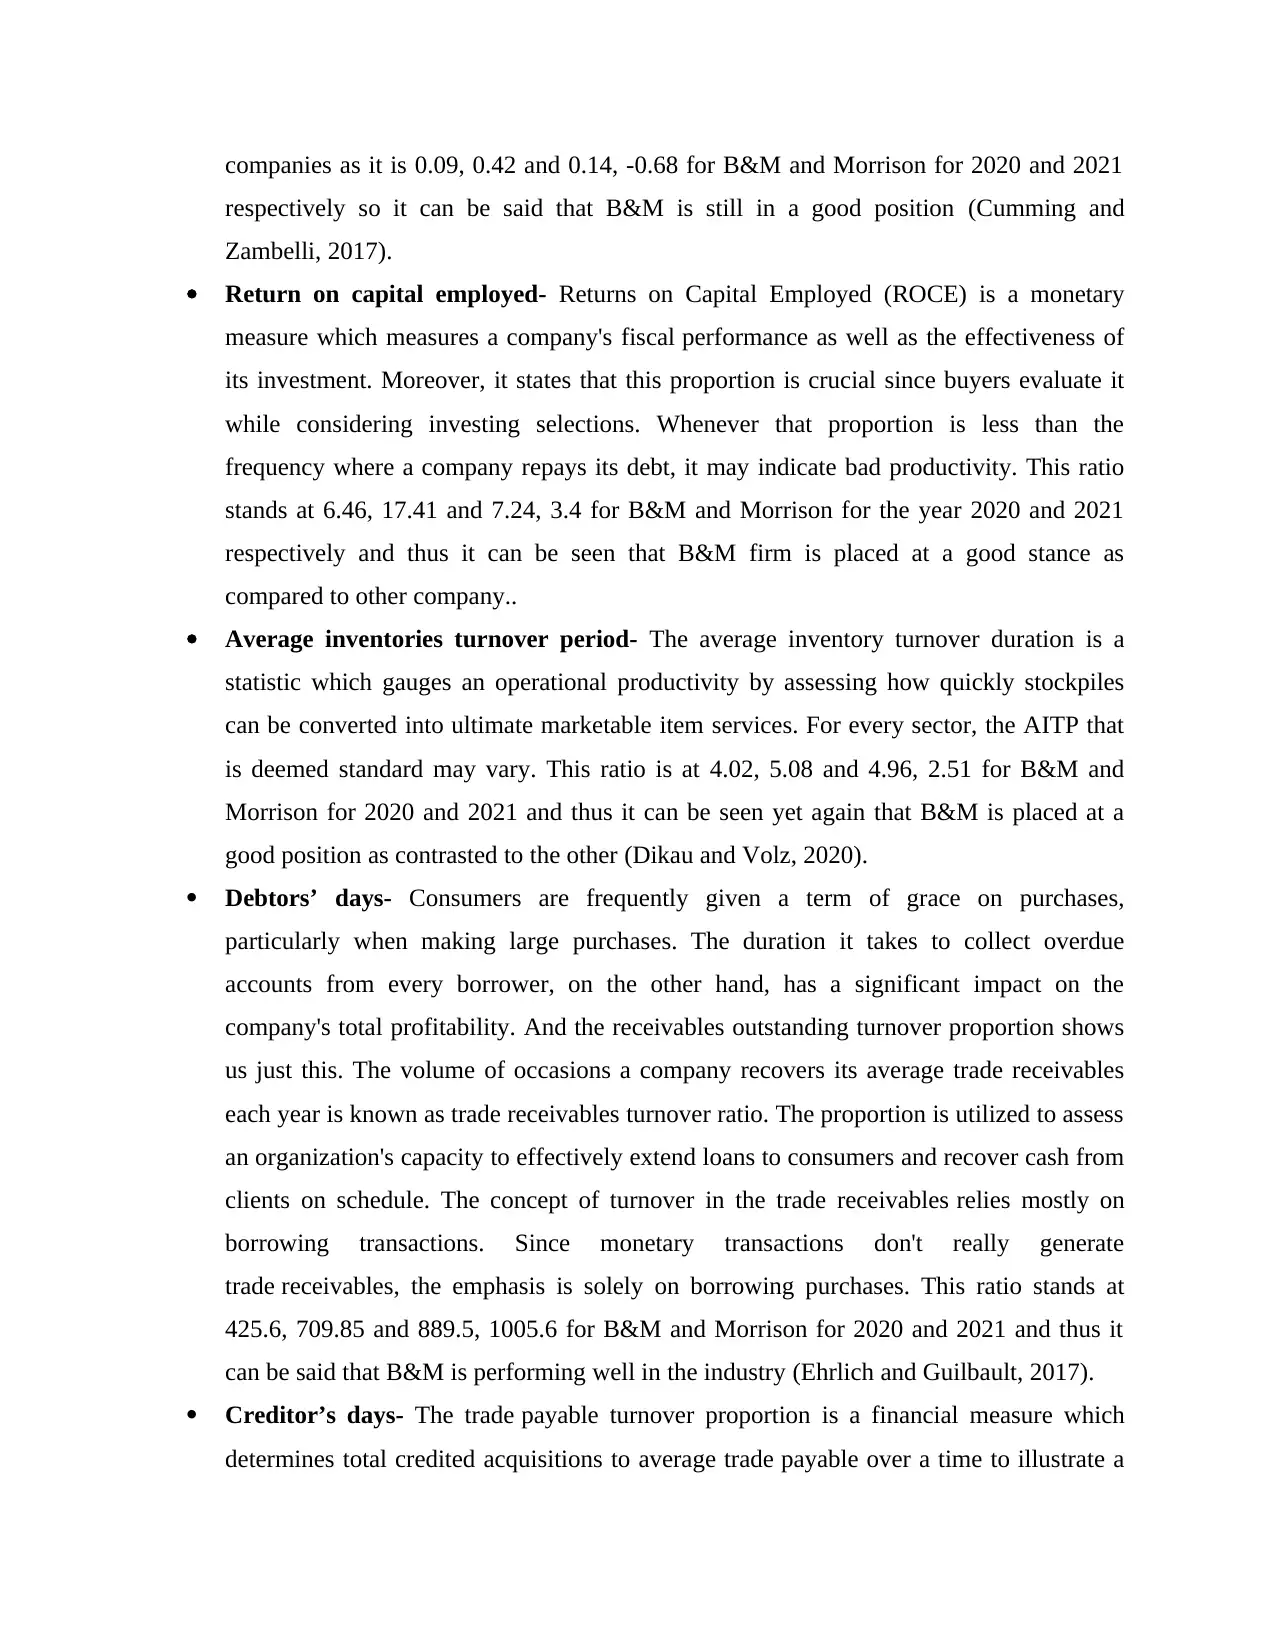
0.32 for the year 2020 and 2021 respectively while it is 0.19 and 0.19 for the same year
for Morrison so it can be said that yet again Morrison is not placed at a good position and
thus has to retrospect its operation and that too in a detailed manner (Balteș and
Minculete, 2016).
Operating profit margin- The net profit margins proportion is a type of productivity
statistic that shows that much of the income made is transformed into revenue. A
company with a better income relation or one which is the similar as the prior season may
also be a sign indicating it is performing effectively. This ratio stands at 8.3 and 12.8 for
the year 2020 and 2021 for B&M while for the same year for Morrison it stands at 3 and
1 respectively and hence it can be said that there are a number of aspects that the firm has
to look upon so that it can survive in the market for a longer time period.
Gross Profit margin- The gross margin is a metric which can be utilized to assess a
corporation's general personal and economic sustainability. It also promises to be able to
assist analysts in determining whether a business is able to supply a services or
manufacturing an item, and if so, whether it will do so effectively than its rivals. This
ratio stands at 33.6 and 36.9 for B&M while it is 19.9 and 5.5 for Morrison for the year
2020 and 2021 and thus yet again the latter company is not performing well in this aspect
and thus immediate measures has to be taken so that it can help the company in the long
run (Caselli and Roitman, 2019).
Gearing ratios- The gearing ratio calculates a corporation's fiscal exposure by
comparing the quantity of outstanding cash to the shareholders ownership. Furthermore,
it indicates that a GR of more than 50% may indicate heightened fiscal vulnerability,
whereas anywhere within 25% and 50% might be regarded acceptable. This ratio stands
at 31.1, 35.8 and 59.92, 80.91 for the year 2020 and 2021 for the companies B&M and
Morrison and thus the ratio gives a view that Morrison is not performing well in the
market.
Earnings per share- Price/Earnings ratio is a monetary proportion utilized for
evaluation. Researchers and traders utilize it to calculate the equivalent worth of a
corporation's stock in like-to-like assessments. When the P/E concentration is greater,
buyers can anticipate higher profits in the long term, and whenever the P/E level is lower,
buyers can anticipate lower returns. This ratio is not in a very good position for both the
companies as it is 0.09, 0.42 and 0.14, -0.68 for B&M and Morrison for 2020 and 2021
respectively so it can be said that B&M is still in a good position (Cumming and
Zambelli, 2017).
Return on capital employed- Returns on Capital Employed (ROCE) is a monetary
measure which measures a company's fiscal performance as well as the effectiveness of
its investment. Moreover, it states that this proportion is crucial since buyers evaluate it
while considering investing selections. Whenever that proportion is less than the
frequency where a company repays its debt, it may indicate bad productivity. This ratio
stands at 6.46, 17.41 and 7.24, 3.4 for B&M and Morrison for the year 2020 and 2021
respectively and thus it can be seen that B&M firm is placed at a good stance as
compared to other company..
Average inventories turnover period- The average inventory turnover duration is a
statistic which gauges an operational productivity by assessing how quickly stockpiles
can be converted into ultimate marketable item services. For every sector, the AITP that
is deemed standard may vary. This ratio is at 4.02, 5.08 and 4.96, 2.51 for B&M and
Morrison for 2020 and 2021 and thus it can be seen yet again that B&M is placed at a
good position as contrasted to the other (Dikau and Volz, 2020).
Debtors’ days- Consumers are frequently given a term of grace on purchases,
particularly when making large purchases. The duration it takes to collect overdue
accounts from every borrower, on the other hand, has a significant impact on the
company's total profitability. And the receivables outstanding turnover proportion shows
us just this. The volume of occasions a company recovers its average trade receivables
each year is known as trade receivables turnover ratio. The proportion is utilized to assess
an organization's capacity to effectively extend loans to consumers and recover cash from
clients on schedule. The concept of turnover in the trade receivables relies mostly on
borrowing transactions. Since monetary transactions don't really generate
trade receivables, the emphasis is solely on borrowing purchases. This ratio stands at
425.6, 709.85 and 889.5, 1005.6 for B&M and Morrison for 2020 and 2021 and thus it
can be said that B&M is performing well in the industry (Ehrlich and Guilbault, 2017).
Creditor’s days- The trade payable turnover proportion is a financial measure which
determines total credited acquisitions to average trade payable over a time to illustrate a
⊘ This is a preview!⊘
Do you want full access?
Subscribe today to unlock all pages.
Trusted by 1+ million students worldwide
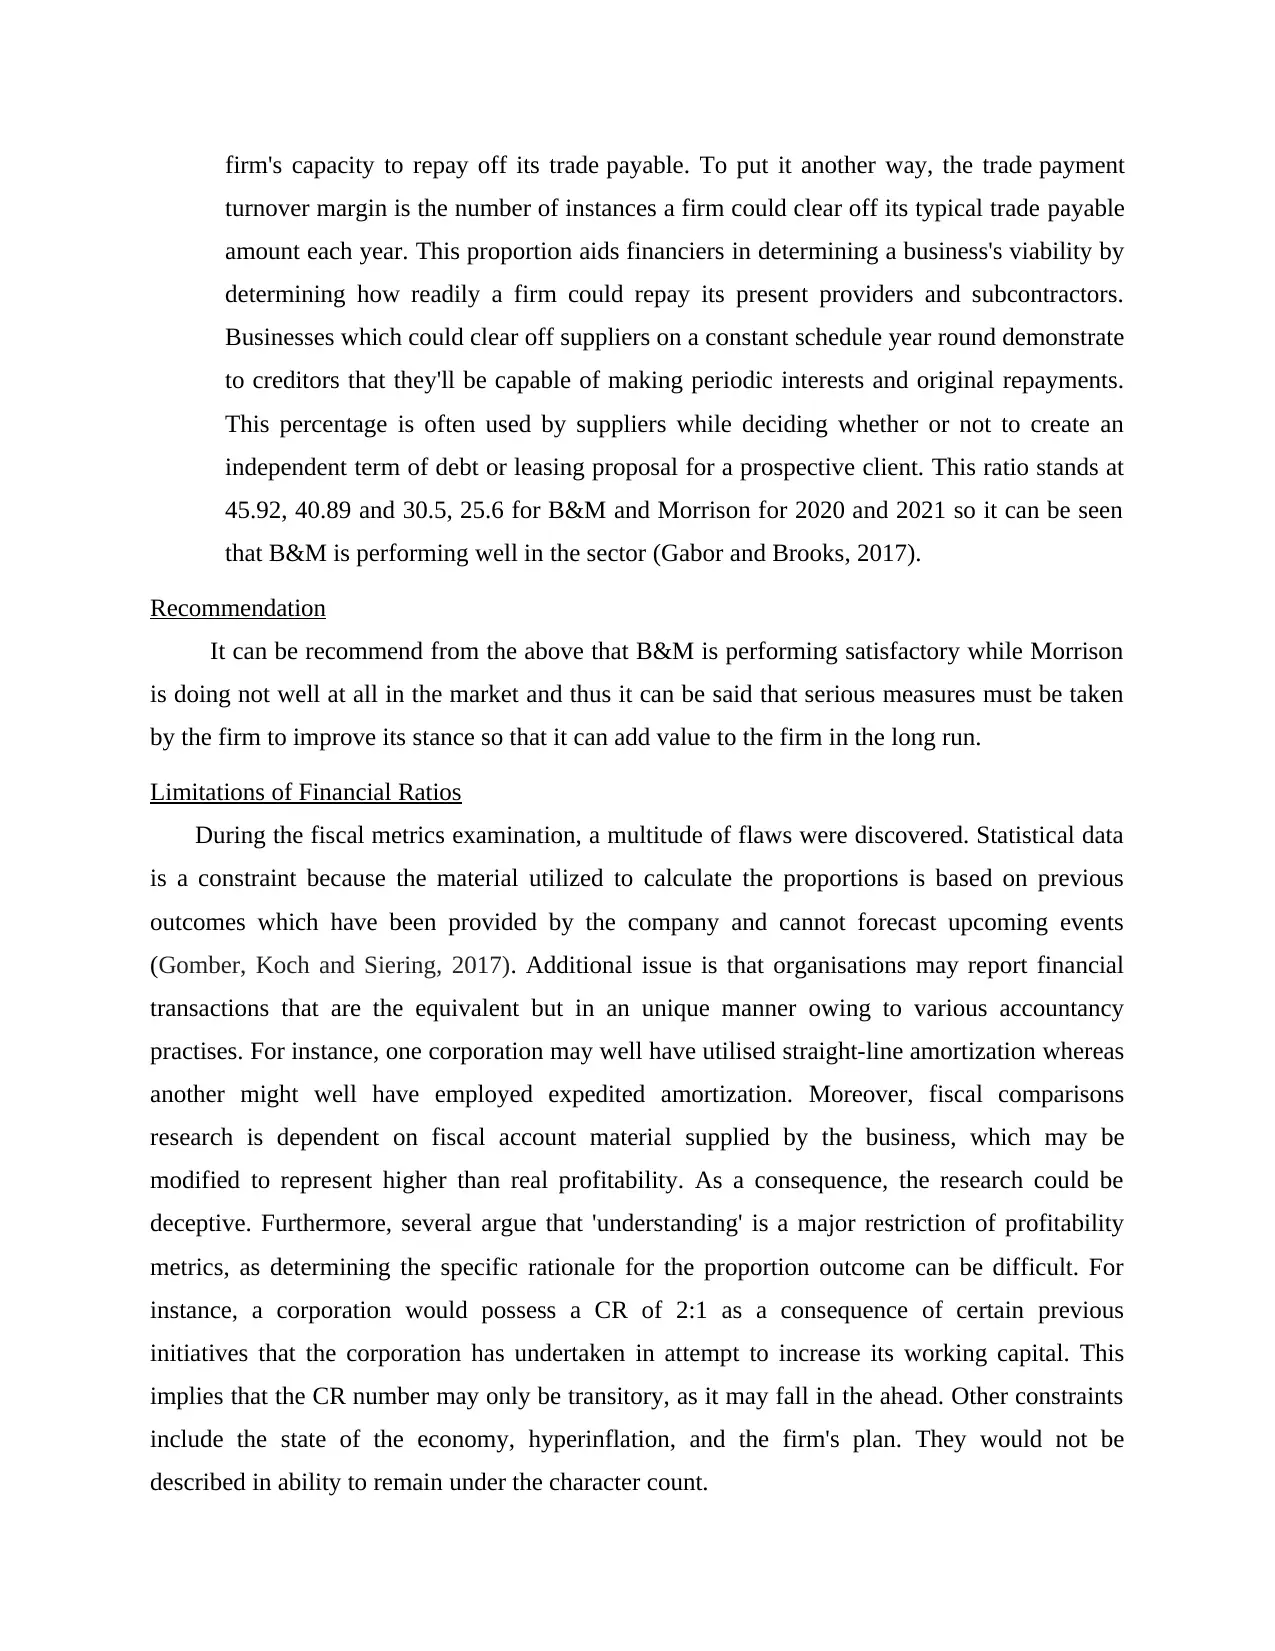
firm's capacity to repay off its trade payable. To put it another way, the trade payment
turnover margin is the number of instances a firm could clear off its typical trade payable
amount each year. This proportion aids financiers in determining a business's viability by
determining how readily a firm could repay its present providers and subcontractors.
Businesses which could clear off suppliers on a constant schedule year round demonstrate
to creditors that they'll be capable of making periodic interests and original repayments.
This percentage is often used by suppliers while deciding whether or not to create an
independent term of debt or leasing proposal for a prospective client. This ratio stands at
45.92, 40.89 and 30.5, 25.6 for B&M and Morrison for 2020 and 2021 so it can be seen
that B&M is performing well in the sector (Gabor and Brooks, 2017).
Recommendation
It can be recommend from the above that B&M is performing satisfactory while Morrison
is doing not well at all in the market and thus it can be said that serious measures must be taken
by the firm to improve its stance so that it can add value to the firm in the long run.
Limitations of Financial Ratios
During the fiscal metrics examination, a multitude of flaws were discovered. Statistical data
is a constraint because the material utilized to calculate the proportions is based on previous
outcomes which have been provided by the company and cannot forecast upcoming events
(Gomber, Koch and Siering, 2017). Additional issue is that organisations may report financial
transactions that are the equivalent but in an unique manner owing to various accountancy
practises. For instance, one corporation may well have utilised straight-line amortization whereas
another might well have employed expedited amortization. Moreover, fiscal comparisons
research is dependent on fiscal account material supplied by the business, which may be
modified to represent higher than real profitability. As a consequence, the research could be
deceptive. Furthermore, several argue that 'understanding' is a major restriction of profitability
metrics, as determining the specific rationale for the proportion outcome can be difficult. For
instance, a corporation would possess a CR of 2:1 as a consequence of certain previous
initiatives that the corporation has undertaken in attempt to increase its working capital. This
implies that the CR number may only be transitory, as it may fall in the ahead. Other constraints
include the state of the economy, hyperinflation, and the firm's plan. They would not be
described in ability to remain under the character count.
Paraphrase This Document
Need a fresh take? Get an instant paraphrase of this document with our AI Paraphraser
Portfolio 2
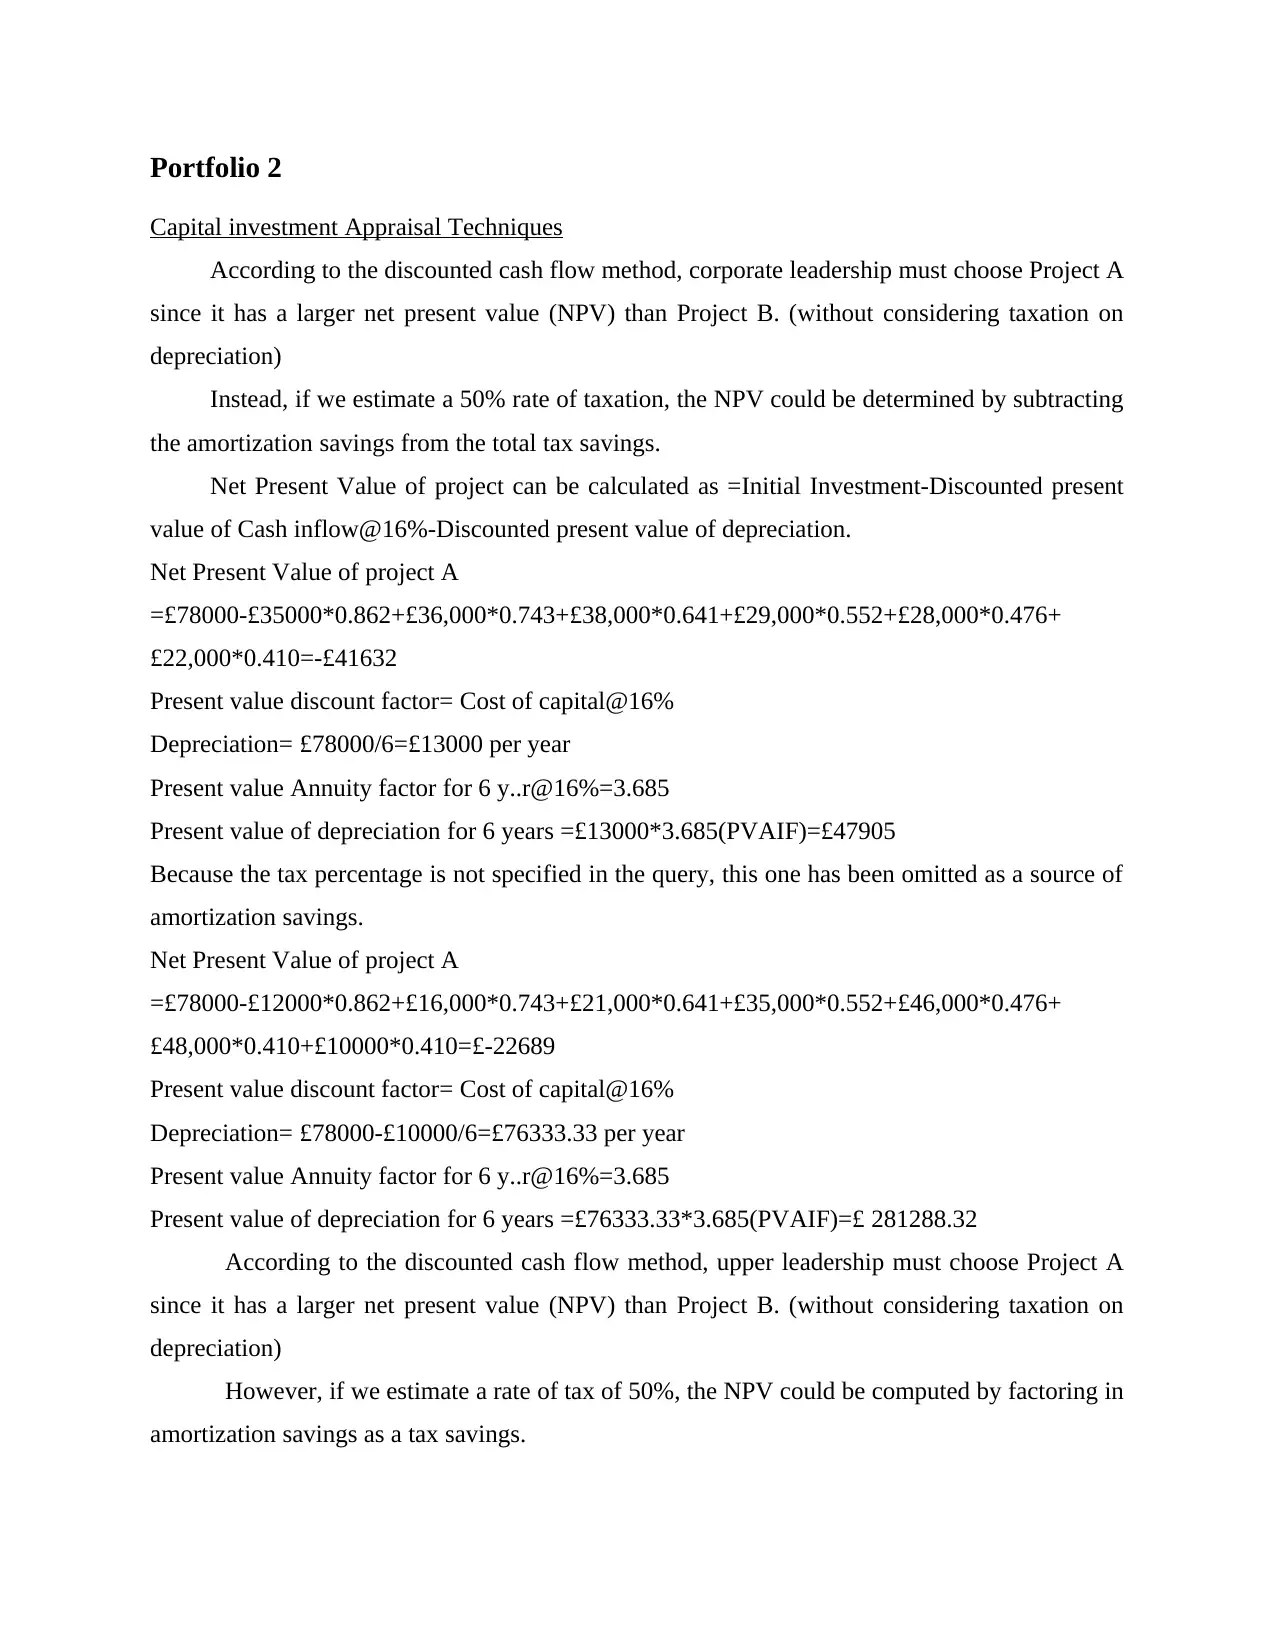
Capital investment Appraisal Techniques
According to the discounted cash flow method, corporate leadership must choose Project A
since it has a larger net present value (NPV) than Project B. (without considering taxation on
depreciation)
Instead, if we estimate a 50% rate of taxation, the NPV could be determined by subtracting
the amortization savings from the total tax savings.
Net Present Value of project can be calculated as =Initial Investment-Discounted present
value of Cash inflow@16%-Discounted present value of depreciation.
Net Present Value of project A
=£78000-£35000*0.862+£36,000*0.743+£38,000*0.641+£29,000*0.552+£28,000*0.476+
£22,000*0.410=-£41632
Present value discount factor= Cost of capital@16%
Depreciation= £78000/6=£13000 per year
Present value Annuity factor for 6 y..r@16%=3.685
Present value of depreciation for 6 years =£13000*3.685(PVAIF)=£47905
Because the tax percentage is not specified in the query, this one has been omitted as a source of
amortization savings.
Net Present Value of project A
=£78000-£12000*0.862+£16,000*0.743+£21,000*0.641+£35,000*0.552+£46,000*0.476+
£48,000*0.410+£10000*0.410=£-22689
Present value discount factor= Cost of capital@16%
Depreciation= £78000-£10000/6=£76333.33 per year
Present value Annuity factor for 6 y..r@16%=3.685
Present value of depreciation for 6 years =£76333.33*3.685(PVAIF)=£ 281288.32
According to the discounted cash flow method, upper leadership must choose Project A
since it has a larger net present value (NPV) than Project B. (without considering taxation on
depreciation)
However, if we estimate a rate of tax of 50%, the NPV could be computed by factoring in
amortization savings as a tax savings.
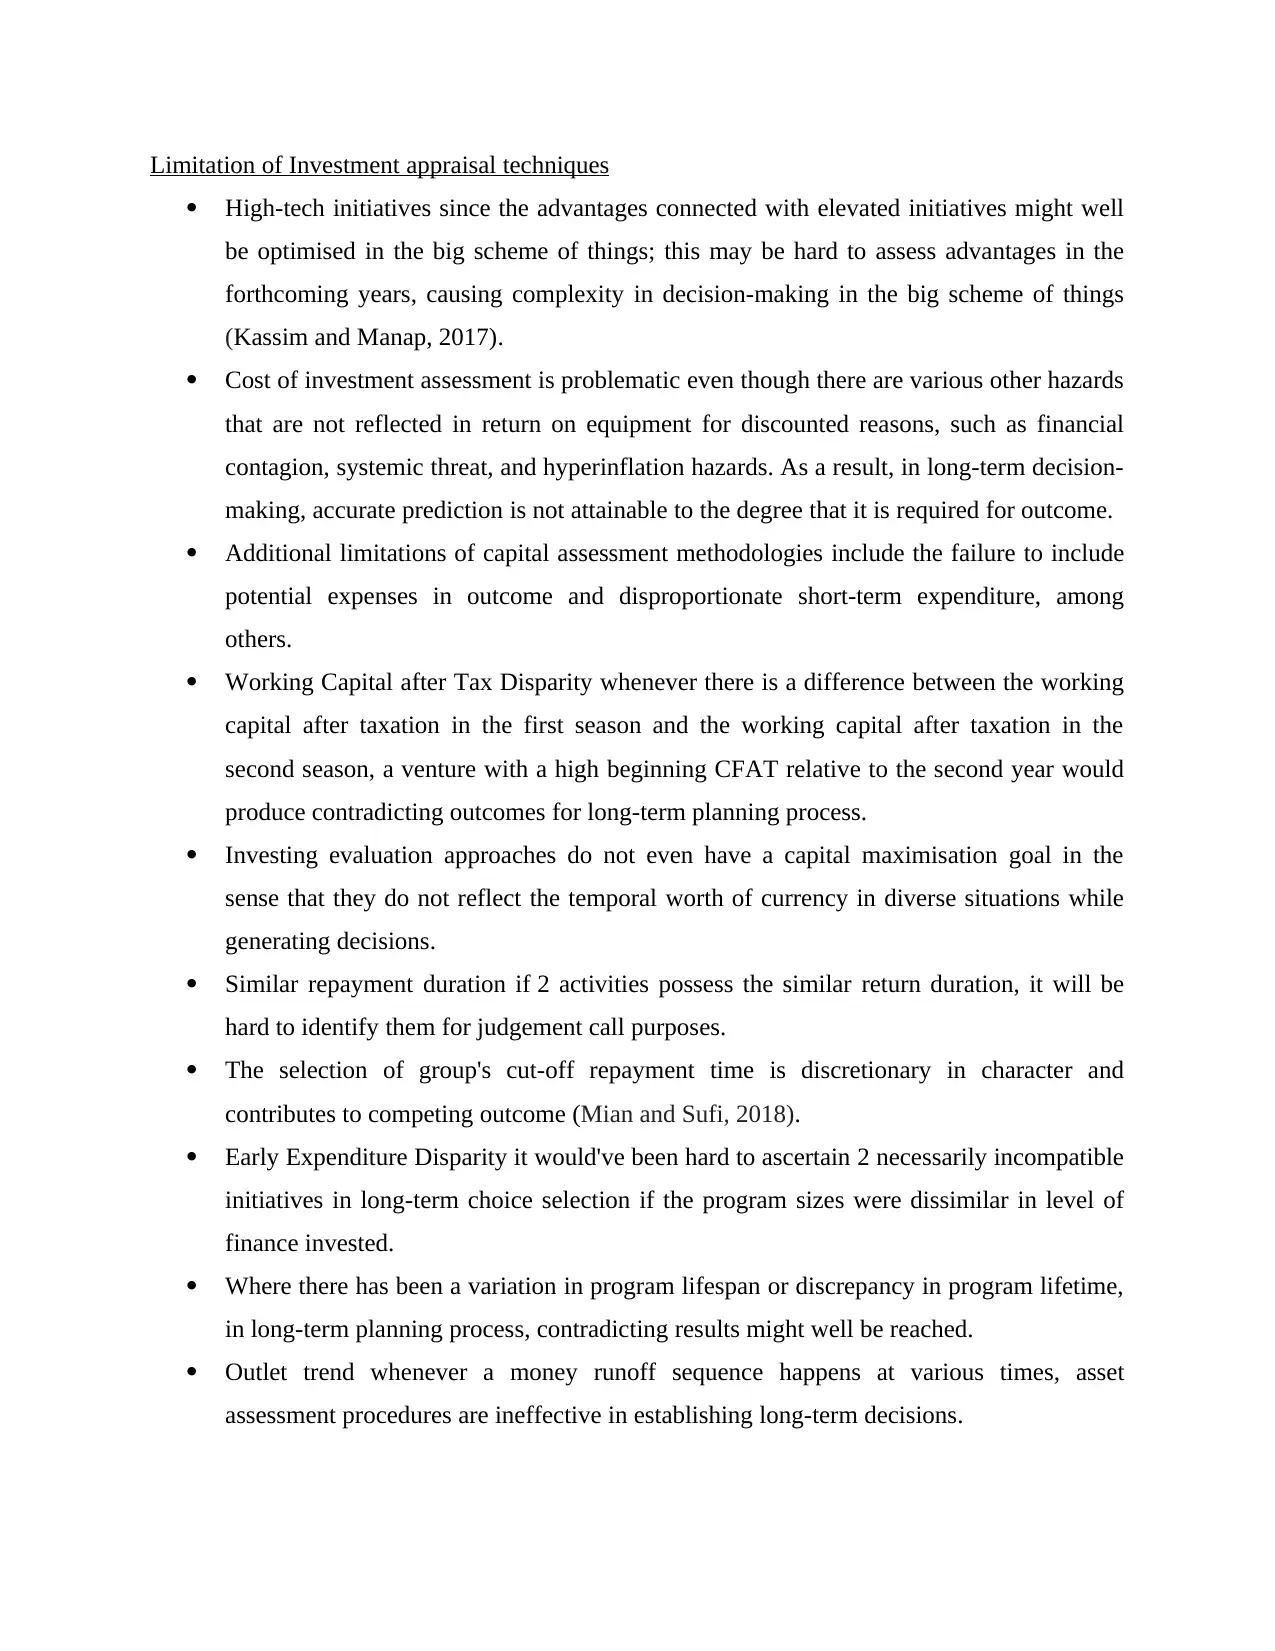
Limitation of Investment appraisal techniques
High-tech initiatives since the advantages connected with elevated initiatives might well
be optimised in the big scheme of things; this may be hard to assess advantages in the
forthcoming years, causing complexity in decision-making in the big scheme of things
(Kassim and Manap, 2017).
Cost of investment assessment is problematic even though there are various other hazards
that are not reflected in return on equipment for discounted reasons, such as financial
contagion, systemic threat, and hyperinflation hazards. As a result, in long-term decision-
making, accurate prediction is not attainable to the degree that it is required for outcome.
Additional limitations of capital assessment methodologies include the failure to include
potential expenses in outcome and disproportionate short-term expenditure, among
others.
Working Capital after Tax Disparity whenever there is a difference between the working
capital after taxation in the first season and the working capital after taxation in the
second season, a venture with a high beginning CFAT relative to the second year would
produce contradicting outcomes for long-term planning process.
Investing evaluation approaches do not even have a capital maximisation goal in the
sense that they do not reflect the temporal worth of currency in diverse situations while
generating decisions.
Similar repayment duration if 2 activities possess the similar return duration, it will be
hard to identify them for judgement call purposes.
The selection of group's cut-off repayment time is discretionary in character and
contributes to competing outcome (Mian and Sufi, 2018).
Early Expenditure Disparity it would've been hard to ascertain 2 necessarily incompatible
initiatives in long-term choice selection if the program sizes were dissimilar in level of
finance invested.
Where there has been a variation in program lifespan or discrepancy in program lifetime,
in long-term planning process, contradicting results might well be reached.
Outlet trend whenever a money runoff sequence happens at various times, asset
assessment procedures are ineffective in establishing long-term decisions.
⊘ This is a preview!⊘
Do you want full access?
Subscribe today to unlock all pages.
Trusted by 1+ million students worldwide
1 out of 14
Related Documents


Your All-in-One AI-Powered Toolkit for Academic Success.
+13062052269
info@desklib.com
Available 24*7 on WhatsApp / Email
![[object Object]](/_next/static/media/star-bottom.7253800d.svg)
Unlock your academic potential
Copyright © 2020–2026 A2Z Services. All Rights Reserved. Developed and managed by ZUCOL.