Financial Statement Analysis and Ratio Interpretation
VerifiedAdded on 2020/05/28
|13
|4182
|55
AI Summary
This assignment focuses on the analysis of financial statements through the lens of various financial ratios. Students are tasked with interpreting the meaning of these ratios in assessing a company's profitability, liquidity, solvency, and overall financial health. The assignment likely includes examples, case studies, or practical applications to illustrate how ratio analysis can be used for making informed business decisions.
Contribute Materials
Your contribution can guide someone’s learning journey. Share your
documents today.

Running Head: Managerial Finance
Ratio analyis
Ratio analyis
Secure Best Marks with AI Grader
Need help grading? Try our AI Grader for instant feedback on your assignments.
Managerial Finance 1
Contents
Introduction...........................................................................................................................................2
Financial data........................................................................................................................................2
Salesforce..........................................................................................................................................2
Cisco Systems, Inc.............................................................................................................................4
Ratio analysis........................................................................................................................................5
Comparing over the past 3 years........................................................................................................5
Liquidity ratios..............................................................................................................................5
Efficiency ratios.............................................................................................................................6
Profitability ratios..........................................................................................................................7
Capital structure ratios...................................................................................................................8
Comparing with Cisco Corporation...................................................................................................8
Conclusion...........................................................................................................................................10
References...........................................................................................................................................11
Managerial Finance 2
Introduction
Financial analysis is a process of measuring viability and profitability of a business or a
business project. It includes the analysis of the financial statements of the company, which
are prepared at the end of fiscal year. It helps in assessing the liquidity, efficiency,
profitability of its business and shows its overall finance structure (Vogel, 2014).This report
contains a critical examination of the financial performance and position of Salesforce over
the past three years and its comparison with its competitor company named as Cisco Systems.
Both the companies are in the list of World’s best workplace 2017, according to Great Place
to Work Institute. The evaluation is done to know about how the company is performing in
financial aspects and what it is contributing to the overall development of the country (Lee,
Lee & Lee, 2009).
Salesforce is an American cloud computing company having its headquarters in San
Francisco, California. Most of its revenue comes from Customer Relationship Management
(CRM) product and is considered to be the world’s first CRM platform. Salesforce topped the
list of best workplaces 2017 generated by the Great Place to Work Institute. The company
sells products like sales cloud, Salesforce CPQ, service cloud, commerce cloud and many
other commercial applications of social networking. It is listed on New York Stock Exchange
with a symbol of CRM and is a component of S&P 500 Index ("Salesforce", 2018).
Cisco systems, Inc. is a multinational technology company operating in America. The
headquarters of the company are situated in San Jose, California. Cisco deals in
manufacturing and selling of networking hardware, telecommunications equipment and other
products and services of high technology. It ranked 19th on the list of best workplaces,
according to Great Place to Work Institute. The company is one of the competitor of
Salesforce and its people and products helps in connecting the society securely and seizing
tomorrow’s opportunity today ("Cisco - Global Home Page", 2018).
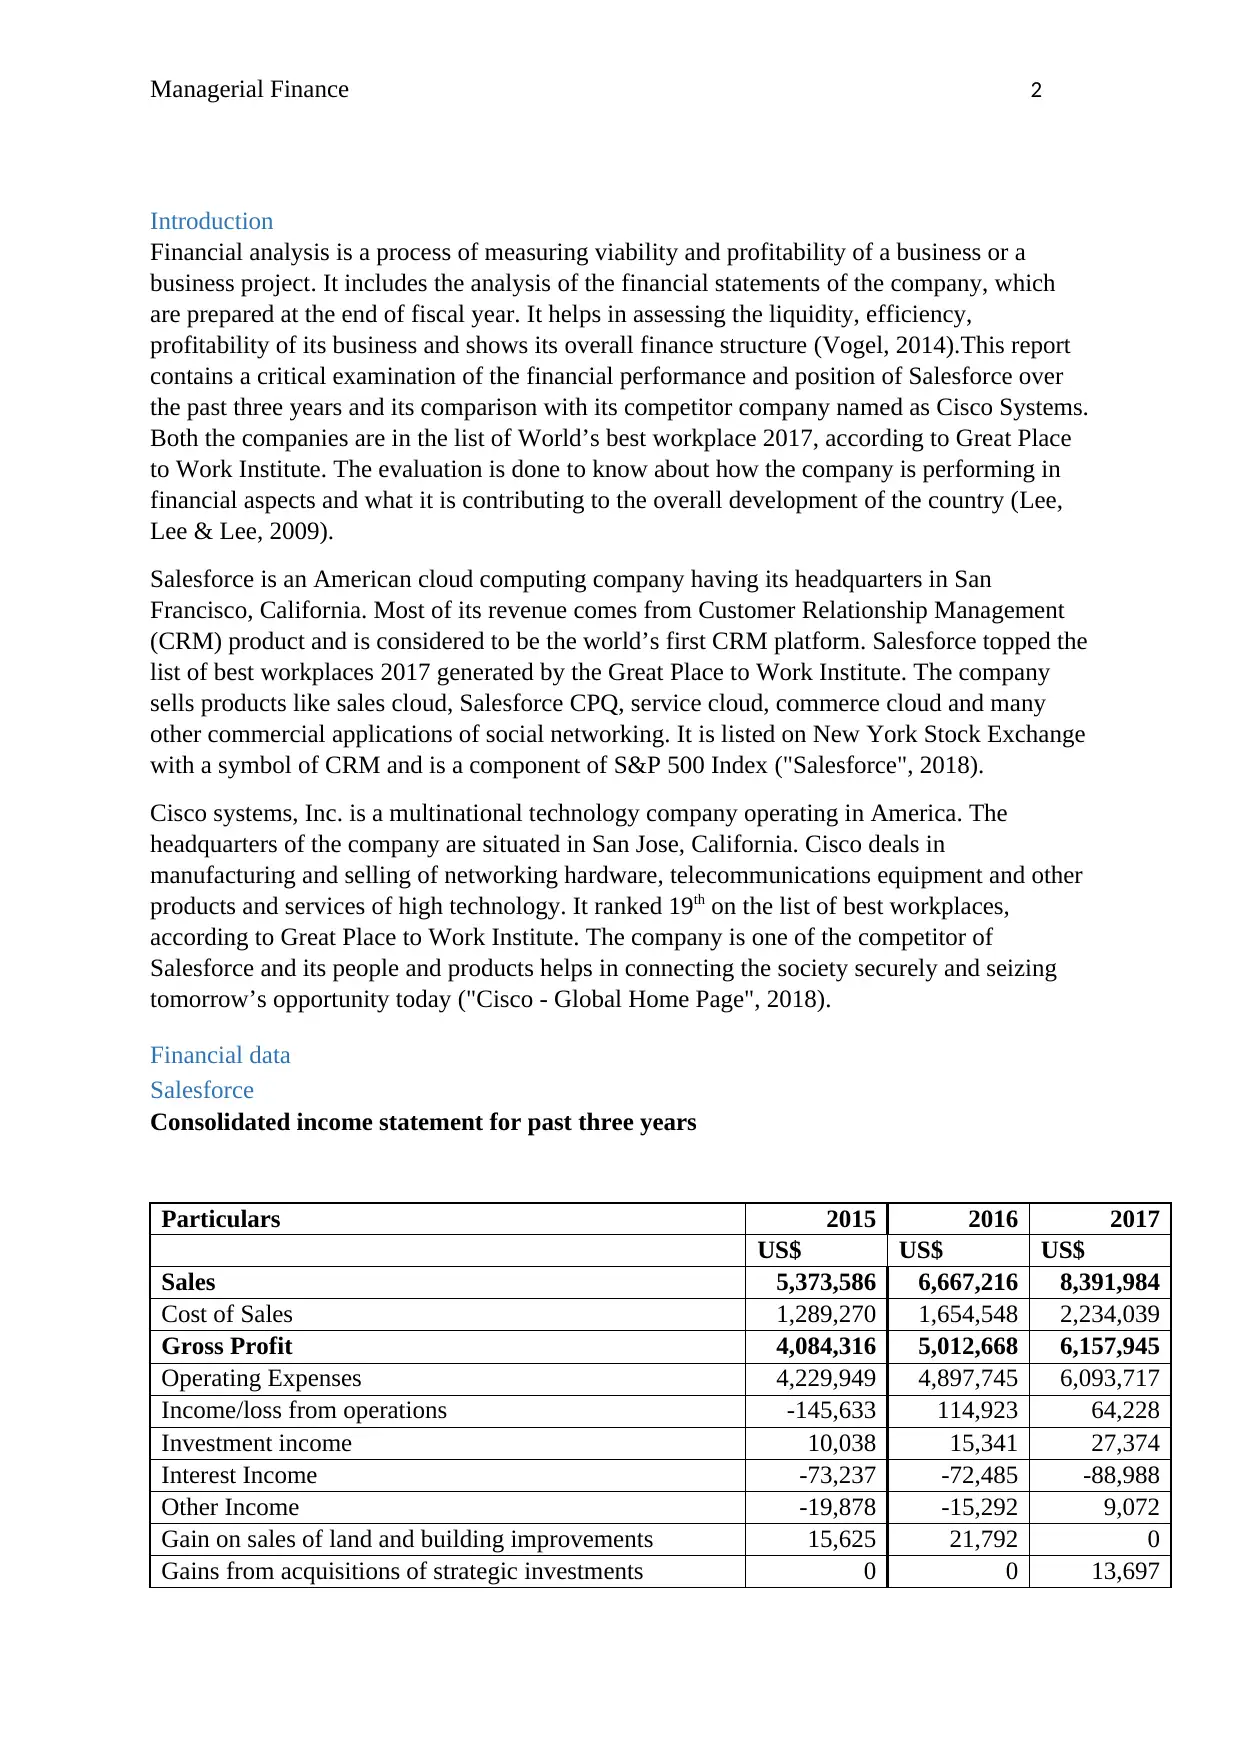
Financial data
Salesforce
Consolidated income statement for past three years
Particulars 2015 2016 2017
US$ US$ US$
Sales 5,373,586 6,667,216 8,391,984
Cost of Sales 1,289,270 1,654,548 2,234,039
Gross Profit 4,084,316 5,012,668 6,157,945
Operating Expenses 4,229,949 4,897,745 6,093,717
Income/loss from operations -145,633 114,923 64,228
Investment income 10,038 15,341 27,374
Interest Income -73,237 -72,485 -88,988
Other Income -19,878 -15,292 9,072
Gain on sales of land and building improvements 15,625 21,792 0
Gains from acquisitions of strategic investments 0 0 13,697
Introduction
Financial analysis is a process of measuring viability and profitability of a business or a
business project. It includes the analysis of the financial statements of the company, which
are prepared at the end of fiscal year. It helps in assessing the liquidity, efficiency,
profitability of its business and shows its overall finance structure (Vogel, 2014).This report
contains a critical examination of the financial performance and position of Salesforce over
the past three years and its comparison with its competitor company named as Cisco Systems.
Both the companies are in the list of World’s best workplace 2017, according to Great Place
to Work Institute. The evaluation is done to know about how the company is performing in
financial aspects and what it is contributing to the overall development of the country (Lee,
Lee & Lee, 2009).
Salesforce is an American cloud computing company having its headquarters in San
Francisco, California. Most of its revenue comes from Customer Relationship Management
(CRM) product and is considered to be the world’s first CRM platform. Salesforce topped the
list of best workplaces 2017 generated by the Great Place to Work Institute. The company
sells products like sales cloud, Salesforce CPQ, service cloud, commerce cloud and many
other commercial applications of social networking. It is listed on New York Stock Exchange
with a symbol of CRM and is a component of S&P 500 Index ("Salesforce", 2018).
Cisco systems, Inc. is a multinational technology company operating in America. The
headquarters of the company are situated in San Jose, California. Cisco deals in
manufacturing and selling of networking hardware, telecommunications equipment and other
products and services of high technology. It ranked 19th on the list of best workplaces,
according to Great Place to Work Institute. The company is one of the competitor of
Salesforce and its people and products helps in connecting the society securely and seizing
tomorrow’s opportunity today ("Cisco - Global Home Page", 2018).
Financial data
Salesforce
Consolidated income statement for past three years
Particulars 2015 2016 2017
US$ US$ US$
Sales 5,373,586 6,667,216 8,391,984
Cost of Sales 1,289,270 1,654,548 2,234,039
Gross Profit 4,084,316 5,012,668 6,157,945
Operating Expenses 4,229,949 4,897,745 6,093,717
Income/loss from operations -145,633 114,923 64,228
Investment income 10,038 15,341 27,374
Interest Income -73,237 -72,485 -88,988
Other Income -19,878 -15,292 9,072
Gain on sales of land and building improvements 15,625 21,792 0
Gains from acquisitions of strategic investments 0 0 13,697
Managerial Finance 3
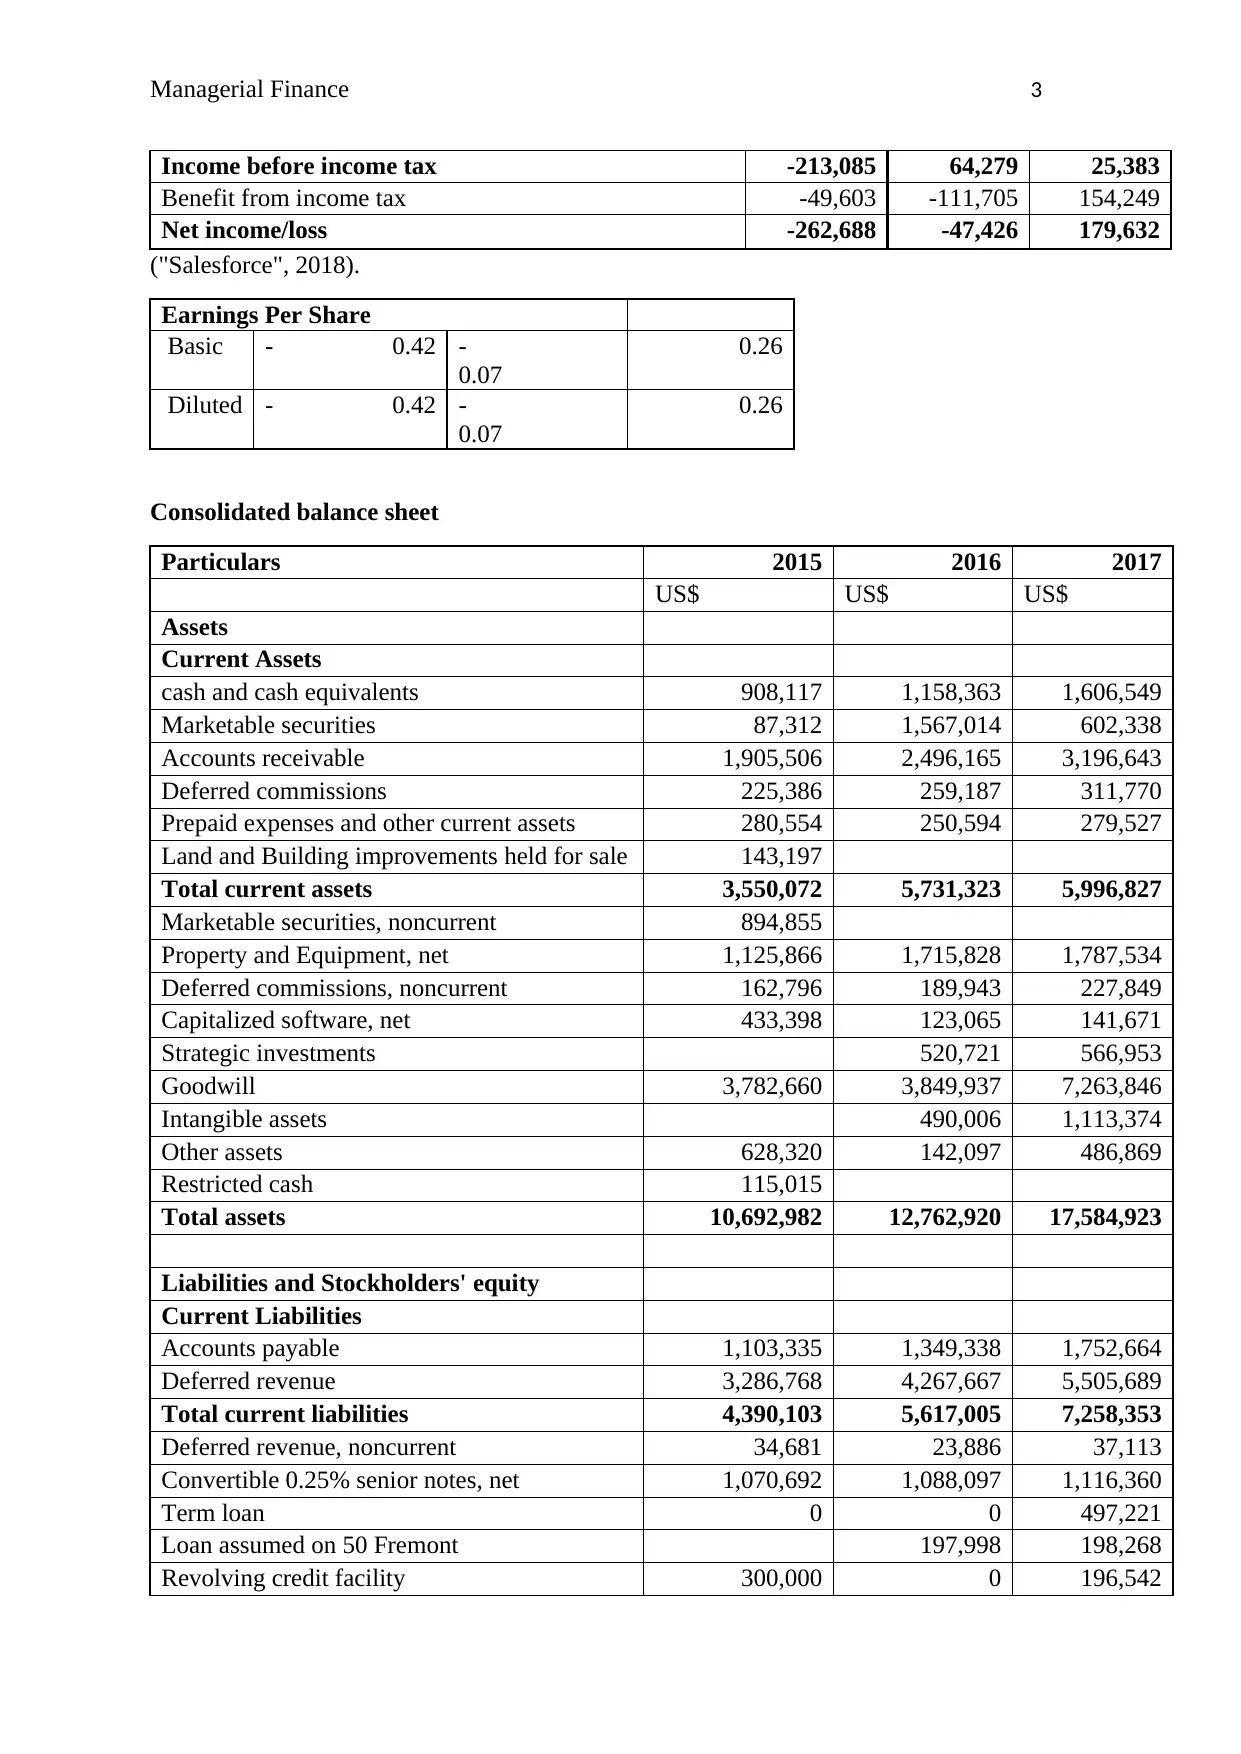
Income before income tax -213,085 64,279 25,383
Benefit from income tax -49,603 -111,705 154,249
Net income/loss -262,688 -47,426 179,632
("Salesforce", 2018).
Earnings Per Share
Basic - 0.42 -
0.07
0.26
Diluted - 0.42 -
0.07
0.26
Consolidated balance sheet
Particulars 2015 2016 2017
US$ US$ US$
Assets
Current Assets
cash and cash equivalents 908,117 1,158,363 1,606,549
Marketable securities 87,312 1,567,014 602,338
Accounts receivable 1,905,506 2,496,165 3,196,643
Deferred commissions 225,386 259,187 311,770
Prepaid expenses and other current assets 280,554 250,594 279,527
Land and Building improvements held for sale 143,197
Total current assets 3,550,072 5,731,323 5,996,827
Marketable securities, noncurrent 894,855
Property and Equipment, net 1,125,866 1,715,828 1,787,534
Deferred commissions, noncurrent 162,796 189,943 227,849
Capitalized software, net 433,398 123,065 141,671
Strategic investments 520,721 566,953
Goodwill 3,782,660 3,849,937 7,263,846
Intangible assets 490,006 1,113,374
Other assets 628,320 142,097 486,869
Restricted cash 115,015
Total assets 10,692,982 12,762,920 17,584,923
Liabilities and Stockholders' equity
Current Liabilities
Accounts payable 1,103,335 1,349,338 1,752,664
Deferred revenue 3,286,768 4,267,667 5,505,689
Total current liabilities 4,390,103 5,617,005 7,258,353
Deferred revenue, noncurrent 34,681 23,886 37,113
Convertible 0.25% senior notes, net 1,070,692 1,088,097 1,116,360
Term loan 0 0 497,221
Loan assumed on 50 Fremont 197,998 198,268
Revolving credit facility 300,000 0 196,542
Secure Best Marks with AI Grader
Need help grading? Try our AI Grader for instant feedback on your assignments.
Managerial Finance 4
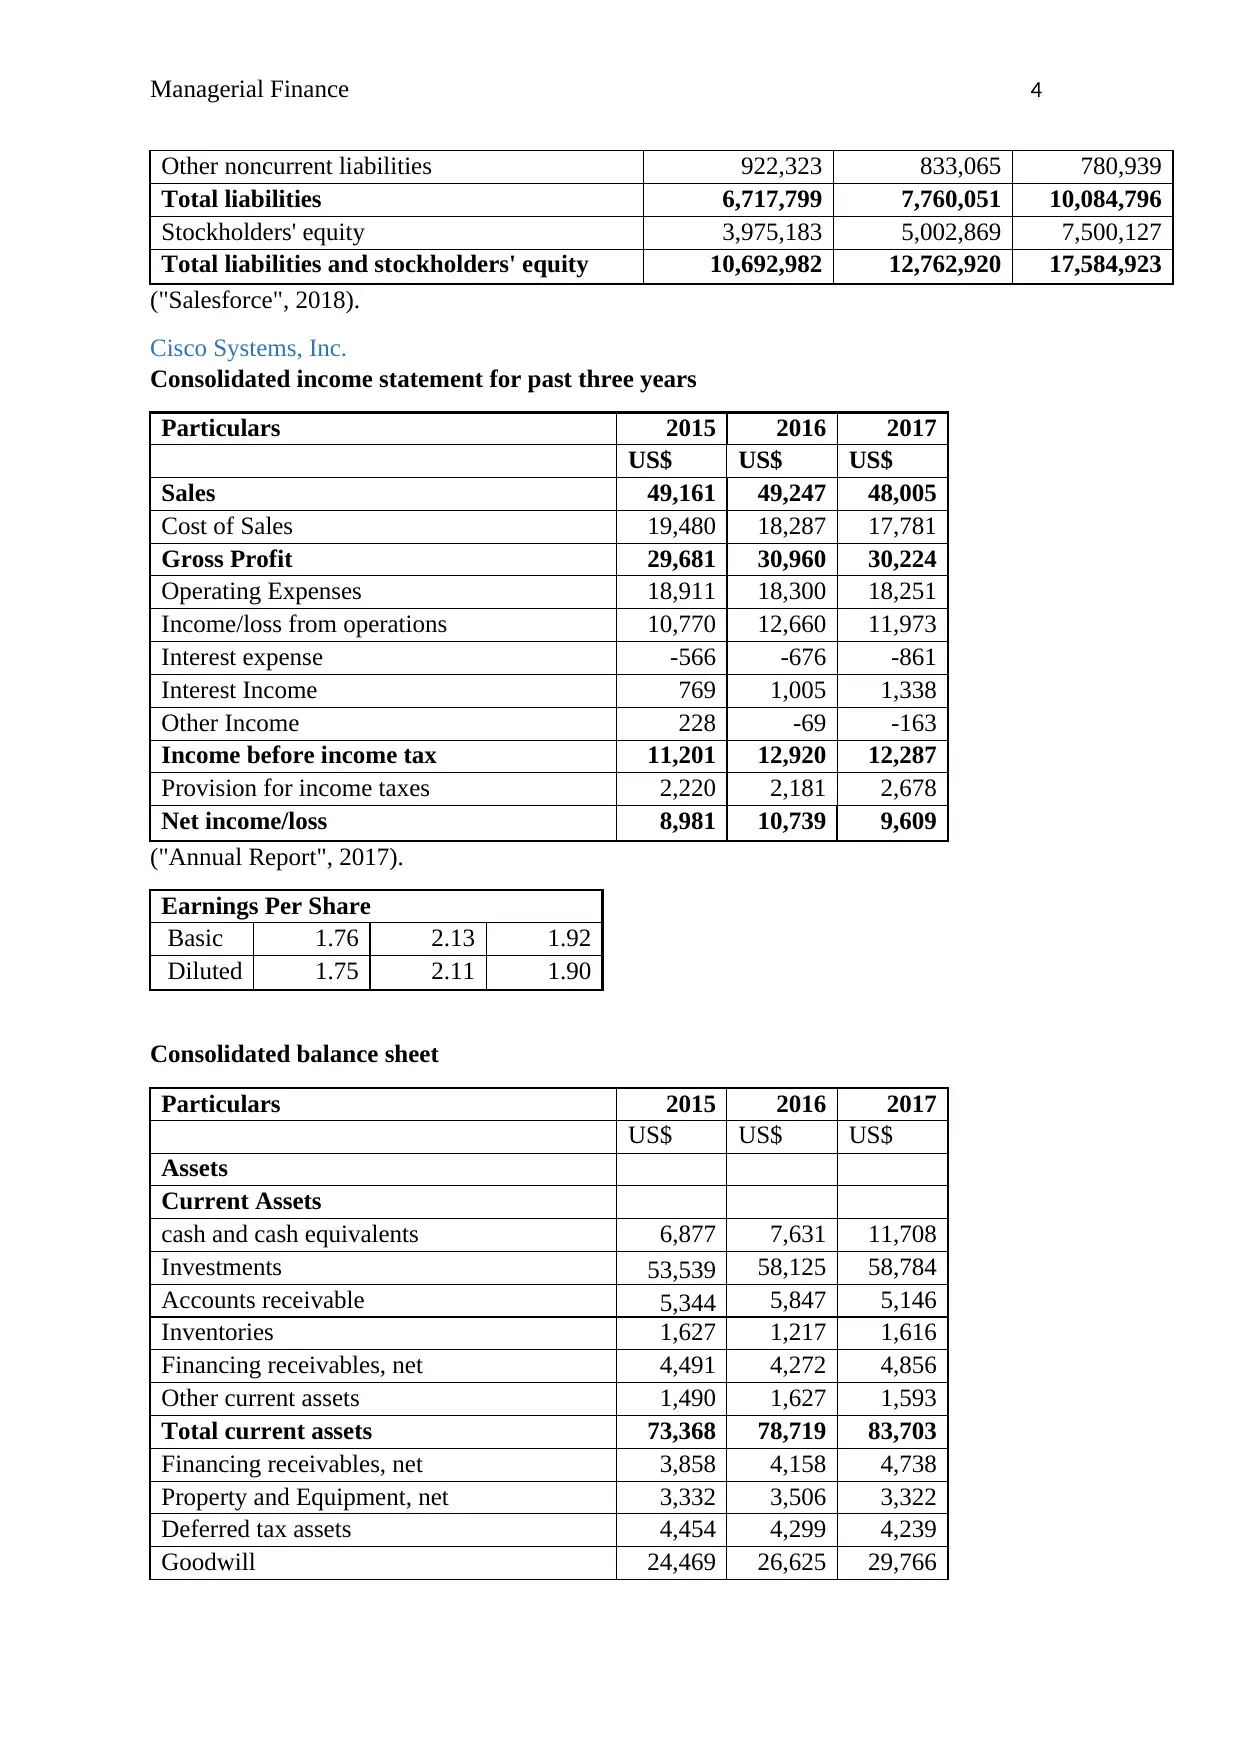
Other noncurrent liabilities 922,323 833,065 780,939
Total liabilities 6,717,799 7,760,051 10,084,796
Stockholders' equity 3,975,183 5,002,869 7,500,127
Total liabilities and stockholders' equity 10,692,982 12,762,920 17,584,923
("Salesforce", 2018).
Cisco Systems, Inc.
Consolidated income statement for past three years
Particulars 2015 2016 2017
US$ US$ US$
Sales 49,161 49,247 48,005
Cost of Sales 19,480 18,287 17,781
Gross Profit 29,681 30,960 30,224
Operating Expenses 18,911 18,300 18,251
Income/loss from operations 10,770 12,660 11,973
Interest expense -566 -676 -861
Interest Income 769 1,005 1,338
Other Income 228 -69 -163
Income before income tax 11,201 12,920 12,287
Provision for income taxes 2,220 2,181 2,678
Net income/loss 8,981 10,739 9,609
("Annual Report", 2017).
Earnings Per Share
Basic 1.76 2.13 1.92
Diluted 1.75 2.11 1.90
Consolidated balance sheet
Particulars 2015 2016 2017
US$ US$ US$
Assets
Current Assets
cash and cash equivalents 6,877 7,631 11,708
Investments 53,539 58,125 58,784
Accounts receivable 5,344 5,847 5,146
Inventories 1,627 1,217 1,616
Financing receivables, net 4,491 4,272 4,856
Other current assets 1,490 1,627 1,593
Total current assets 73,368 78,719 83,703
Financing receivables, net 3,858 4,158 4,738
Property and Equipment, net 3,332 3,506 3,322
Deferred tax assets 4,454 4,299 4,239
Goodwill 24,469 26,625 29,766
Managerial Finance 5
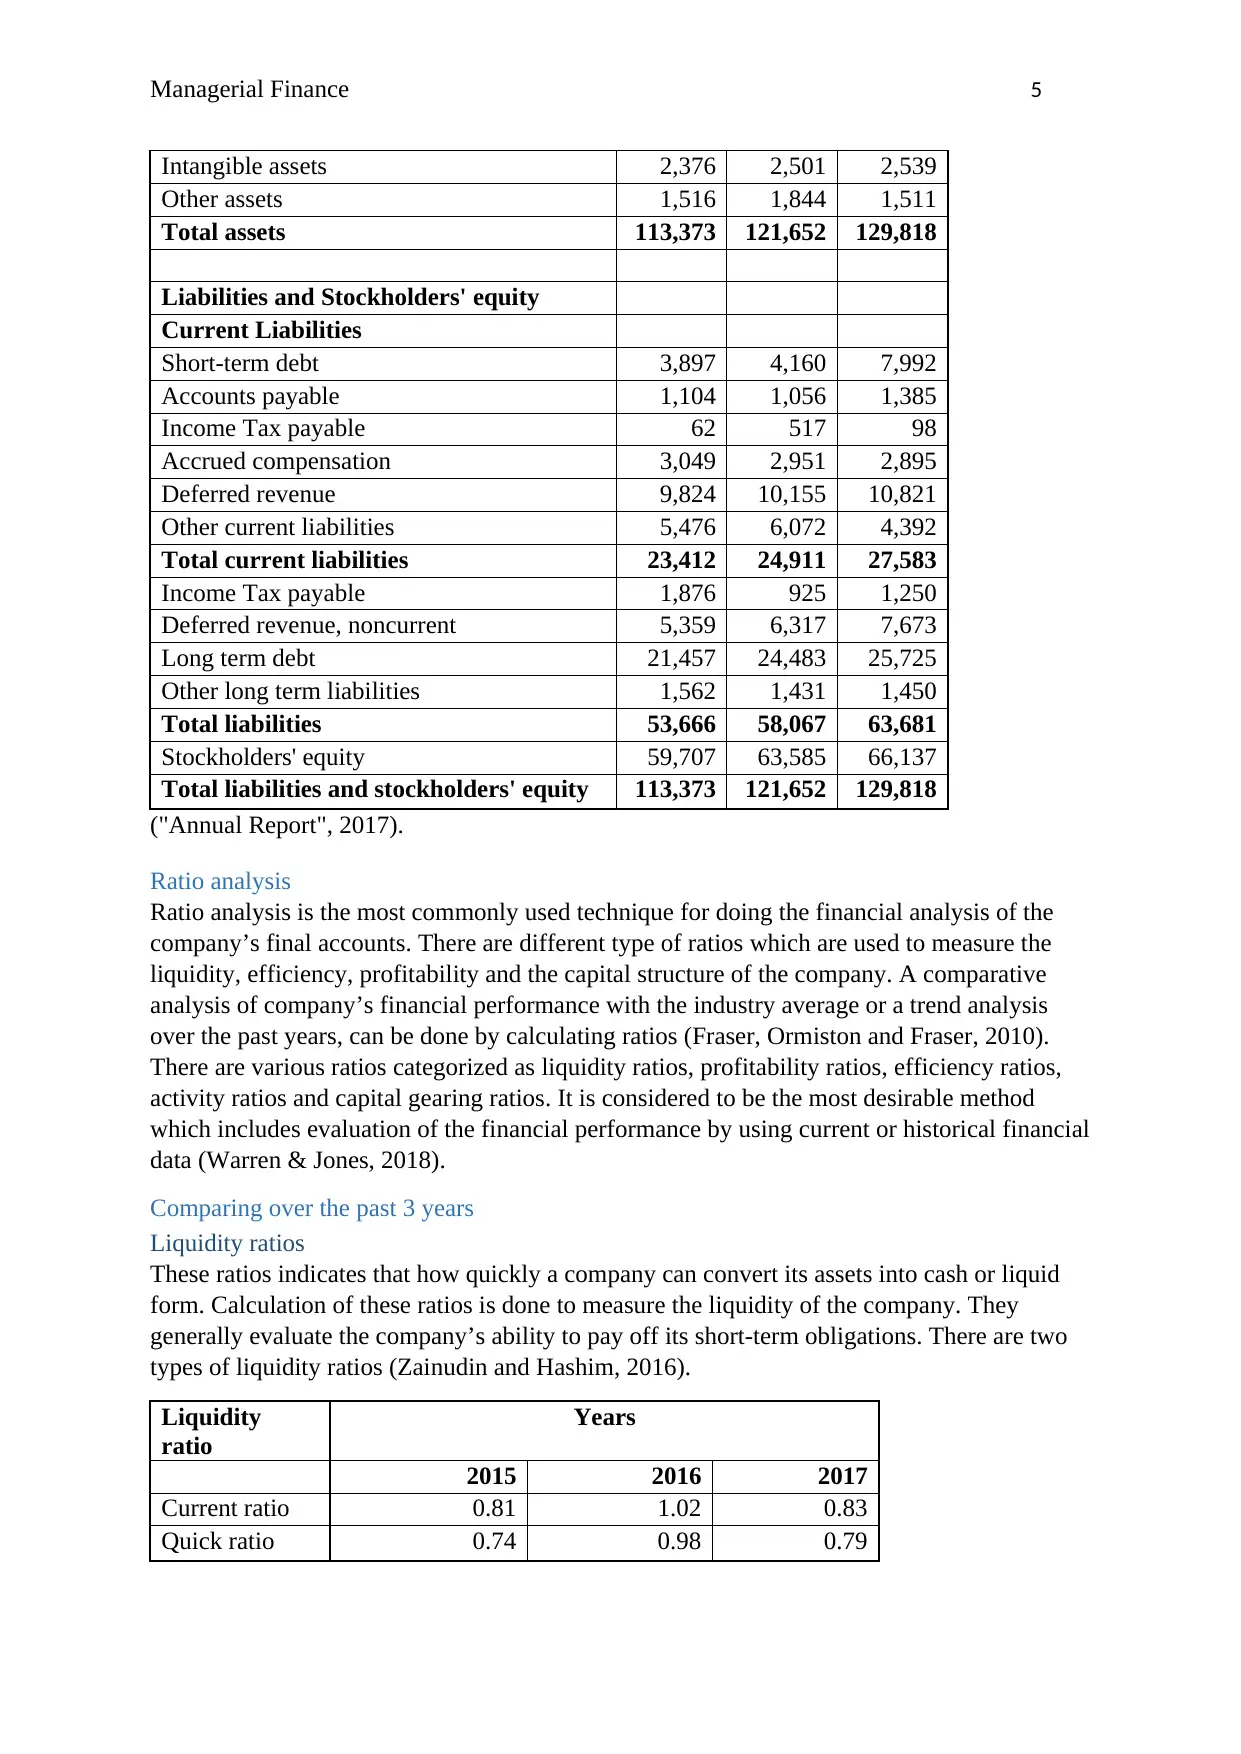
Intangible assets 2,376 2,501 2,539
Other assets 1,516 1,844 1,511
Total assets 113,373 121,652 129,818
Liabilities and Stockholders' equity
Current Liabilities
Short-term debt 3,897 4,160 7,992
Accounts payable 1,104 1,056 1,385
Income Tax payable 62 517 98
Accrued compensation 3,049 2,951 2,895
Deferred revenue 9,824 10,155 10,821
Other current liabilities 5,476 6,072 4,392
Total current liabilities 23,412 24,911 27,583
Income Tax payable 1,876 925 1,250
Deferred revenue, noncurrent 5,359 6,317 7,673
Long term debt 21,457 24,483 25,725
Other long term liabilities 1,562 1,431 1,450
Total liabilities 53,666 58,067 63,681
Stockholders' equity 59,707 63,585 66,137
Total liabilities and stockholders' equity 113,373 121,652 129,818
("Annual Report", 2017).
Ratio analysis
Ratio analysis is the most commonly used technique for doing the financial analysis of the
company’s final accounts. There are different type of ratios which are used to measure the
liquidity, efficiency, profitability and the capital structure of the company. A comparative
analysis of company’s financial performance with the industry average or a trend analysis
over the past years, can be done by calculating ratios (Fraser, Ormiston and Fraser, 2010).
There are various ratios categorized as liquidity ratios, profitability ratios, efficiency ratios,
activity ratios and capital gearing ratios. It is considered to be the most desirable method
which includes evaluation of the financial performance by using current or historical financial
data (Warren & Jones, 2018).
Comparing over the past 3 years
Liquidity ratios
These ratios indicates that how quickly a company can convert its assets into cash or liquid
form. Calculation of these ratios is done to measure the liquidity of the company. They
generally evaluate the company’s ability to pay off its short-term obligations. There are two
types of liquidity ratios (Zainudin and Hashim, 2016).
Liquidity
ratio
Years
2015 2016 2017
Current ratio 0.81 1.02 0.83
Quick ratio 0.74 0.98 0.79
Managerial Finance 6
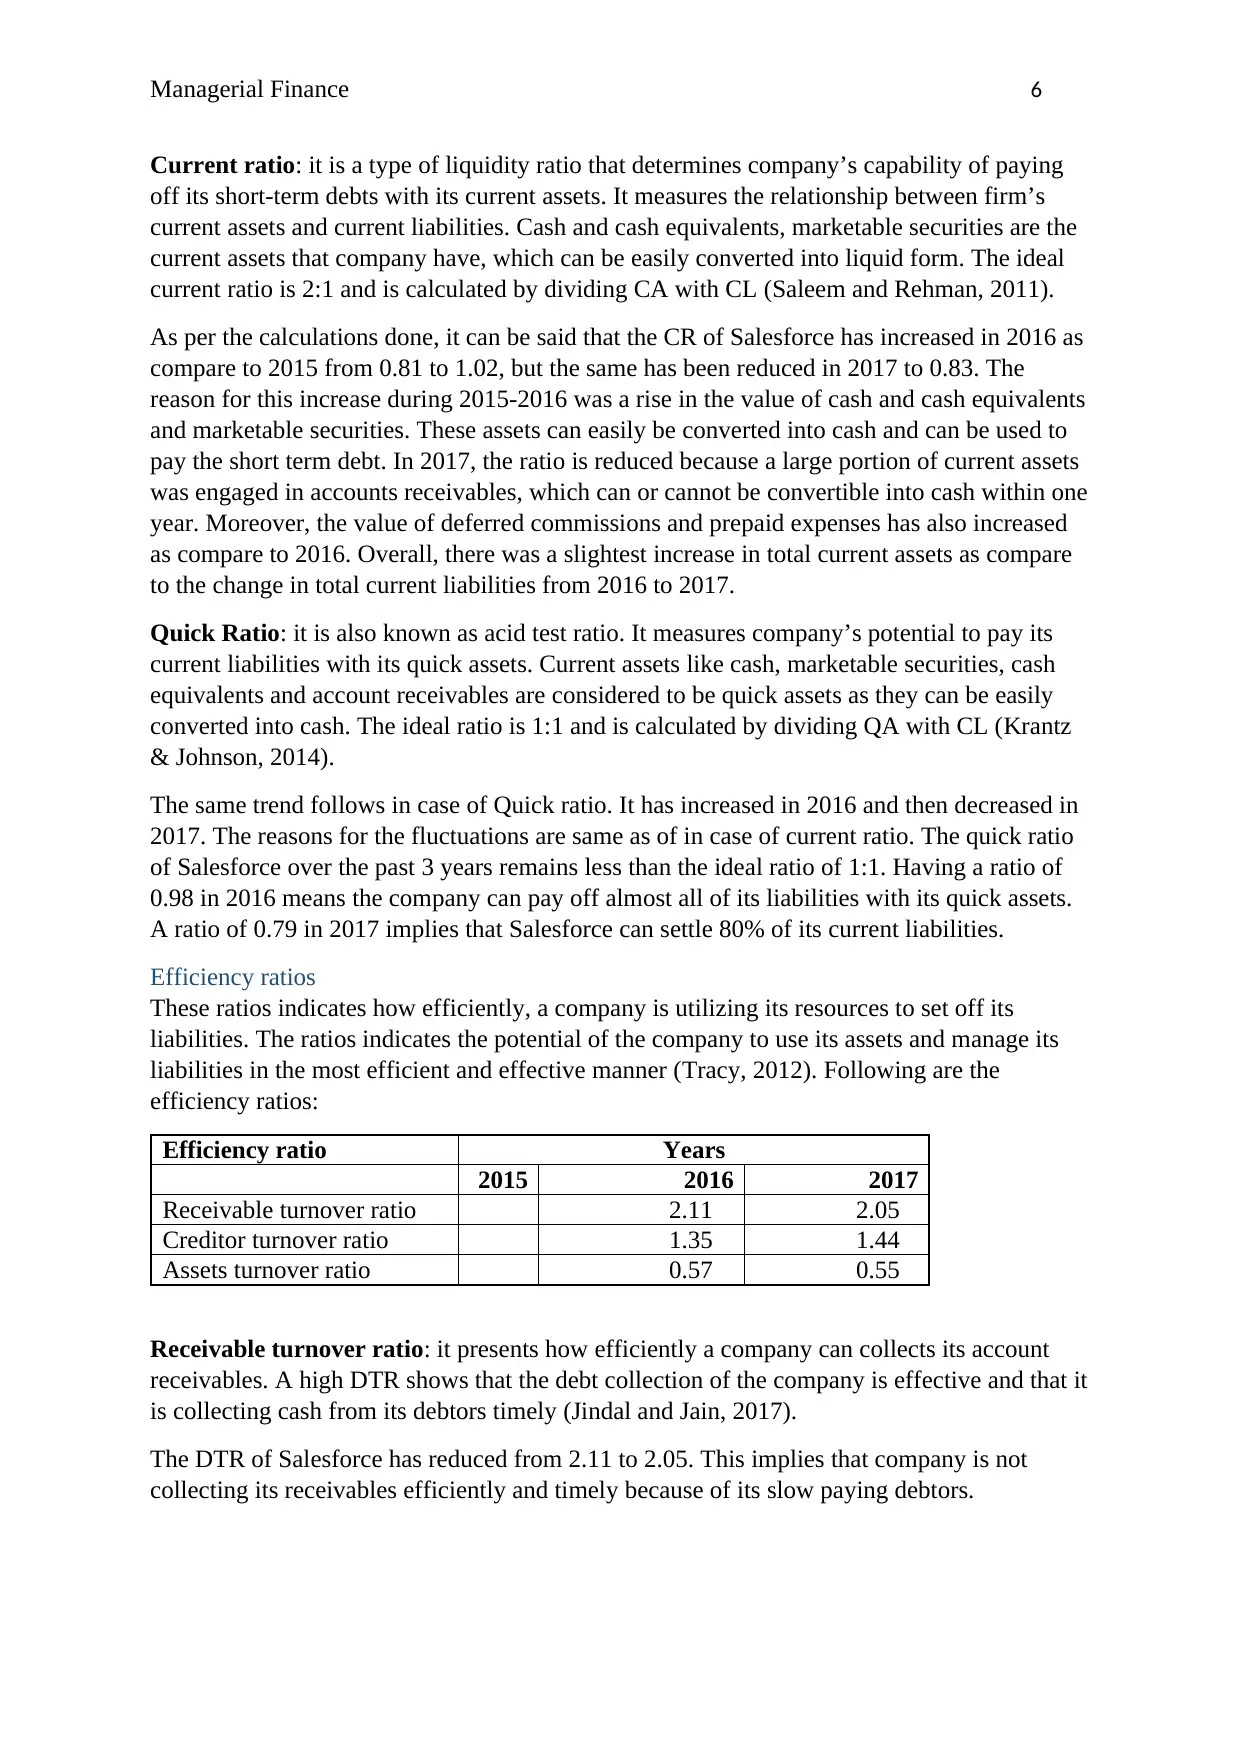
Current ratio: it is a type of liquidity ratio that determines company’s capability of paying
off its short-term debts with its current assets. It measures the relationship between firm’s
current assets and current liabilities. Cash and cash equivalents, marketable securities are the
current assets that company have, which can be easily converted into liquid form. The ideal
current ratio is 2:1 and is calculated by dividing CA with CL (Saleem and Rehman, 2011).
As per the calculations done, it can be said that the CR of Salesforce has increased in 2016 as
compare to 2015 from 0.81 to 1.02, but the same has been reduced in 2017 to 0.83. The
reason for this increase during 2015-2016 was a rise in the value of cash and cash equivalents
and marketable securities. These assets can easily be converted into cash and can be used to
pay the short term debt. In 2017, the ratio is reduced because a large portion of current assets
was engaged in accounts receivables, which can or cannot be convertible into cash within one
year. Moreover, the value of deferred commissions and prepaid expenses has also increased
as compare to 2016. Overall, there was a slightest increase in total current assets as compare
to the change in total current liabilities from 2016 to 2017.
Quick Ratio: it is also known as acid test ratio. It measures company’s potential to pay its
current liabilities with its quick assets. Current assets like cash, marketable securities, cash
equivalents and account receivables are considered to be quick assets as they can be easily
converted into cash. The ideal ratio is 1:1 and is calculated by dividing QA with CL (Krantz
& Johnson, 2014).
The same trend follows in case of Quick ratio. It has increased in 2016 and then decreased in
2017. The reasons for the fluctuations are same as of in case of current ratio. The quick ratio
of Salesforce over the past 3 years remains less than the ideal ratio of 1:1. Having a ratio of
0.98 in 2016 means the company can pay off almost all of its liabilities with its quick assets.
A ratio of 0.79 in 2017 implies that Salesforce can settle 80% of its current liabilities.
Efficiency ratios
These ratios indicates how efficiently, a company is utilizing its resources to set off its
liabilities. The ratios indicates the potential of the company to use its assets and manage its
liabilities in the most efficient and effective manner (Tracy, 2012). Following are the
efficiency ratios:
Efficiency ratio Years
2015 2016 2017
Receivable turnover ratio 2.11 2.05
Creditor turnover ratio 1.35 1.44
Assets turnover ratio 0.57 0.55
Receivable turnover ratio: it presents how efficiently a company can collects its account
receivables. A high DTR shows that the debt collection of the company is effective and that it
is collecting cash from its debtors timely (Jindal and Jain, 2017).
The DTR of Salesforce has reduced from 2.11 to 2.05. This implies that company is not
collecting its receivables efficiently and timely because of its slow paying debtors.
Paraphrase This Document
Need a fresh take? Get an instant paraphrase of this document with our AI Paraphraser
Managerial Finance 7
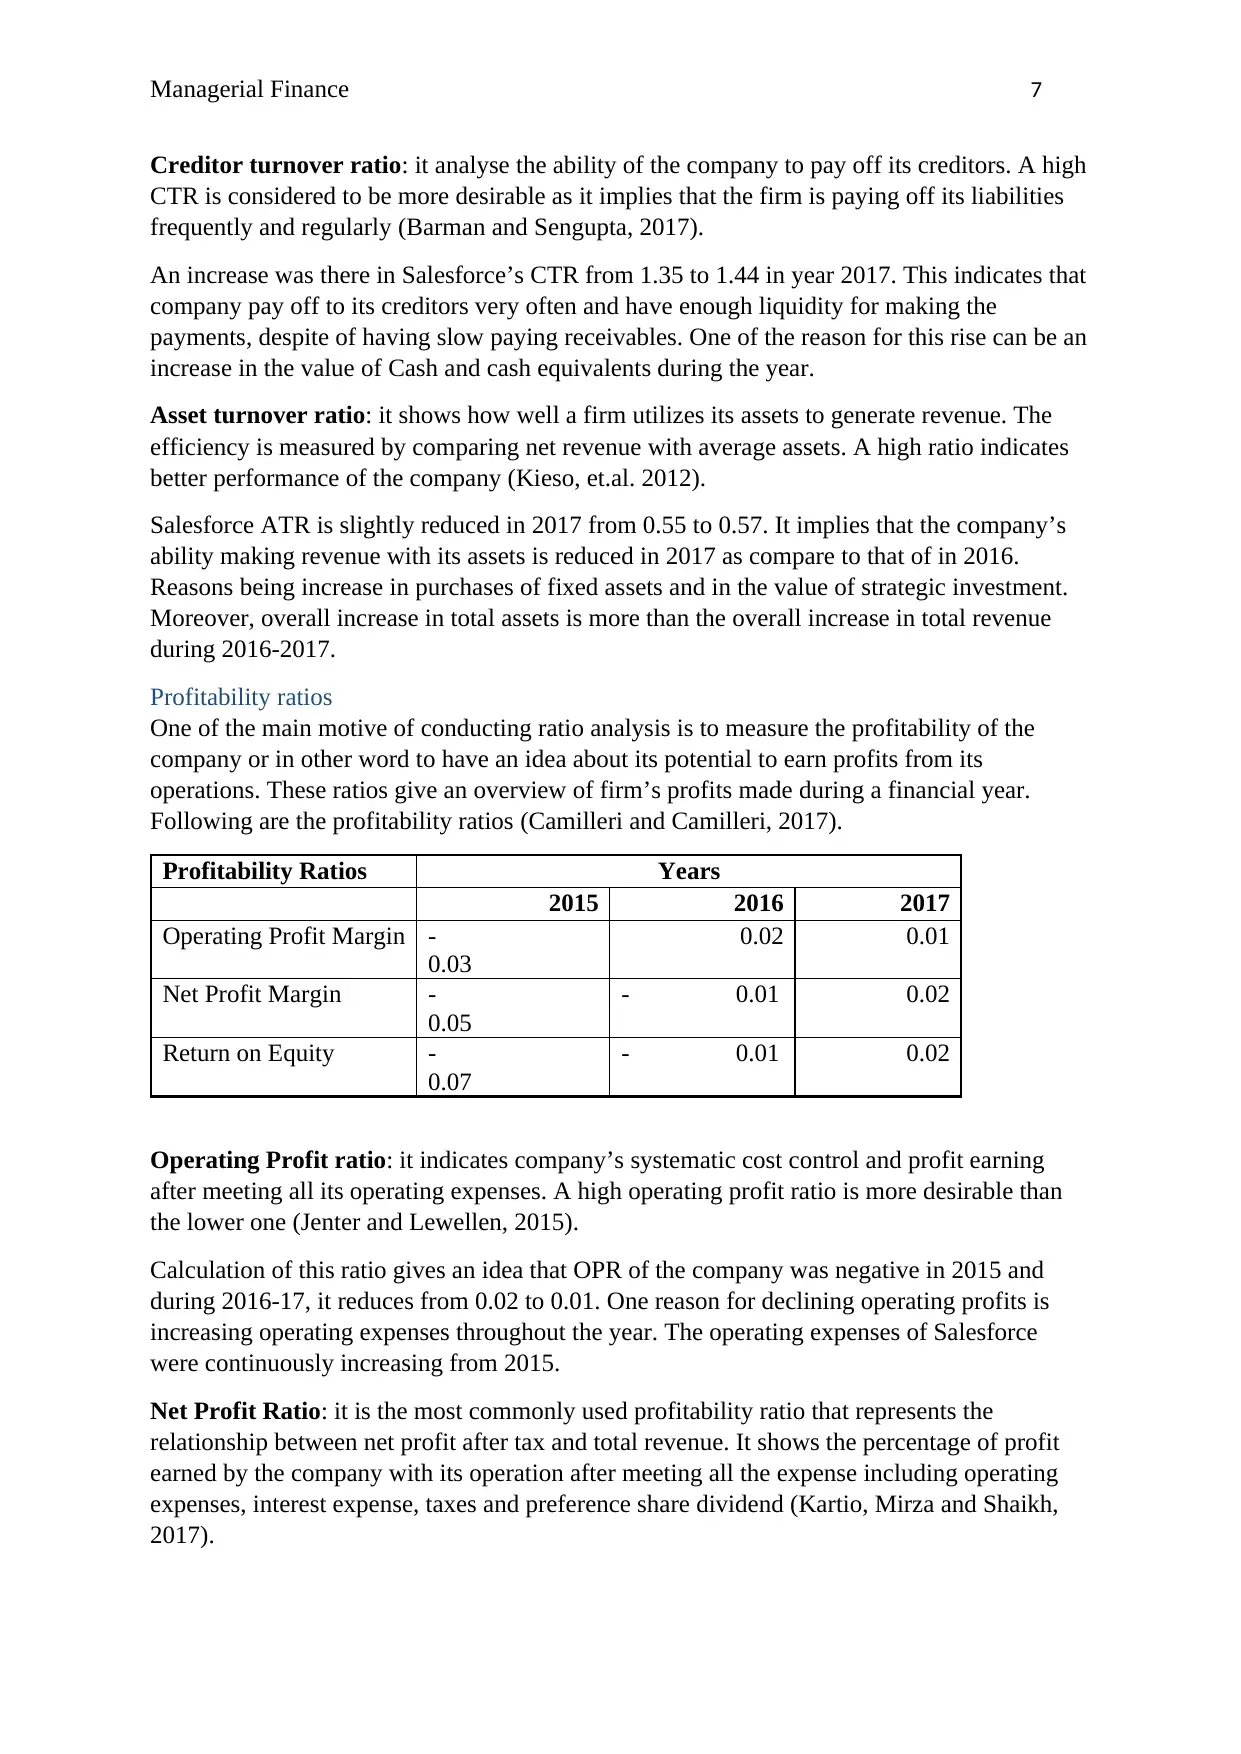
Creditor turnover ratio: it analyse the ability of the company to pay off its creditors. A high
CTR is considered to be more desirable as it implies that the firm is paying off its liabilities
frequently and regularly (Barman and Sengupta, 2017).
An increase was there in Salesforce’s CTR from 1.35 to 1.44 in year 2017. This indicates that
company pay off to its creditors very often and have enough liquidity for making the
payments, despite of having slow paying receivables. One of the reason for this rise can be an
increase in the value of Cash and cash equivalents during the year.
Asset turnover ratio: it shows how well a firm utilizes its assets to generate revenue. The
efficiency is measured by comparing net revenue with average assets. A high ratio indicates
better performance of the company (Kieso, et.al. 2012).
Salesforce ATR is slightly reduced in 2017 from 0.55 to 0.57. It implies that the company’s
ability making revenue with its assets is reduced in 2017 as compare to that of in 2016.
Reasons being increase in purchases of fixed assets and in the value of strategic investment.
Moreover, overall increase in total assets is more than the overall increase in total revenue
during 2016-2017.
Profitability ratios
One of the main motive of conducting ratio analysis is to measure the profitability of the
company or in other word to have an idea about its potential to earn profits from its
operations. These ratios give an overview of firm’s profits made during a financial year.
Following are the profitability ratios (Camilleri and Camilleri, 2017).
Profitability Ratios Years
2015 2016 2017
Operating Profit Margin -
0.03
0.02 0.01
Net Profit Margin -
0.05
- 0.01 0.02
Return on Equity -
0.07
- 0.01 0.02
Operating Profit ratio: it indicates company’s systematic cost control and profit earning
after meeting all its operating expenses. A high operating profit ratio is more desirable than
the lower one (Jenter and Lewellen, 2015).
Calculation of this ratio gives an idea that OPR of the company was negative in 2015 and
during 2016-17, it reduces from 0.02 to 0.01. One reason for declining operating profits is
increasing operating expenses throughout the year. The operating expenses of Salesforce
were continuously increasing from 2015.
Net Profit Ratio: it is the most commonly used profitability ratio that represents the
relationship between net profit after tax and total revenue. It shows the percentage of profit
earned by the company with its operation after meeting all the expense including operating
expenses, interest expense, taxes and preference share dividend (Kartio, Mirza and Shaikh,
2017).
Managerial Finance 8
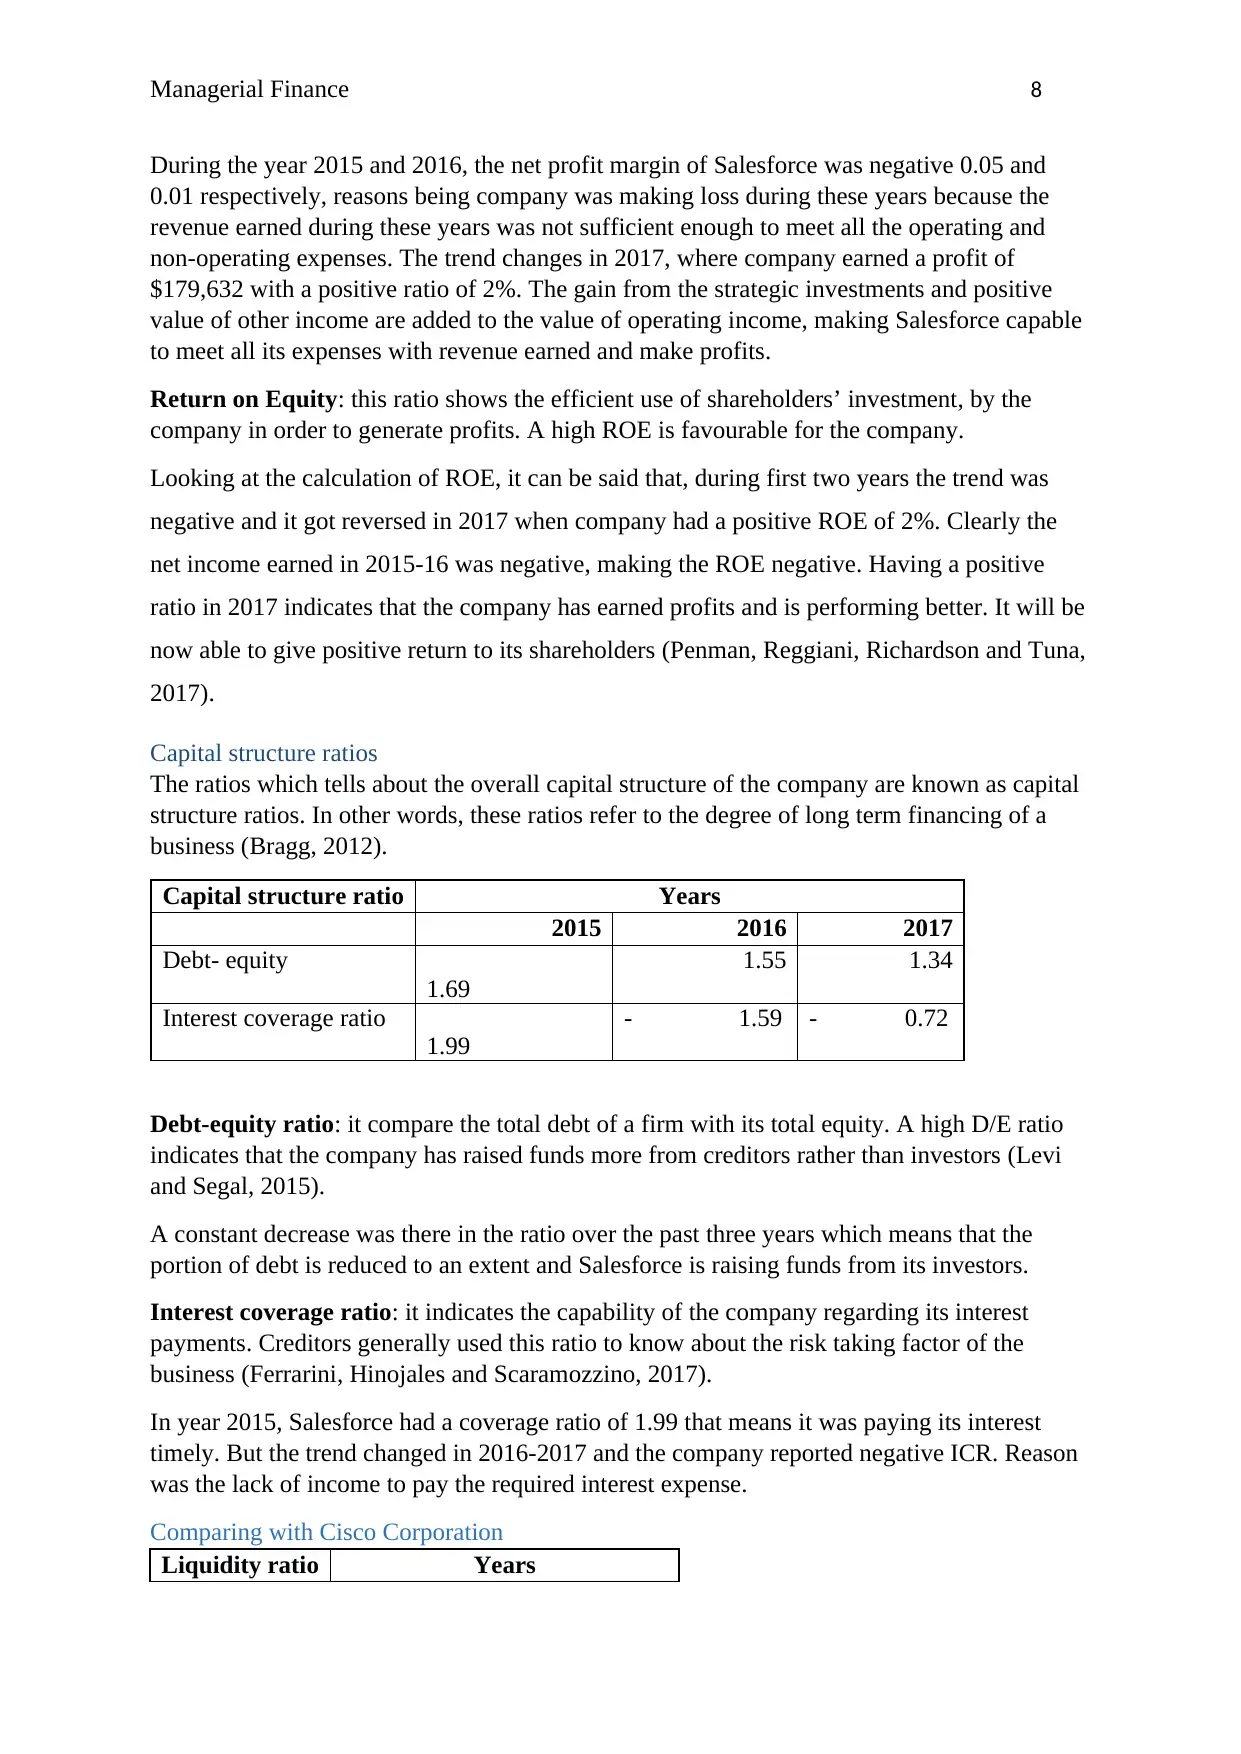
During the year 2015 and 2016, the net profit margin of Salesforce was negative 0.05 and
0.01 respectively, reasons being company was making loss during these years because the
revenue earned during these years was not sufficient enough to meet all the operating and
non-operating expenses. The trend changes in 2017, where company earned a profit of
$179,632 with a positive ratio of 2%. The gain from the strategic investments and positive
value of other income are added to the value of operating income, making Salesforce capable
to meet all its expenses with revenue earned and make profits.
Return on Equity: this ratio shows the efficient use of shareholders’ investment, by the
company in order to generate profits. A high ROE is favourable for the company.
Looking at the calculation of ROE, it can be said that, during first two years the trend was
negative and it got reversed in 2017 when company had a positive ROE of 2%. Clearly the
net income earned in 2015-16 was negative, making the ROE negative. Having a positive
ratio in 2017 indicates that the company has earned profits and is performing better. It will be
now able to give positive return to its shareholders (Penman, Reggiani, Richardson and Tuna,
2017).
Capital structure ratios
The ratios which tells about the overall capital structure of the company are known as capital
structure ratios. In other words, these ratios refer to the degree of long term financing of a
business (Bragg, 2012).
Capital structure ratio Years
2015 2016 2017
Debt- equity
1.69
1.55 1.34
Interest coverage ratio
1.99
- 1.59 - 0.72
Debt-equity ratio: it compare the total debt of a firm with its total equity. A high D/E ratio
indicates that the company has raised funds more from creditors rather than investors (Levi
and Segal, 2015).
A constant decrease was there in the ratio over the past three years which means that the
portion of debt is reduced to an extent and Salesforce is raising funds from its investors.
Interest coverage ratio: it indicates the capability of the company regarding its interest
payments. Creditors generally used this ratio to know about the risk taking factor of the
business (Ferrarini, Hinojales and Scaramozzino, 2017).
In year 2015, Salesforce had a coverage ratio of 1.99 that means it was paying its interest
timely. But the trend changed in 2016-2017 and the company reported negative ICR. Reason
was the lack of income to pay the required interest expense.
Comparing with Cisco Corporation
Liquidity ratio Years
Managerial Finance 9
2015 2016 2017
Current ratio 3.13 3.16 3.03
Quick ratio 3.06 3.11 2.98
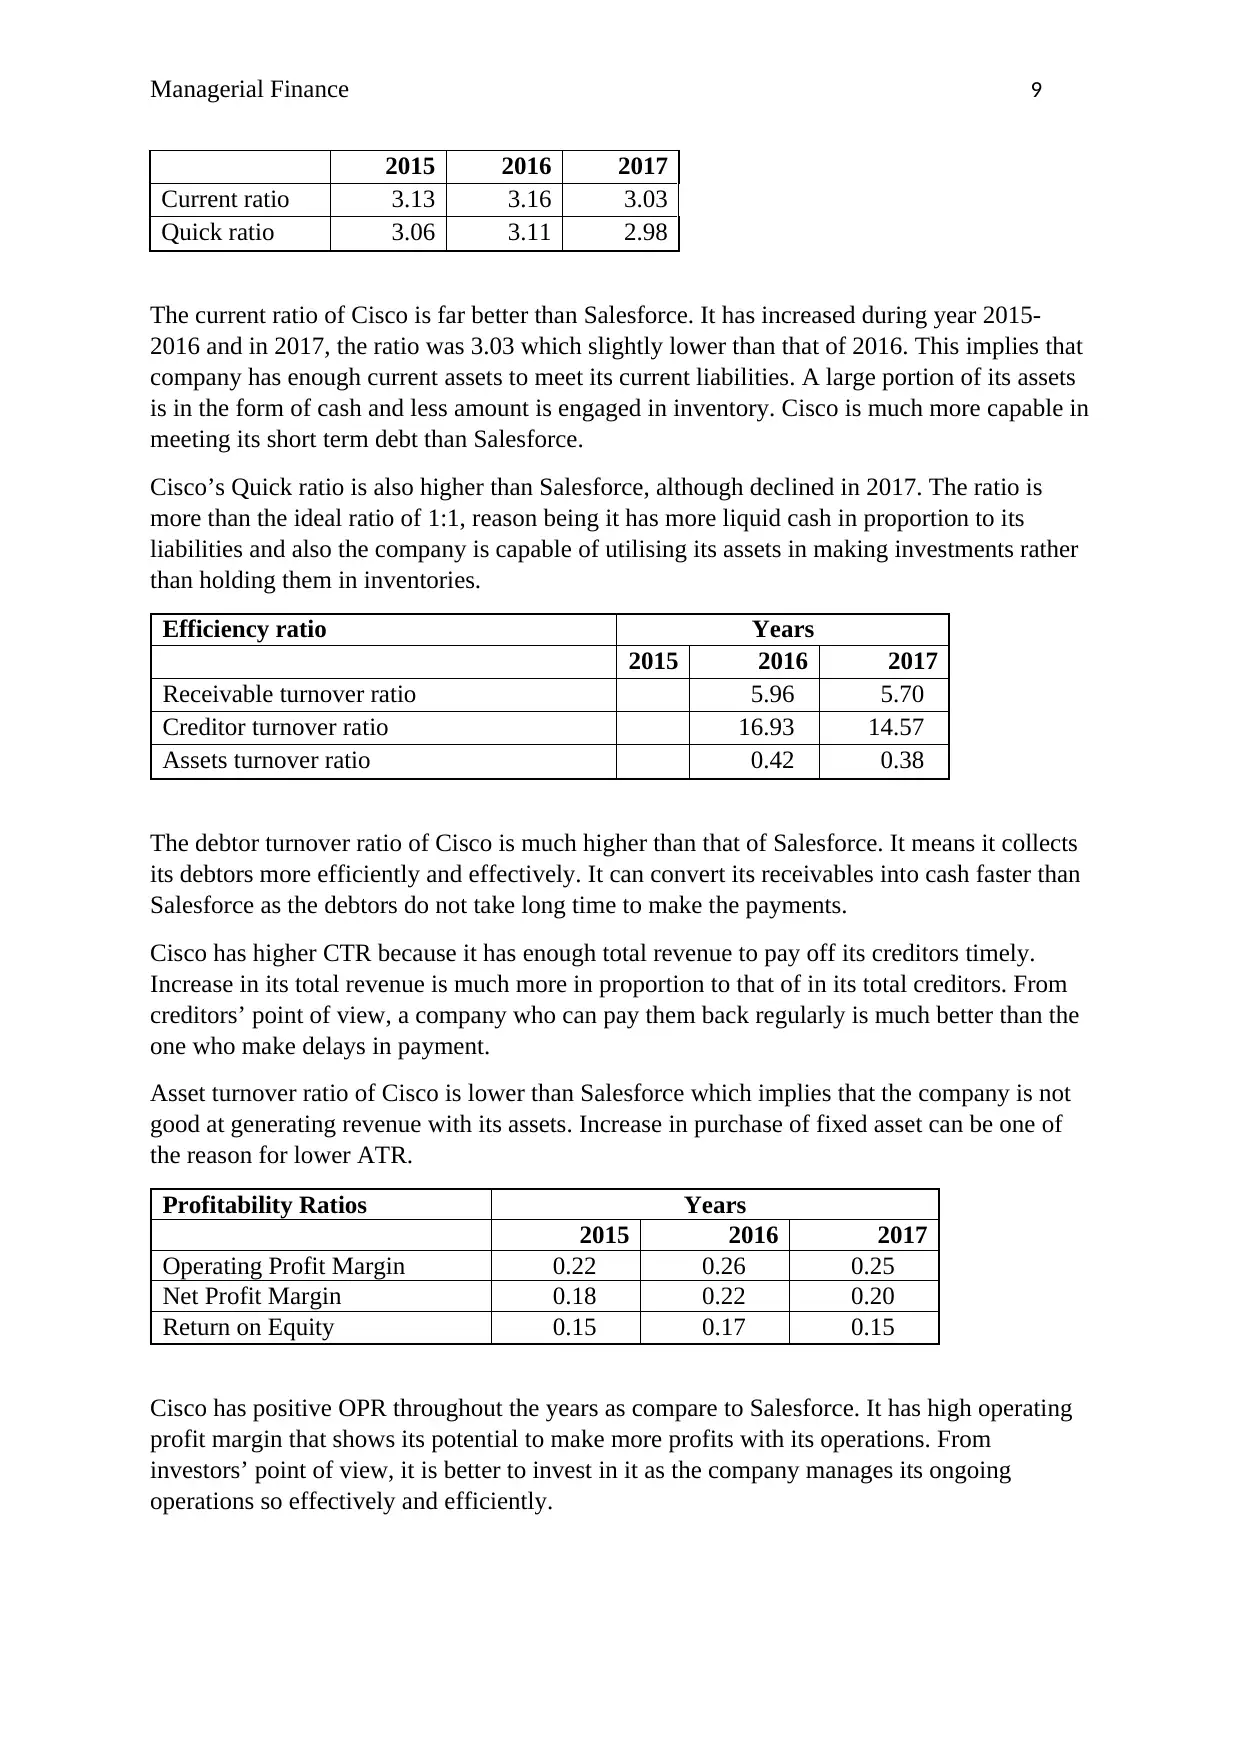
The current ratio of Cisco is far better than Salesforce. It has increased during year 2015-
2016 and in 2017, the ratio was 3.03 which slightly lower than that of 2016. This implies that
company has enough current assets to meet its current liabilities. A large portion of its assets
is in the form of cash and less amount is engaged in inventory. Cisco is much more capable in
meeting its short term debt than Salesforce.
Cisco’s Quick ratio is also higher than Salesforce, although declined in 2017. The ratio is
more than the ideal ratio of 1:1, reason being it has more liquid cash in proportion to its
liabilities and also the company is capable of utilising its assets in making investments rather
than holding them in inventories.
Efficiency ratio Years
2015 2016 2017
Receivable turnover ratio 5.96 5.70
Creditor turnover ratio 16.93 14.57
Assets turnover ratio 0.42 0.38
The debtor turnover ratio of Cisco is much higher than that of Salesforce. It means it collects
its debtors more efficiently and effectively. It can convert its receivables into cash faster than
Salesforce as the debtors do not take long time to make the payments.
Cisco has higher CTR because it has enough total revenue to pay off its creditors timely.
Increase in its total revenue is much more in proportion to that of in its total creditors. From
creditors’ point of view, a company who can pay them back regularly is much better than the
one who make delays in payment.
Asset turnover ratio of Cisco is lower than Salesforce which implies that the company is not
good at generating revenue with its assets. Increase in purchase of fixed asset can be one of
the reason for lower ATR.
Profitability Ratios Years
2015 2016 2017
Operating Profit Margin 0.22 0.26 0.25
Net Profit Margin 0.18 0.22 0.20
Return on Equity 0.15 0.17 0.15
Cisco has positive OPR throughout the years as compare to Salesforce. It has high operating
profit margin that shows its potential to make more profits with its operations. From
investors’ point of view, it is better to invest in it as the company manages its ongoing
operations so effectively and efficiently.
2015 2016 2017
Current ratio 3.13 3.16 3.03
Quick ratio 3.06 3.11 2.98
The current ratio of Cisco is far better than Salesforce. It has increased during year 2015-
2016 and in 2017, the ratio was 3.03 which slightly lower than that of 2016. This implies that
company has enough current assets to meet its current liabilities. A large portion of its assets
is in the form of cash and less amount is engaged in inventory. Cisco is much more capable in
meeting its short term debt than Salesforce.
Cisco’s Quick ratio is also higher than Salesforce, although declined in 2017. The ratio is
more than the ideal ratio of 1:1, reason being it has more liquid cash in proportion to its
liabilities and also the company is capable of utilising its assets in making investments rather
than holding them in inventories.
Efficiency ratio Years
2015 2016 2017
Receivable turnover ratio 5.96 5.70
Creditor turnover ratio 16.93 14.57
Assets turnover ratio 0.42 0.38
The debtor turnover ratio of Cisco is much higher than that of Salesforce. It means it collects
its debtors more efficiently and effectively. It can convert its receivables into cash faster than
Salesforce as the debtors do not take long time to make the payments.
Cisco has higher CTR because it has enough total revenue to pay off its creditors timely.
Increase in its total revenue is much more in proportion to that of in its total creditors. From
creditors’ point of view, a company who can pay them back regularly is much better than the
one who make delays in payment.
Asset turnover ratio of Cisco is lower than Salesforce which implies that the company is not
good at generating revenue with its assets. Increase in purchase of fixed asset can be one of
the reason for lower ATR.
Profitability Ratios Years
2015 2016 2017
Operating Profit Margin 0.22 0.26 0.25
Net Profit Margin 0.18 0.22 0.20
Return on Equity 0.15 0.17 0.15
Cisco has positive OPR throughout the years as compare to Salesforce. It has high operating
profit margin that shows its potential to make more profits with its operations. From
investors’ point of view, it is better to invest in it as the company manages its ongoing
operations so effectively and efficiently.
Secure Best Marks with AI Grader
Need help grading? Try our AI Grader for instant feedback on your assignments.
Managerial Finance 10
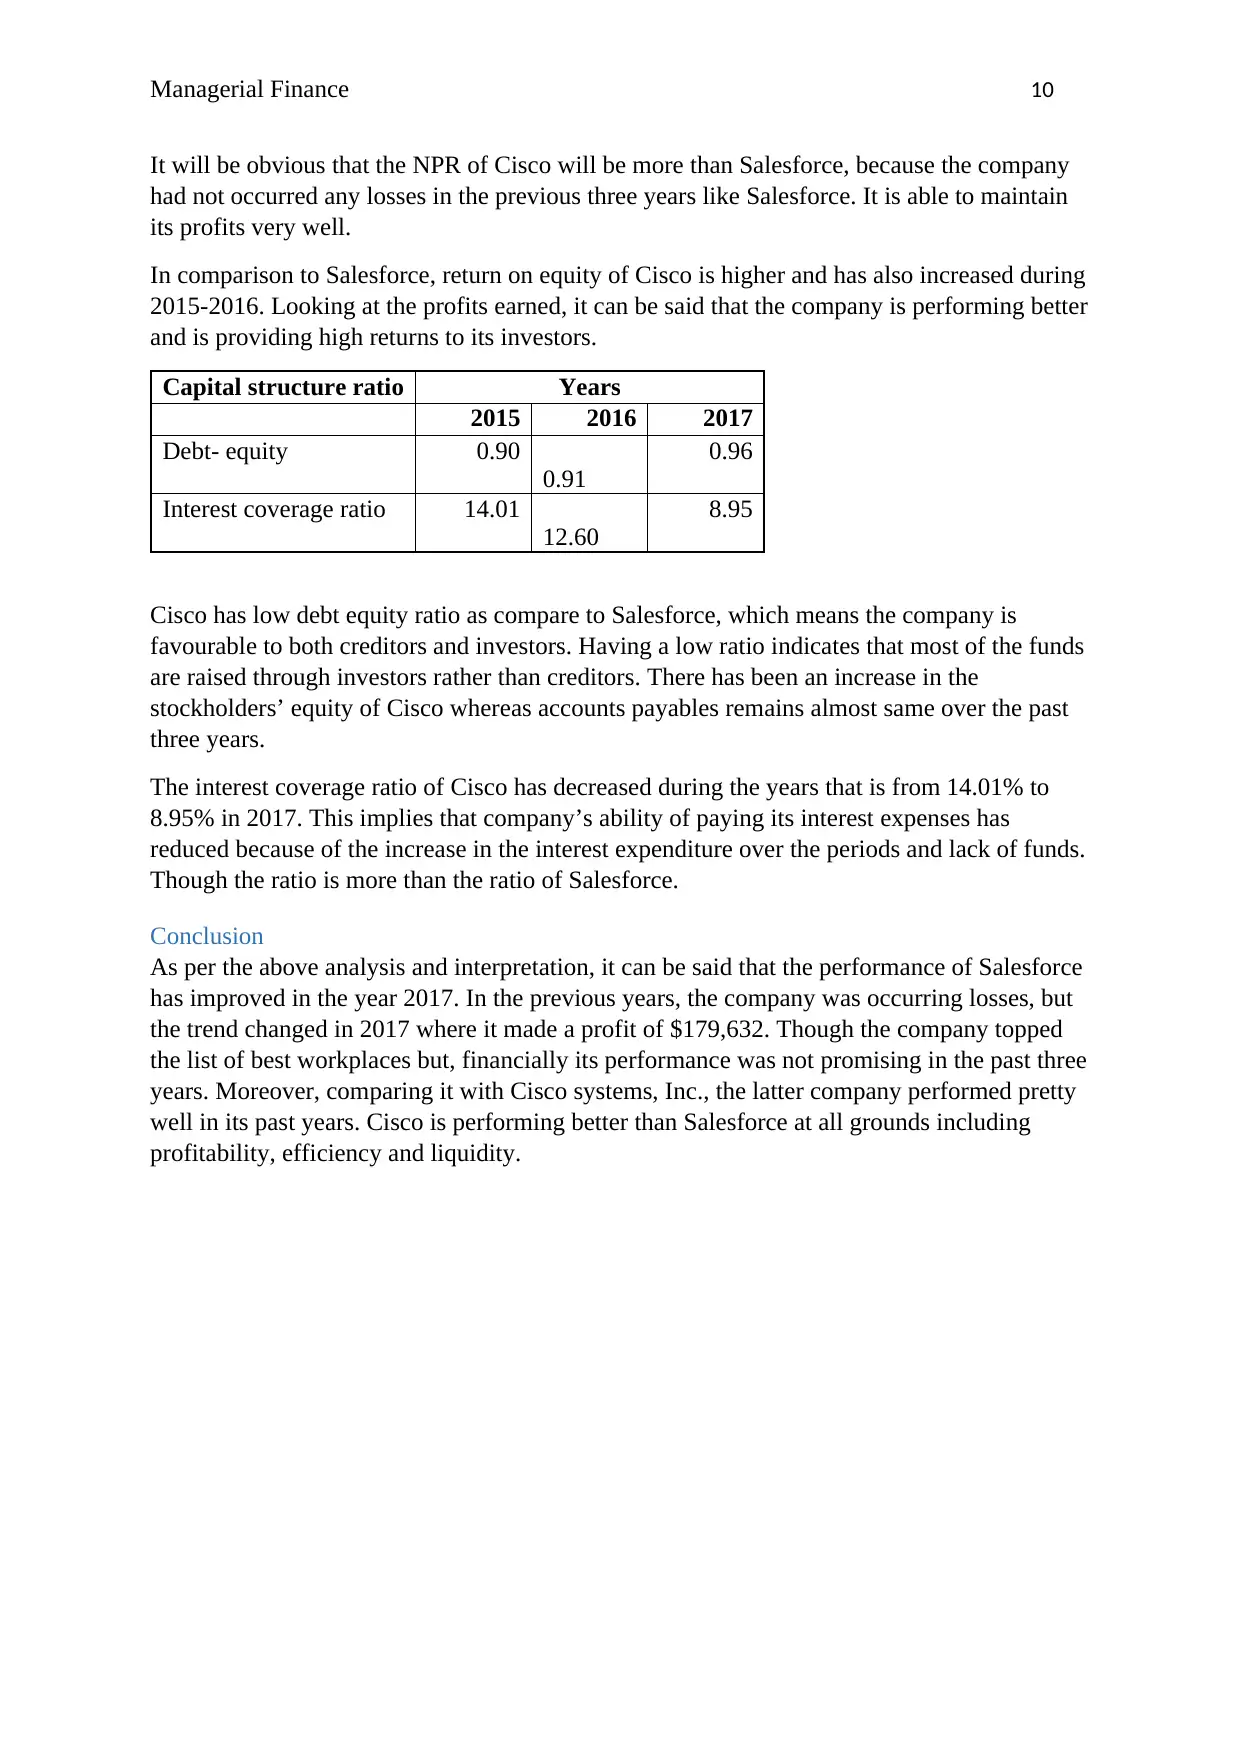
It will be obvious that the NPR of Cisco will be more than Salesforce, because the company
had not occurred any losses in the previous three years like Salesforce. It is able to maintain
its profits very well.
In comparison to Salesforce, return on equity of Cisco is higher and has also increased during
2015-2016. Looking at the profits earned, it can be said that the company is performing better
and is providing high returns to its investors.
Capital structure ratio Years
2015 2016 2017
Debt- equity 0.90
0.91
0.96
Interest coverage ratio 14.01
12.60
8.95
Cisco has low debt equity ratio as compare to Salesforce, which means the company is
favourable to both creditors and investors. Having a low ratio indicates that most of the funds
are raised through investors rather than creditors. There has been an increase in the
stockholders’ equity of Cisco whereas accounts payables remains almost same over the past
three years.
The interest coverage ratio of Cisco has decreased during the years that is from 14.01% to
8.95% in 2017. This implies that company’s ability of paying its interest expenses has
reduced because of the increase in the interest expenditure over the periods and lack of funds.
Though the ratio is more than the ratio of Salesforce.
Conclusion
As per the above analysis and interpretation, it can be said that the performance of Salesforce
has improved in the year 2017. In the previous years, the company was occurring losses, but
the trend changed in 2017 where it made a profit of $179,632. Though the company topped
the list of best workplaces but, financially its performance was not promising in the past three
years. Moreover, comparing it with Cisco systems, Inc., the latter company performed pretty
well in its past years. Cisco is performing better than Salesforce at all grounds including
profitability, efficiency and liquidity.
Managerial Finance 11
References
Annual Report. (2017). Cisco.com. Retrieved 17 January 2018, from
https://www.cisco.com/c/dam/en_us/about/annual-report/2017-annual-report-full.PDF
Barman, A.N. and Sengupta, P.P. (2017). DETERMINANTS OF PROFITABILITY IN
INDIAN TELECOM INDUSTRY USING FINANCIAL RATIO
ANALYSIS. International Journal of Research in Management & Social Science,
p.25.
Bragg, S. M. (2012). Business ratios and formulas: a comprehensive guide (Vol. 577). John
Wiley & Sons.
Camilleri, E. and Camilleri, R. (2017). Accounting for Financial Instruments: A Guide to
Valuation and Risk Management. Taylor & Francis.
Cisco - Global Home Page. (2018). Cisco. Retrieved 17 January 2018, from
https://www.cisco.com/
Ferrarini, B., Hinojales, M. and Scaramozzino, P. (2017). Leverage and Capital Structure
Determinants of Chinese Listed Companies.
Fraser, L.M., Ormiston, A. and Fraser, L.M. (2010). Understanding financial statements.
Pearson.
Higgins, R. C. (2012). Analysis for financial management. McGraw-Hill/Irwin.
Jenter, D. and Lewellen, K. (2015). CEO preferences and acquisitions. The Journal of
Finance, 70(6), pp.2813-2852.
Jindal, D. And Jain, S., 2017. Effect of Receivables Management on Profitability: A Study of
Commercial Vehicle Industry in India. Management, 2(2), pp.246-255.
Kartio, M.A., Mirza, A. and Shaikh, F. (2017). Impact of Global Financial Crisis on the
Performance of Commercial Banks of Pakistan–A Case Study of MCB Bank Limited.
Managerial Finance 12
Kieso, D. W., Weygandt, J. J., Kieso, D. E., & Kimmel, P. D. (2012). Study Guide to
Accompany Financial Accounting, 8e. John Wiley & Sons.
Krantz, M., & Johnson, R. R. (2014). Investment Banking for Dummies. John Wiley & Sons.
Lee, A. C., Lee, J. C., & Lee, C. F. (2009). Financial analysis, planning and forecasting:
Theory and application. World Scientific Publishing Co Inc.
Levi, S. and Segal, B. (2015). The Impact of Debt-Equity Reporting Classifications on the
Firm's Decision to Issue Hybrid Securities. European Accounting Review, 24(4),
pp.801-822.
Penman, S.H., Reggiani, F., Richardson, S.A. and Tuna, A. (2017). A Framework for
Identifying Accounting Characteristics for Asset Pricing Models, with an Evaluation
of Book-To-Price.
Saleem, Q. and Rehman, R.U. (2011). Impacts of liquidity ratios on
profitability. Interdisciplinary Journal of Research in Business, 1(7), pp.95-98.
Salesforce. (2018). Salesforce.com. Retrieved 17 January 2018, from
https://www.salesforce.com/in/?ir=1
Tracy, A. (2012). Ratio analysis fundamentals: how 17 financial ratios can allow you to
analyse any business on the planet. RatioAnalysis. Net.
Vogel, H.L. (2014). Entertainment industry economics: A guide for financial analysis.
Cambridge University Press.
Warren, C. S., & Jones, J. (2018). Corporate financial accounting. Cengage Learning.
Zainudin, E.F., Zainudin, E.F., Hashim, H.A. and Hashim, H.A. (2016). Detecting fraudulent
financial reporting using financial ratio. Journal of Financial Reporting and
Accounting, 14(2), pp.266-278.
1 out of 13
Related Documents

Your All-in-One AI-Powered Toolkit for Academic Success.
+13062052269
info@desklib.com
Available 24*7 on WhatsApp / Email
![[object Object]](/_next/static/media/star-bottom.7253800d.svg)
Unlock your academic potential
© 2024 | Zucol Services PVT LTD | All rights reserved.