Managerial Finance Report: Ratio Analysis and Capital Budgeting
VerifiedAdded on 2022/12/30

FINANCE
Paraphrase This Document
INTRODUCTION...........................................................................................................................3
PORTFOLIO 1.................................................................................................................................3
A Calculation related with financial ratio...................................................................................3
B. Explanation of assessment of financial performance of Tesco & Sainsbury.........................5
C Explanation of main cause of poor performance of organization...........................................8
D. Limitation of financial ratio technique for measures performance of organization...............8
PORTFOLIO 2.................................................................................................................................9
A. Use of various types of investment appraisal technique for investment decision..................9
B. Limitation of capital budgeting techniques..........................................................................11
CONCLUSION..............................................................................................................................12
REFERENCES..............................................................................................................................12
.......................................................................................................................................................12
Managerial finance is define as essential branch of finance which help in create value of
organizations performance and its agility. To understand this concept this report has been
formulate. It divided into two parts. The first part is related with the relevance of ratio analysis as
essential tool of managerial finance. This define how manager use ratio to measure or compare
performance of Tesco & Sainsbury. It also define he limitations of this tool. In another portfolio
the relevance of managerial finance technique for determine or take decision has been mention
specifically. This report define how technique of capital budgeting calculated and their use for
take decision and limitation of theses techniques. All these information are define in systematic
manner.
PORTFOLIO 1
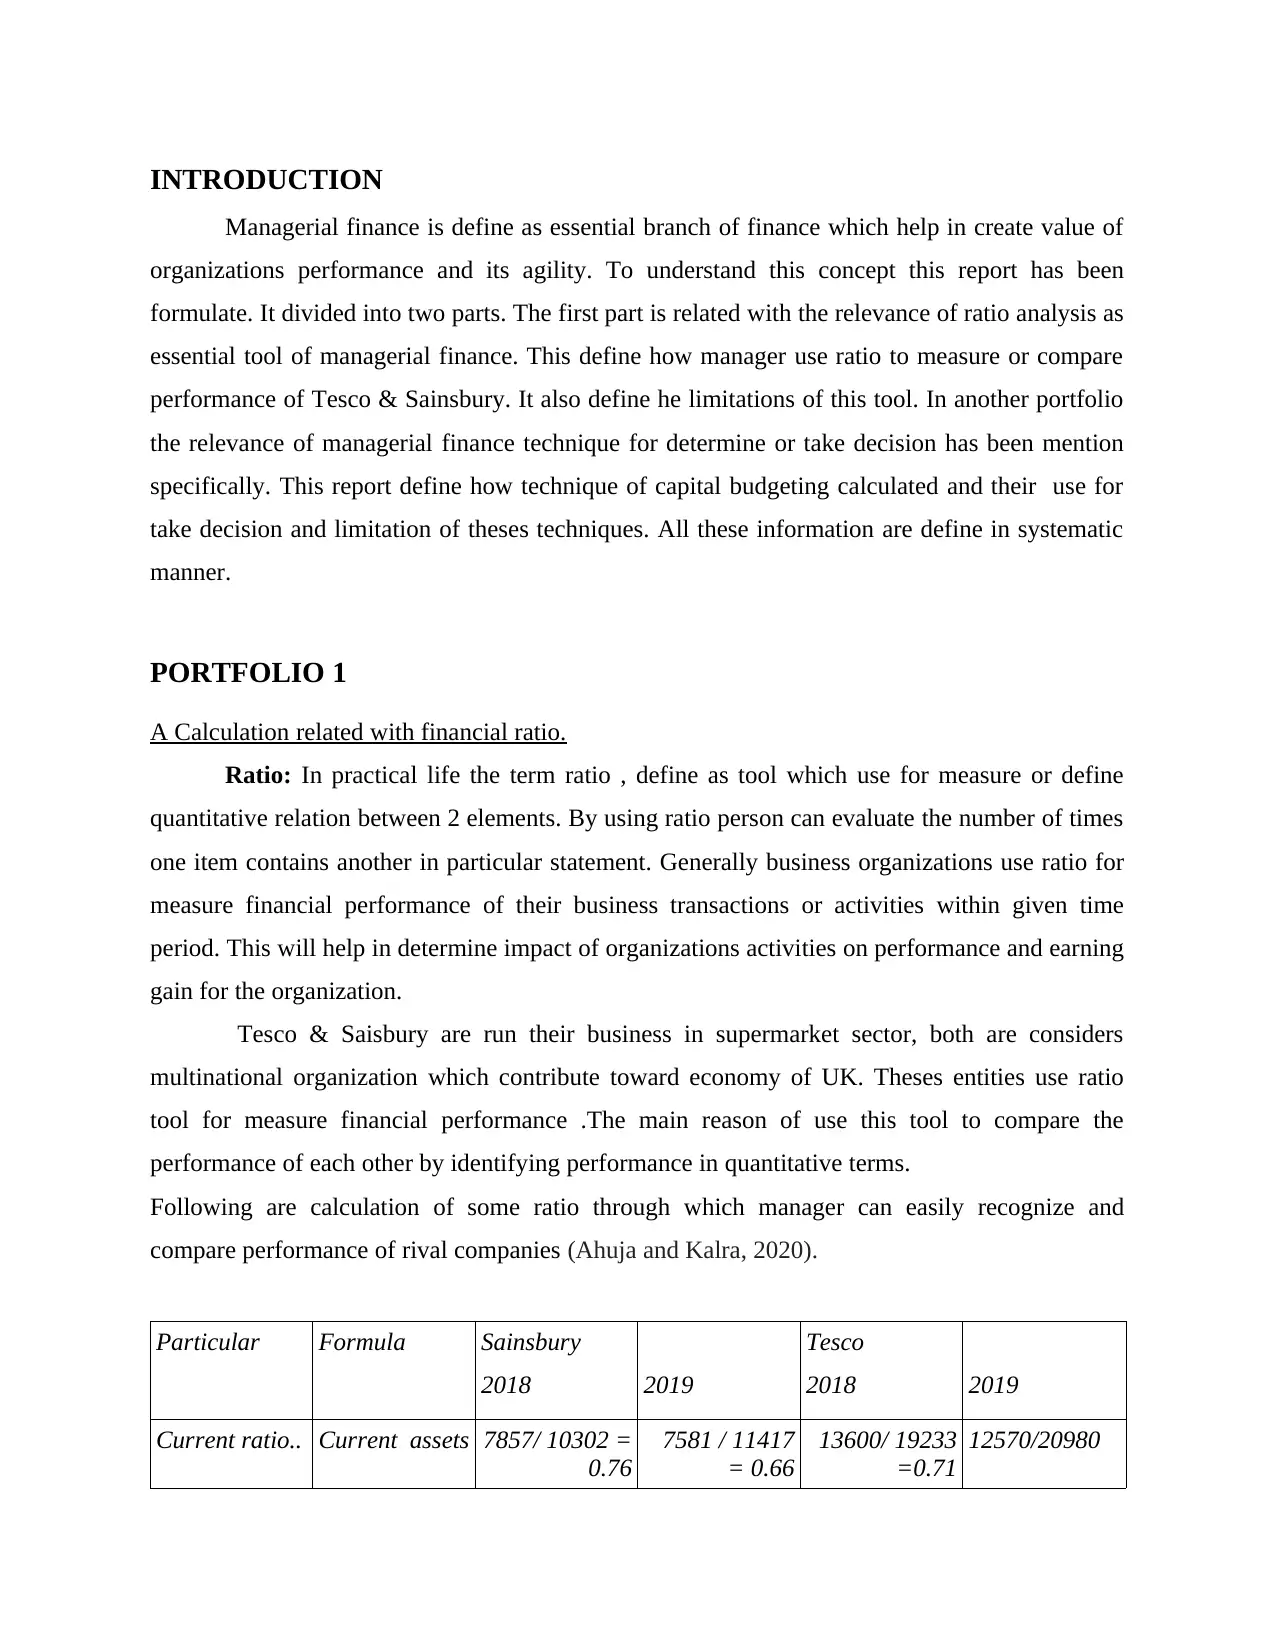
A Calculation related with financial ratio.
Ratio: In practical life the term ratio , define as tool which use for measure or define
quantitative relation between 2 elements. By using ratio person can evaluate the number of times
one item contains another in particular statement. Generally business organizations use ratio for
measure financial performance of their business transactions or activities within given time
period. This will help in determine impact of organizations activities on performance and earning
gain for the organization.
Tesco & Saisbury are run their business in supermarket sector, both are considers
multinational organization which contribute toward economy of UK. Theses entities use ratio
tool for measure financial performance .The main reason of use this tool to compare the
performance of each other by identifying performance in quantitative terms.
Following are calculation of some ratio through which manager can easily recognize and
compare performance of rival companies (Ahuja and Kalra, 2020).
Particular Formula Sainsbury
2018 2019
Tesco
2018 2019
Current ratio.. Current assets 7857/ 10302 =
0.76
7581 / 11417
= 0.66
13600/ 19233
=0.71
12570/20980
⊘ This is a preview!⊘
Do you want full access?
Subscribe today to unlock all pages.
Trusted by 1+ million students worldwide
liabilities......
=0.61
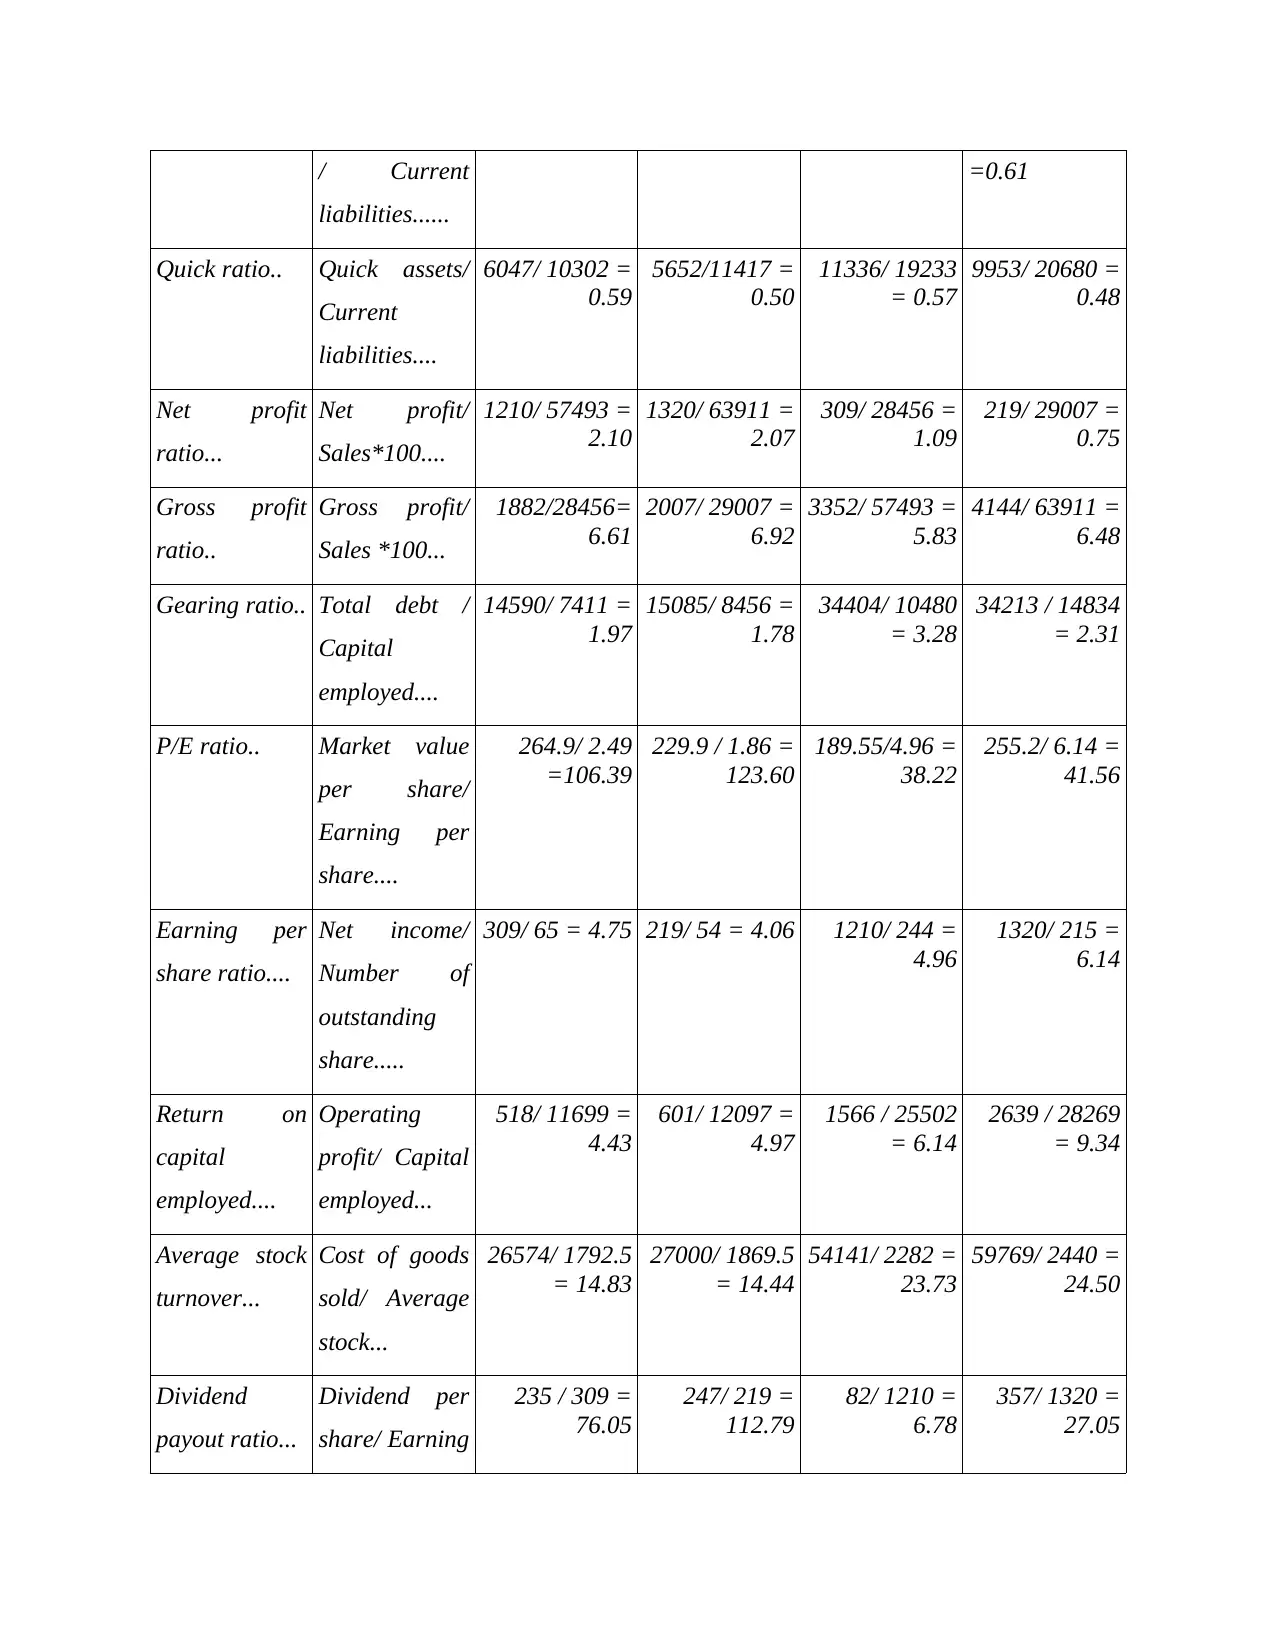
Quick ratio.. Quick assets/
Current
liabilities....
6047/ 10302 =
0.59
5652/11417 =
0.50
11336/ 19233
= 0.57
9953/ 20680 =
0.48
Net profit
ratio...
Net profit/
Sales*100....
1210/ 57493 =
2.10
1320/ 63911 =
2.07
309/ 28456 =
1.09
219/ 29007 =
0.75
Gross profit
ratio..
Gross profit/
Sales *100...
1882/28456=
6.61
2007/ 29007 =
6.92
3352/ 57493 =
5.83
4144/ 63911 =
6.48
Gearing ratio.. Total debt /
Capital
employed....
14590/ 7411 =
1.97
15085/ 8456 =
1.78
34404/ 10480
= 3.28
34213 / 14834
= 2.31
P/E ratio.. Market value
per share/
Earning per
share....
264.9/ 2.49
=106.39
229.9 / 1.86 =
123.60
189.55/4.96 =
38.22
255.2/ 6.14 =
41.56
Earning per
share ratio....
Net income/
Number of
outstanding
share.....
309/ 65 = 4.75 219/ 54 = 4.06 1210/ 244 =
4.96
1320/ 215 =
6.14
Return on
capital
employed....
Operating
profit/ Capital
employed...
518/ 11699 =
4.43
601/ 12097 =
4.97
1566 / 25502
= 6.14
2639 / 28269
= 9.34
Average stock
turnover...
Cost of goods
sold/ Average
stock...
26574/ 1792.5
= 14.83
27000/ 1869.5
= 14.44
54141/ 2282 =
23.73
59769/ 2440 =
24.50
Dividend
payout ratio...
Dividend per
share/ Earning
235 / 309 =
76.05
247/ 219 =
112.79
82/ 1210 =
6.78
357/ 1320 =
27.05
Paraphrase This Document
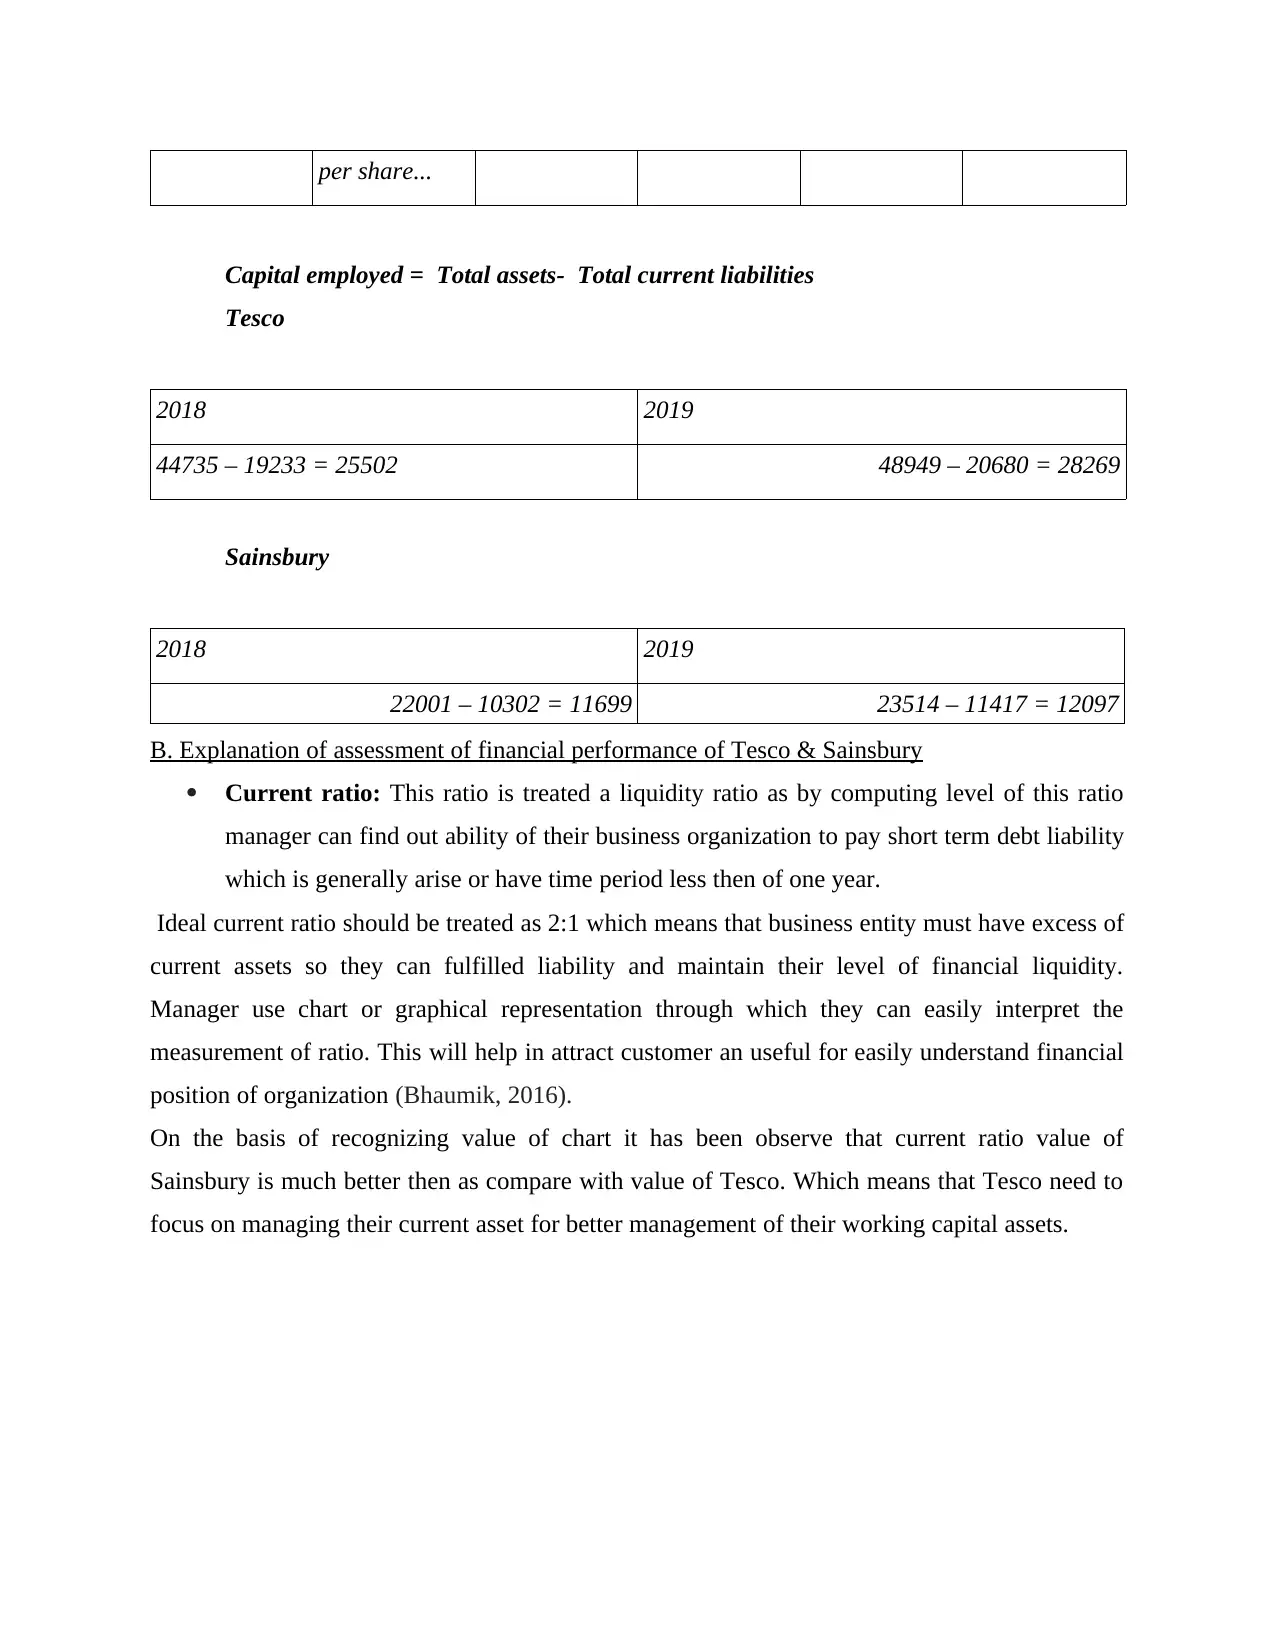
Capital employed = Total assets- Total current liabilities
Tesco
2018 2019
44735 – 19233 = 25502 48949 – 20680 = 28269
Sainsbury
2018 2019
22001 – 10302 = 11699 23514 – 11417 = 12097
B. Explanation of assessment of financial performance of Tesco & Sainsbury
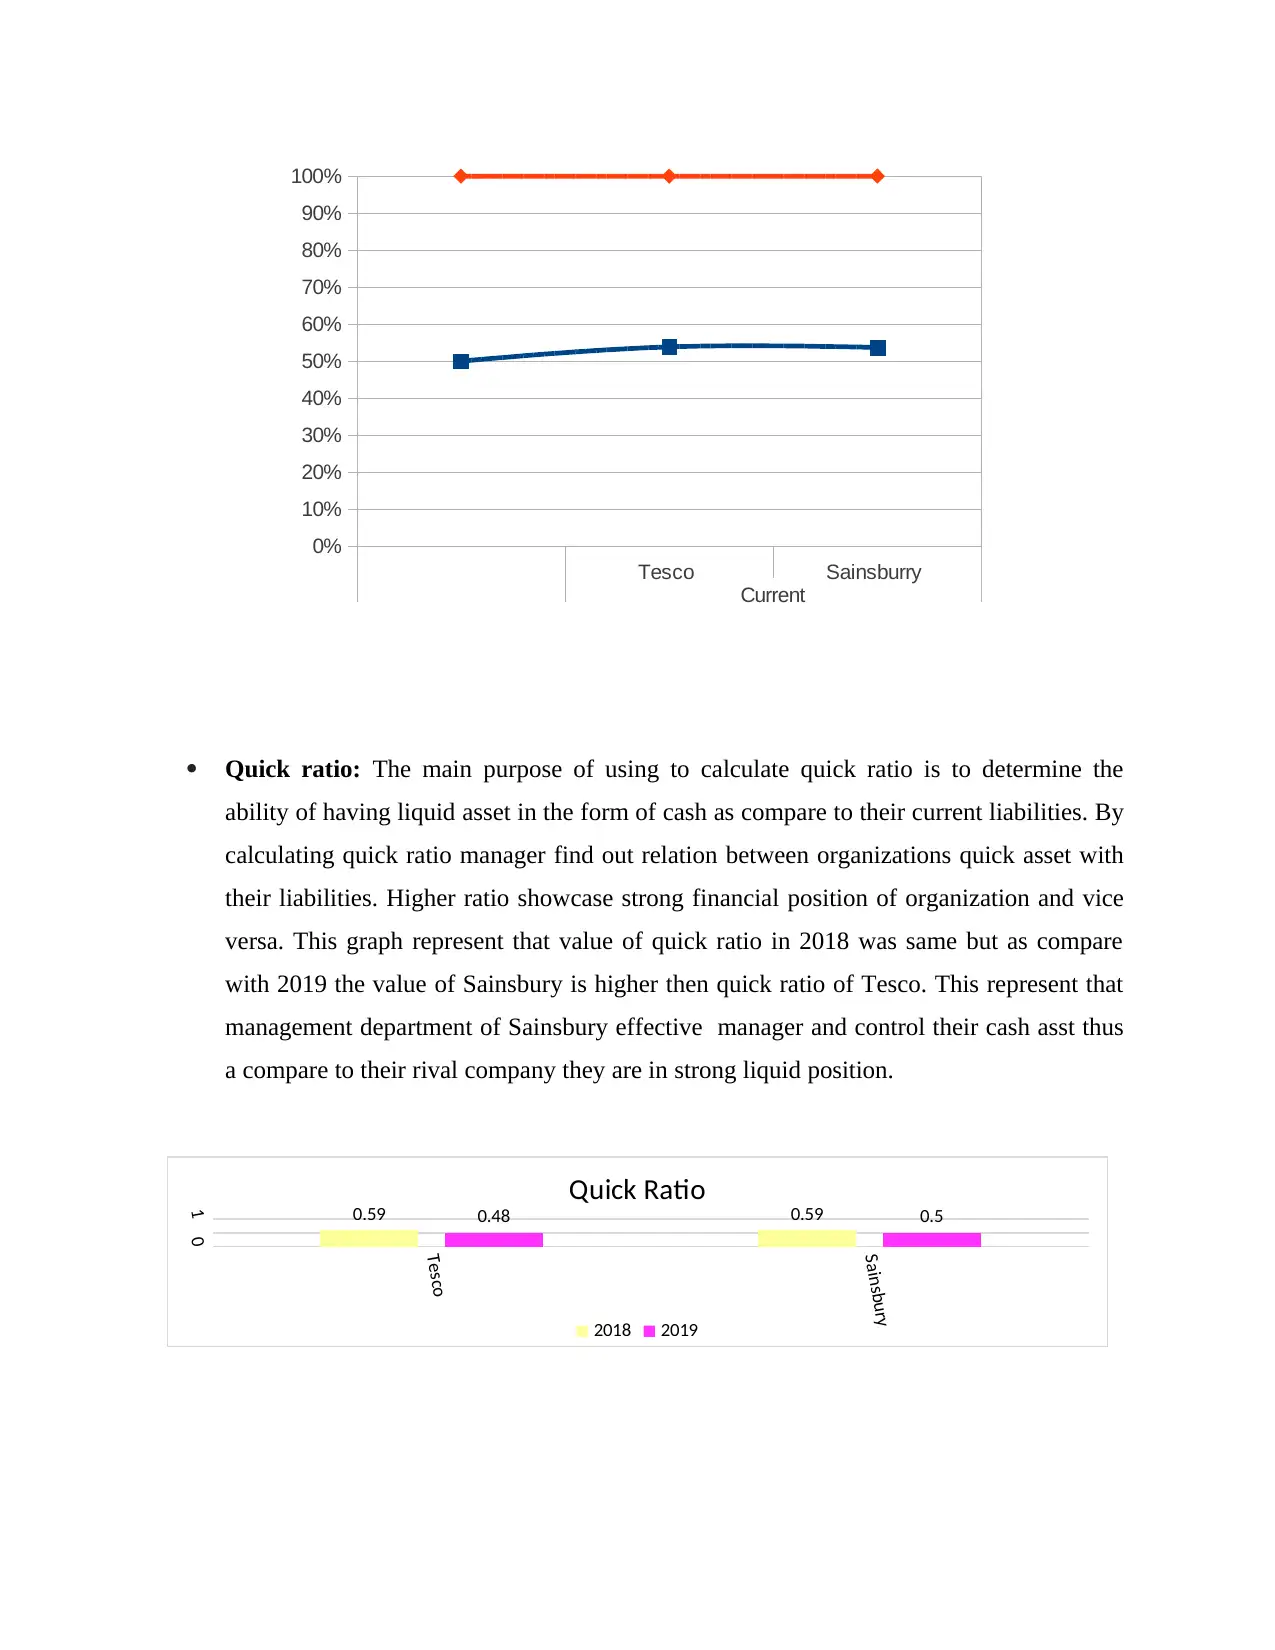
Current ratio: This ratio is treated a liquidity ratio as by computing level of this ratio
manager can find out ability of their business organization to pay short term debt liability
which is generally arise or have time period less then of one year.
Ideal current ratio should be treated as 2:1 which means that business entity must have excess of
current assets so they can fulfilled liability and maintain their level of financial liquidity.
Manager use chart or graphical representation through which they can easily interpret the
measurement of ratio. This will help in attract customer an useful for easily understand financial
position of organization (Bhaumik, 2016).
On the basis of recognizing value of chart it has been observe that current ratio value of
Sainsbury is much better then as compare with value of Tesco. Which means that Tesco need to
focus on managing their current asset for better management of their working capital assets.
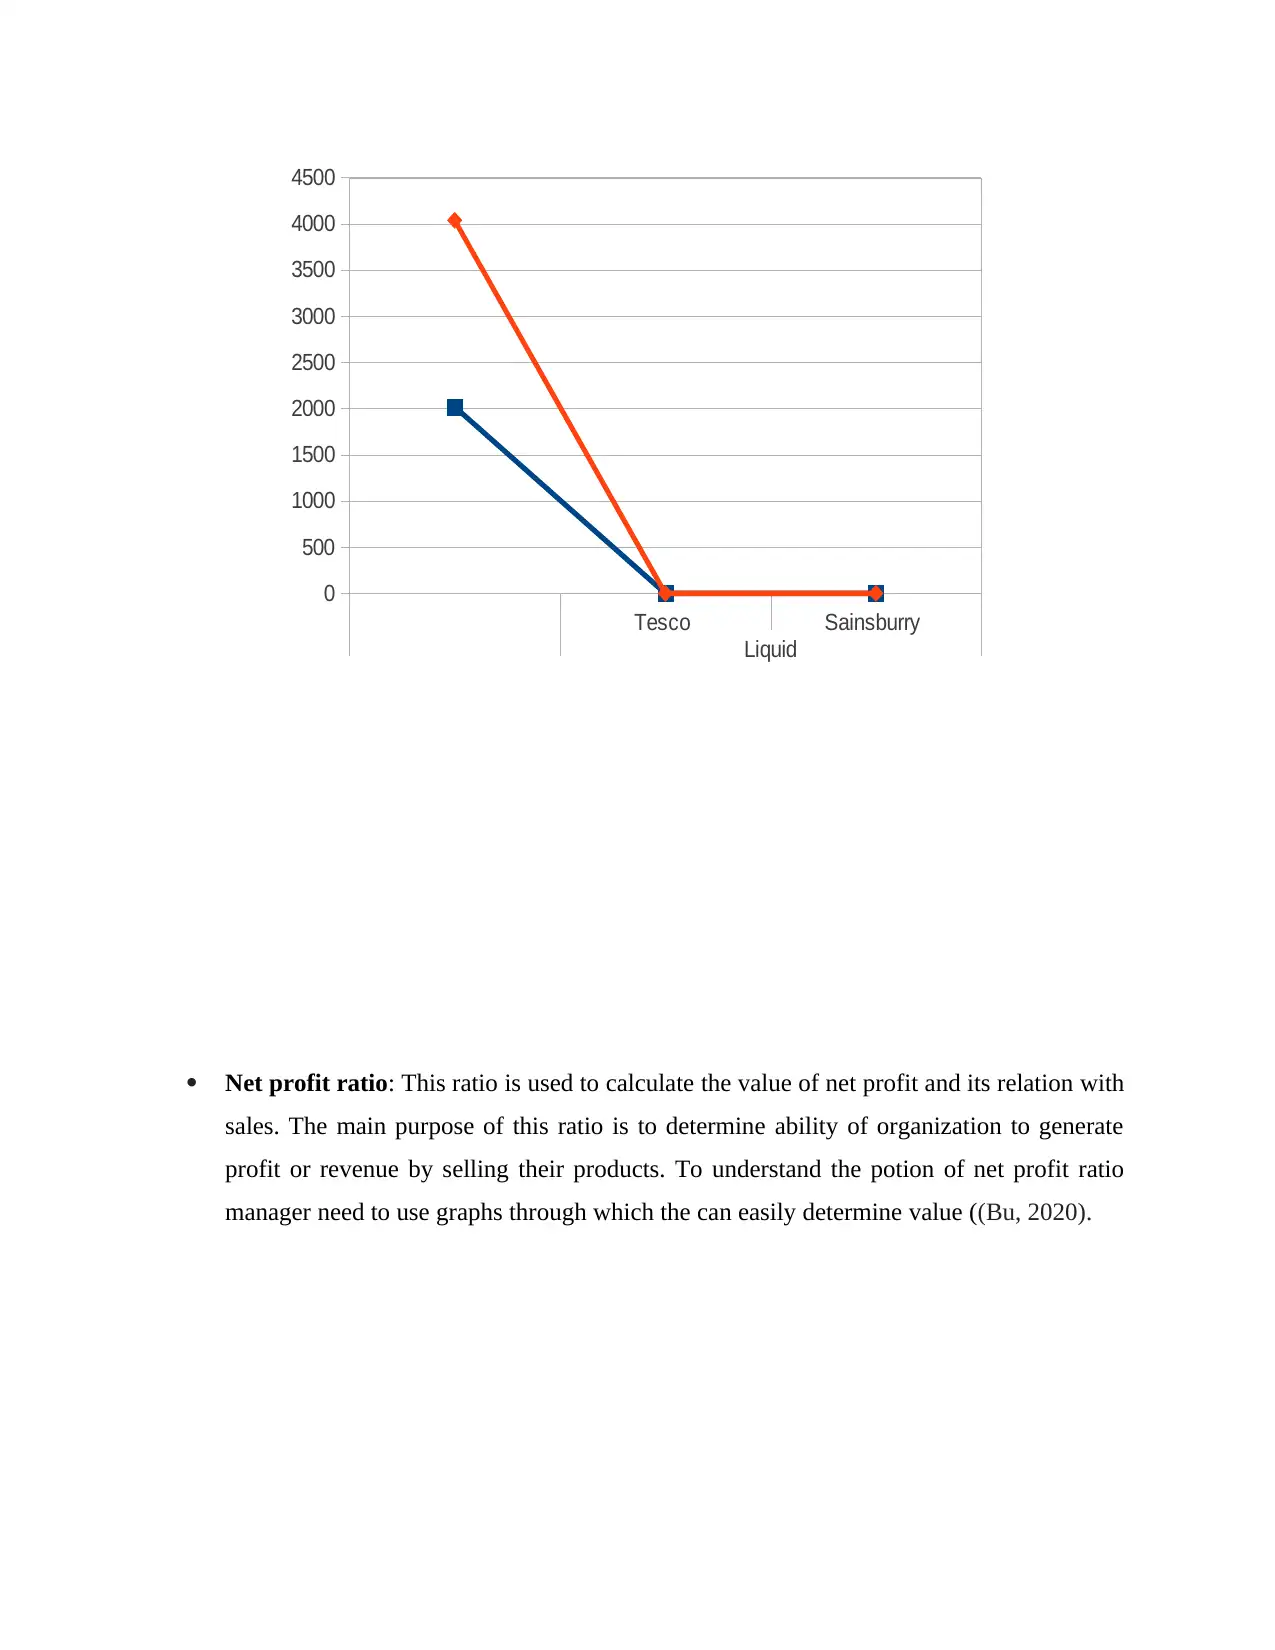
ability of having liquid asset in the form of cash as compare to their current liabilities. By
calculating quick ratio manager find out relation between organizations quick asset with
their liabilities. Higher ratio showcase strong financial position of organization and vice
versa. This graph represent that value of quick ratio in 2018 was same but as compare
with 2019 the value of Sainsbury is higher then quick ratio of Tesco. This represent that
management department of Sainsbury effective manager and control their cash asst thus
a compare to their rival company they are in strong liquid position.
Tesco Sainsburry
Current
0%
10%
20%
30%
40%
50%
60%
70%
80%
90%
100%
Tesco
Sainsbury
01 0.59 0.590.48 0.5
Quick Ratio
2018 2019
⊘ This is a preview!⊘
Do you want full access?
Subscribe today to unlock all pages.
Trusted by 1+ million students worldwide
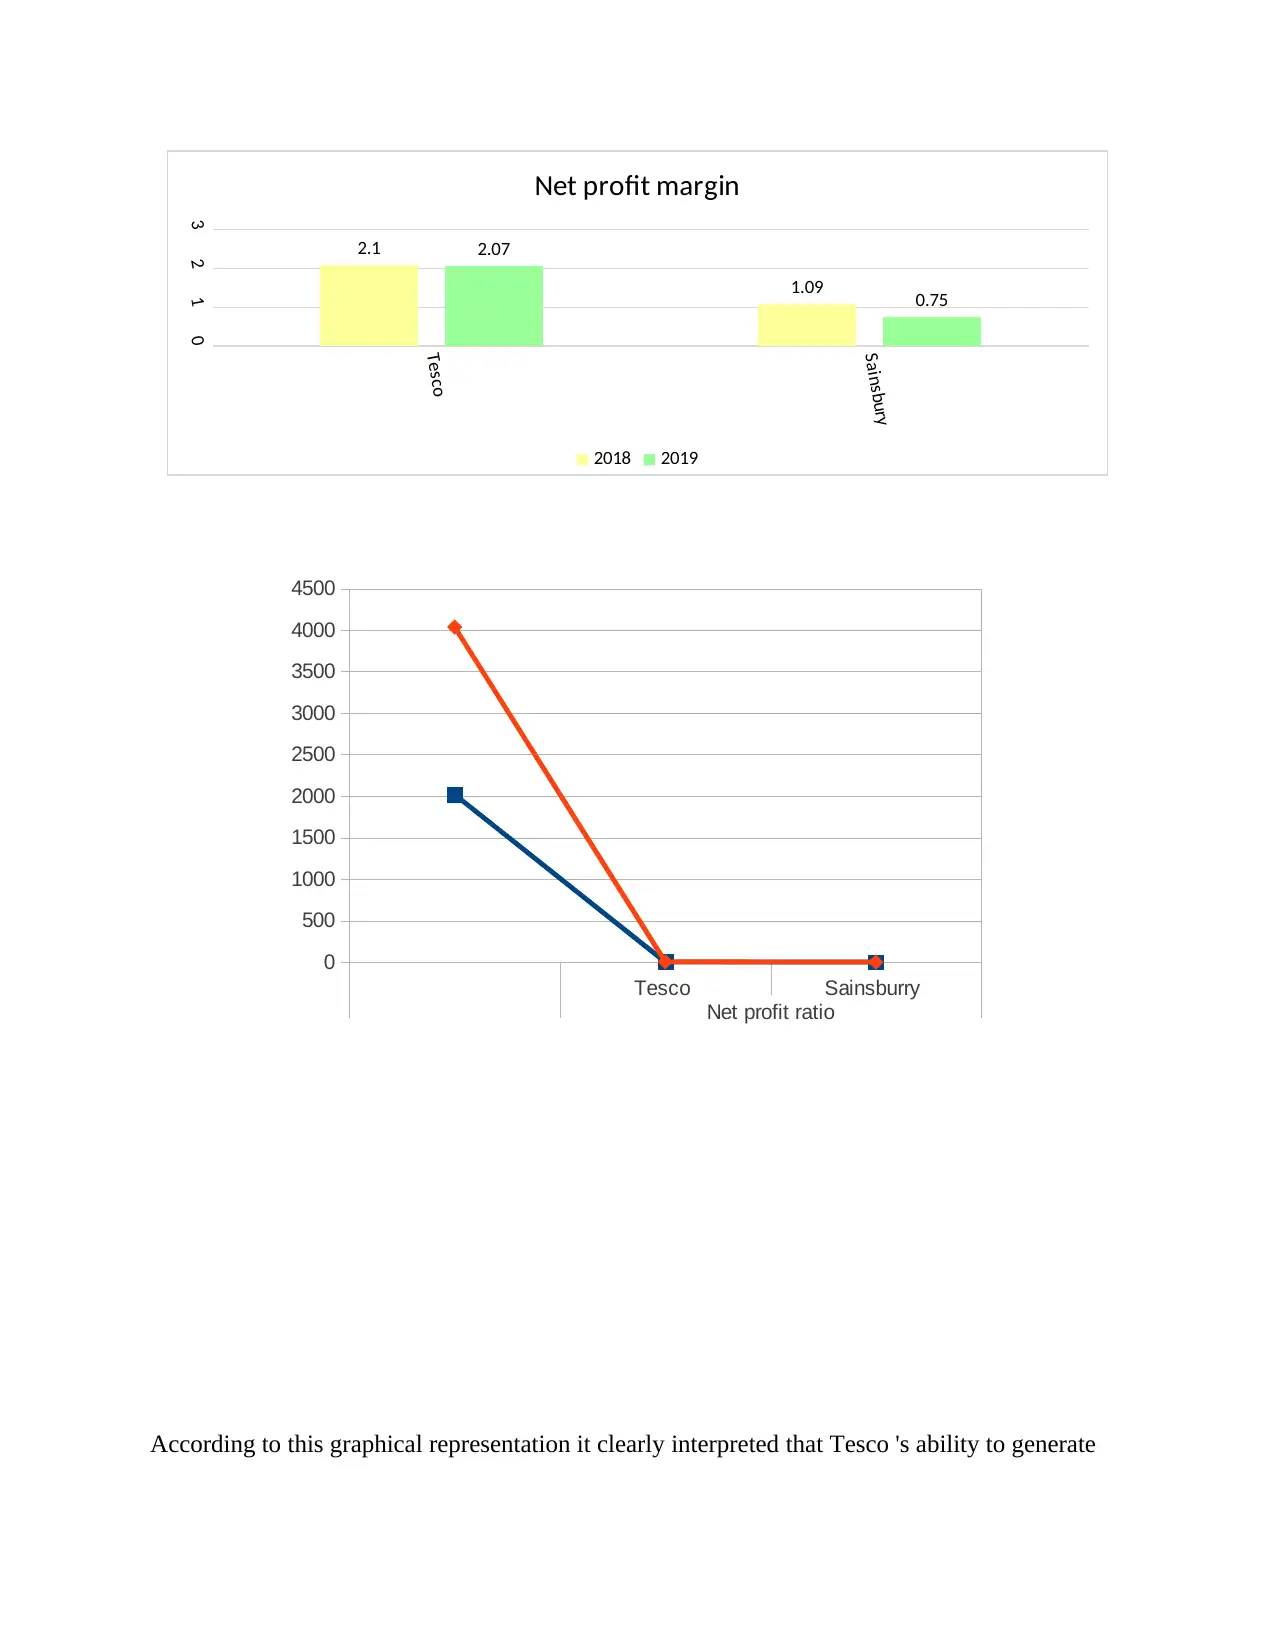
sales. The main purpose of this ratio is to determine ability of organization to generate
profit or revenue by selling their products. To understand the potion of net profit ratio
manager need to use graphs through which the can easily determine value ((Bu, 2020).
Tesco Sainsburry
Liquid
0
500
1000
1500
2000
2500
3000
3500
4000
4500
Paraphrase This Document
Tesco
Sainsbury
0123
2.1
1.09
2.07
0.75
Net profit margin
2018 2019
Tesco Sainsburry
Net profit ratio
0
500
1000
1500
2000
2500
3000
3500
4000
4500
ratio was 2.1 and in 2019 it was determine at 2.07 on the other side Sainsbur only generate 1.09
in 2018 and its profit value decliner 0.75.Which means that Tesco able to attain more profit as
compare to Sainsubry.
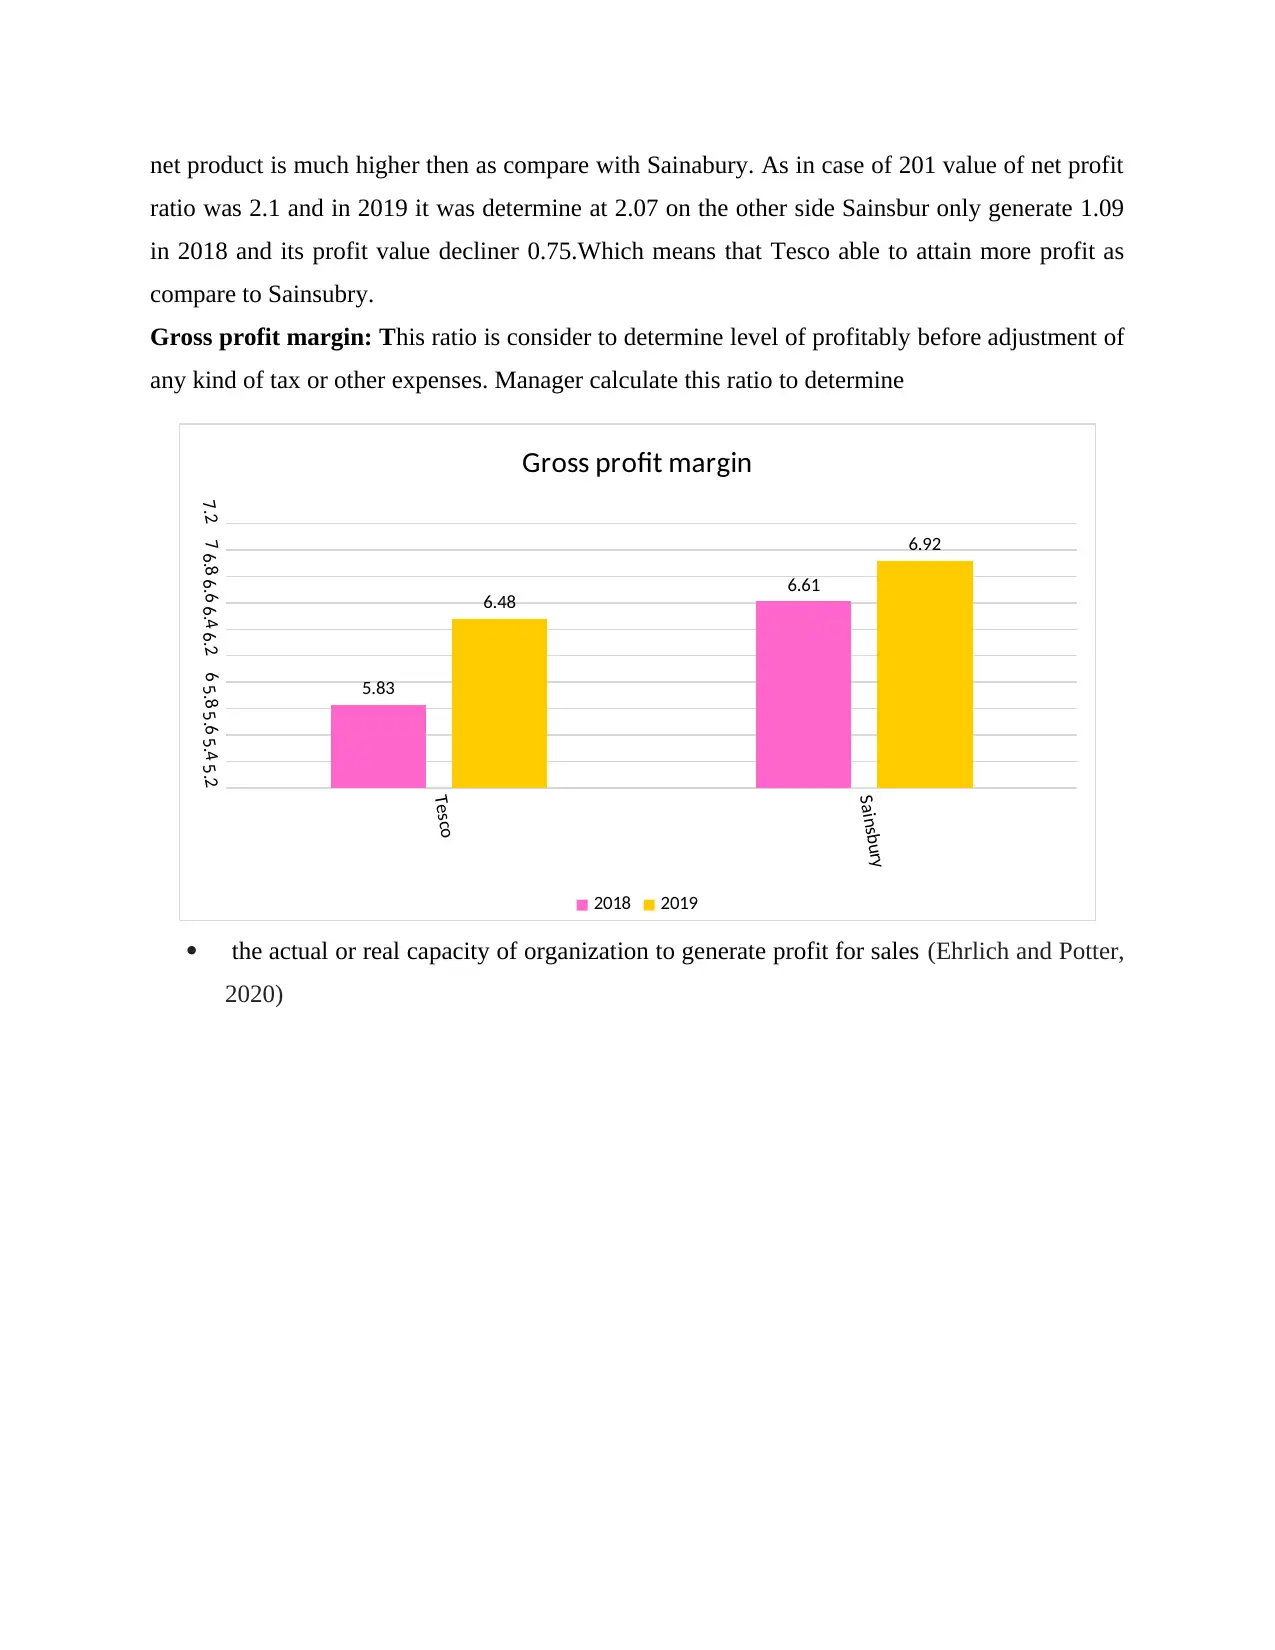
Gross profit margin: This ratio is consider to determine level of profitably before adjustment of
any kind of tax or other expenses. Manager calculate this ratio to determine
the actual or real capacity of organization to generate profit for sales (Ehrlich and Potter,
2020)
Tesco
Sainsbury
5.25.45.65.866.26.46.66.877.2
5.83
6.61
6.48
6.92
Gross profit margin
2018 2019
⊘ This is a preview!⊘
Do you want full access?
Subscribe today to unlock all pages.
Trusted by 1+ million students worldwide
value of Sainsbury is higher . This means that the revenue rate of Sainsbury is better then Tesco
but due to their selling expenses it is not able to generate more profit as compare to their rival
industries.
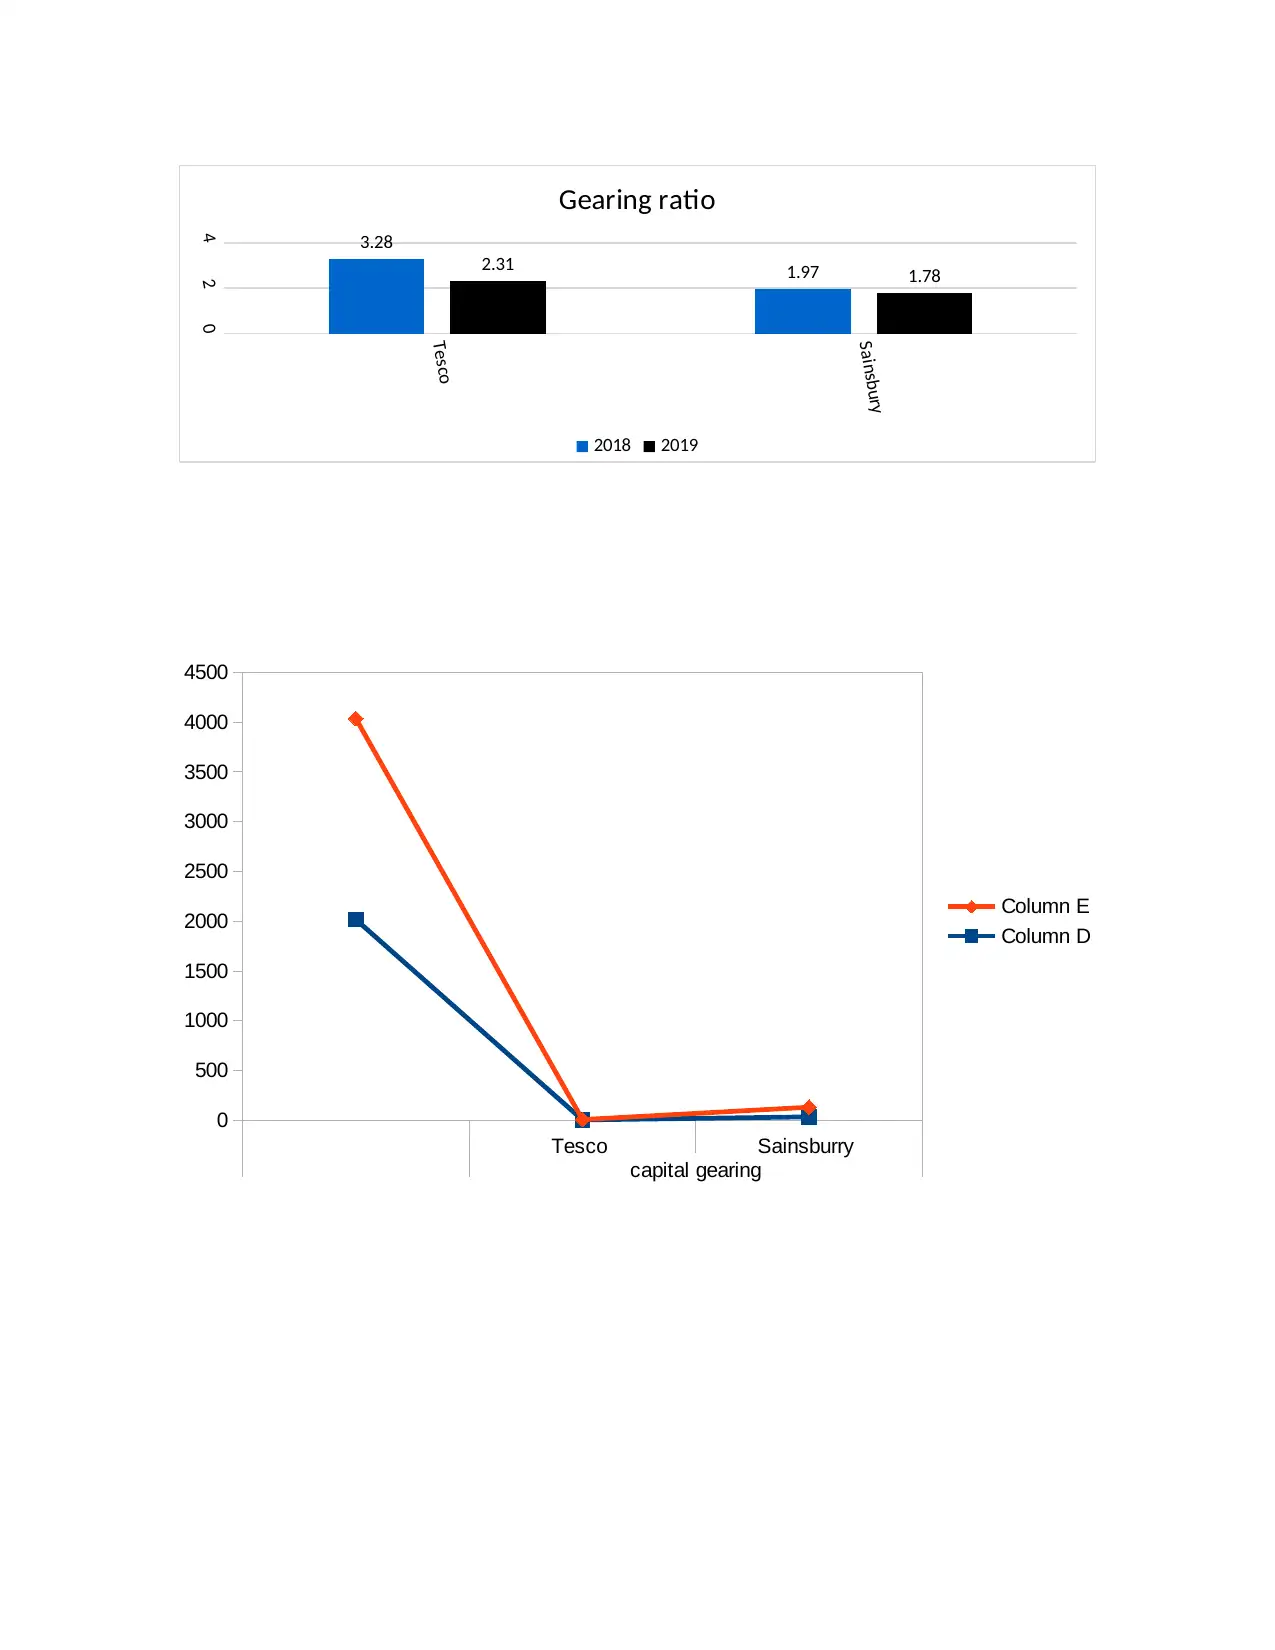
Gearing ratio:The main purpose of determining this ratio is to identify value of financial
leverage by calculating or measuring value of equity and business liabilities. The main
purpose of determining this ratio to evaluate that business corporation must have
sufficient external source which will help in measuring or providing tax benefits. To
evaluate gearing ratio of Tesco and Sainsbury chart has been formulated.
Tesco Sainsburry
Gross profit ratio
0
500
1000
1500
2000
2500
3000
3500
4000
4500
Paraphrase This Document
Sainsbury
024 3.28
1.972.31 1.78
Gearing ratio
2018 2019
Tesco Sainsburry
capital gearing
0
500
1000
1500
2000
2500
3000
3500
4000
4500
Column E
Column D
which means that this organization use or formulate strategies which help in managing their
extent funds in effective way as compare with Sainsbury.
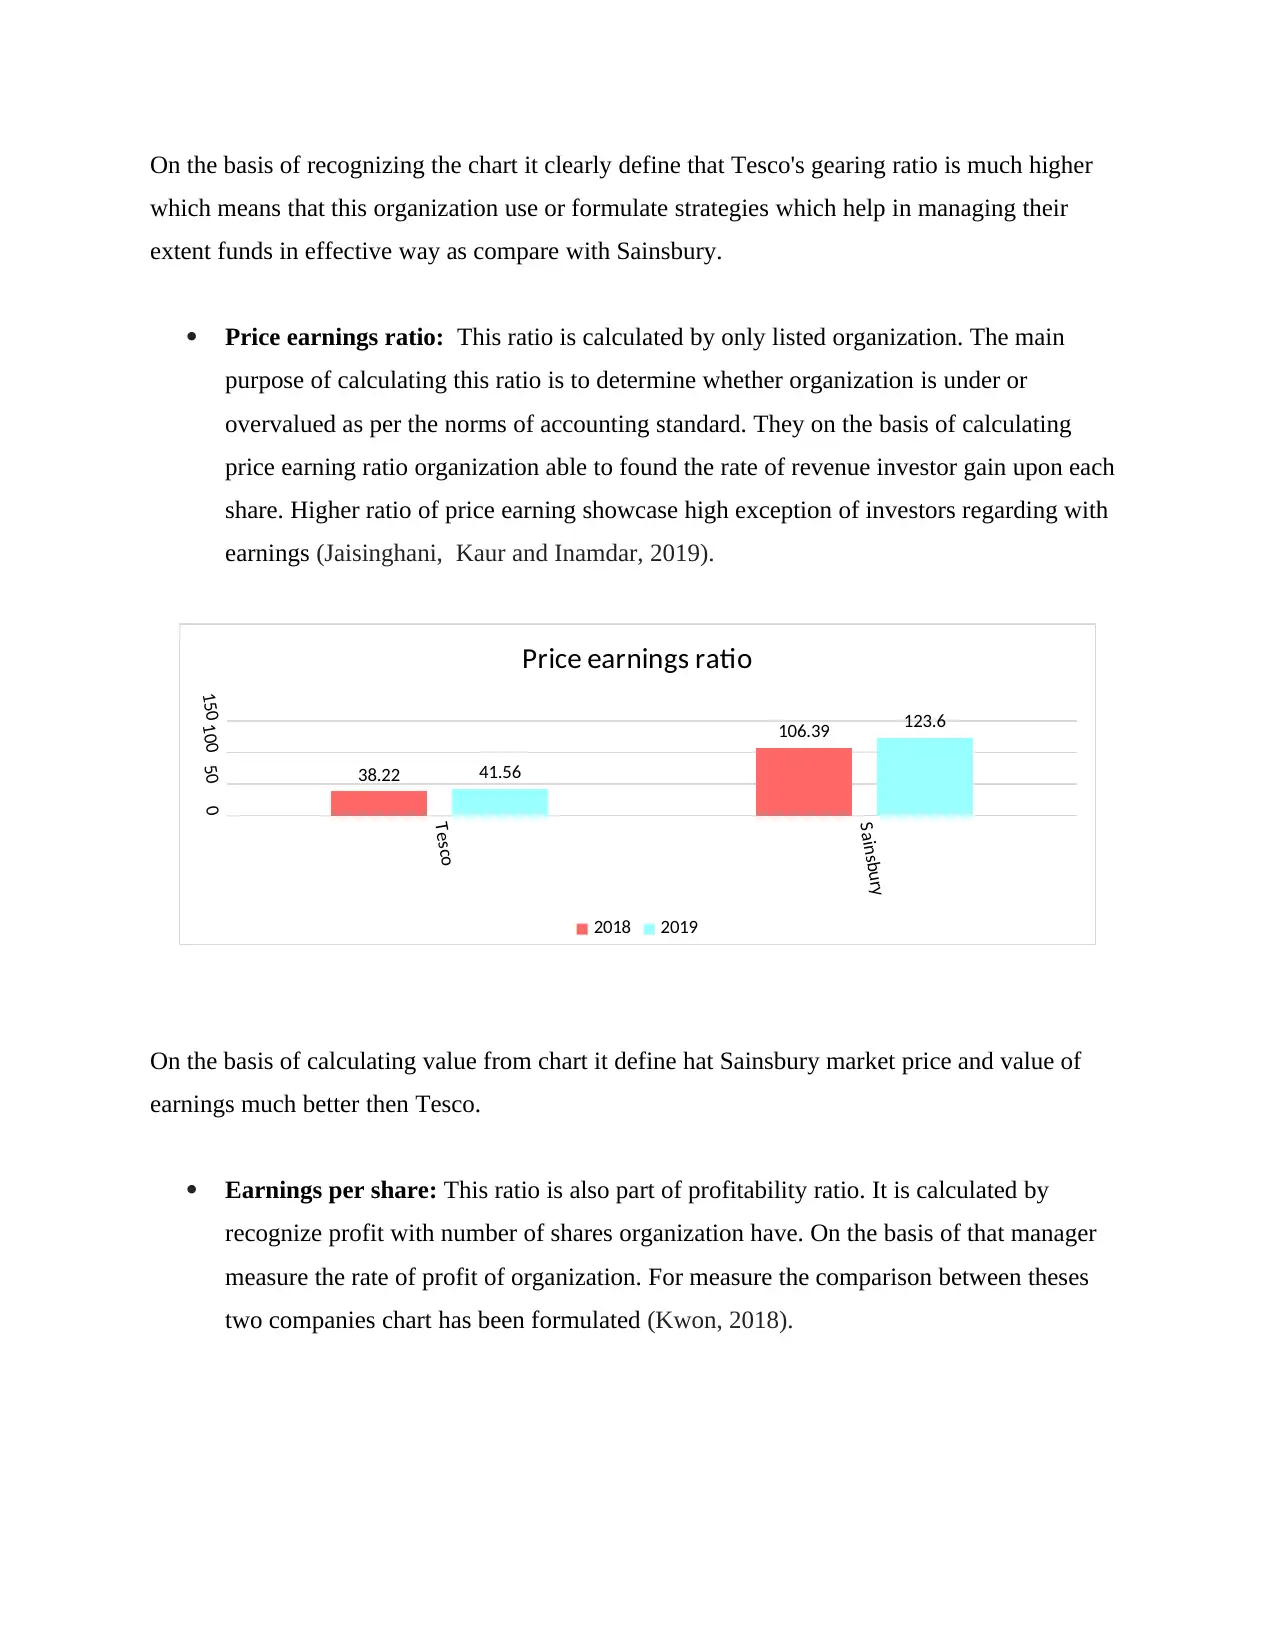
Price earnings ratio: This ratio is calculated by only listed organization. The main
purpose of calculating this ratio is to determine whether organization is under or
overvalued as per the norms of accounting standard. They on the basis of calculating
price earning ratio organization able to found the rate of revenue investor gain upon each
share. Higher ratio of price earning showcase high exception of investors regarding with
earnings (Jaisinghani, Kaur and Inamdar, 2019).
On the basis of calculating value from chart it define hat Sainsbury market price and value of
earnings much better then Tesco.
Earnings per share: This ratio is also part of profitability ratio. It is calculated by
recognize profit with number of shares organization have. On the basis of that manager
measure the rate of profit of organization. For measure the comparison between theses
two companies chart has been formulated (Kwon, 2018).
Tesco
Sainsbury
050100150
38.22
106.39
41.56
123.6
Price earnings ratio
2018 2019
⊘ This is a preview!⊘
Do you want full access?
Subscribe today to unlock all pages.
Trusted by 1+ million students worldwide
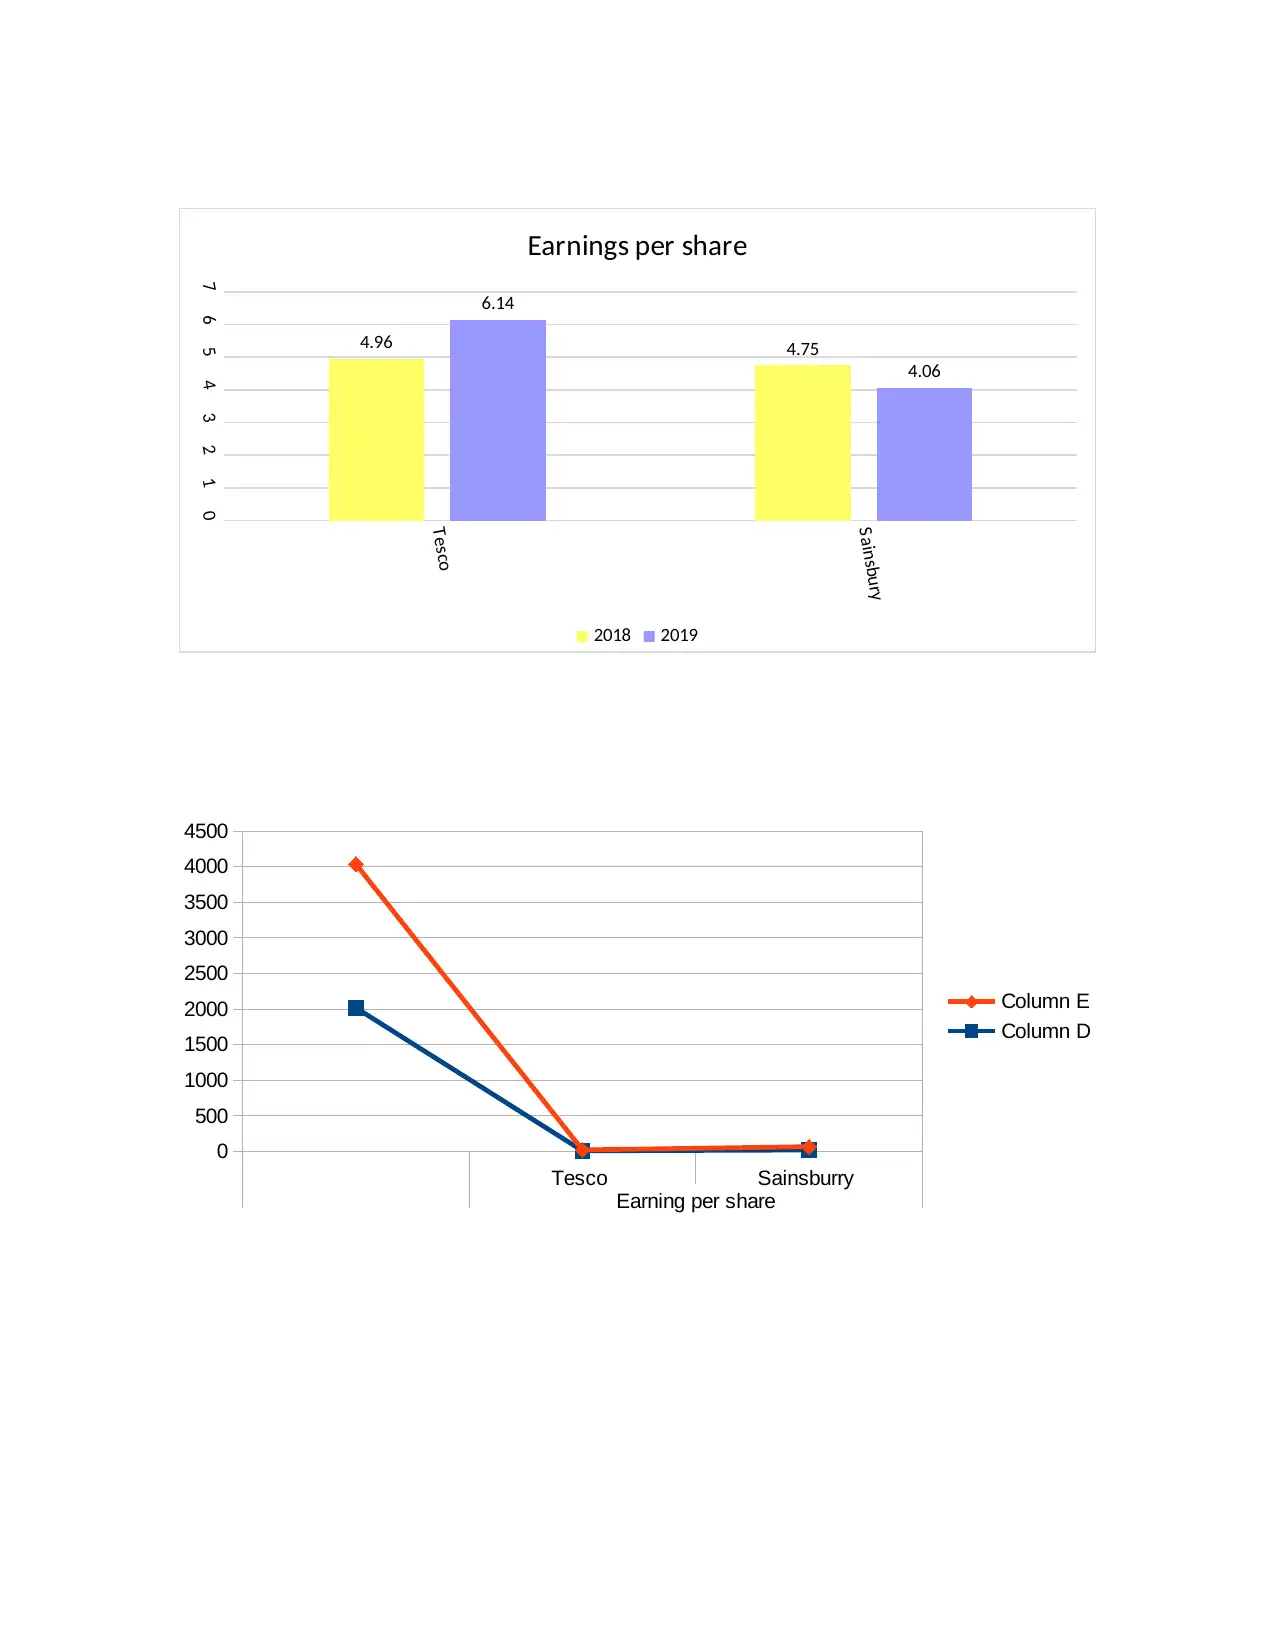
Sainsbury
01234567
4.96 4.75
6.14
4.06
Earnings per share
2018 2019
Tesco Sainsburry
Earning per share
0
500
1000
1500
2000
2500
3000
3500
4000
4500
Column E
Column D
Paraphrase This Document
per share price is much better then its rival industry.
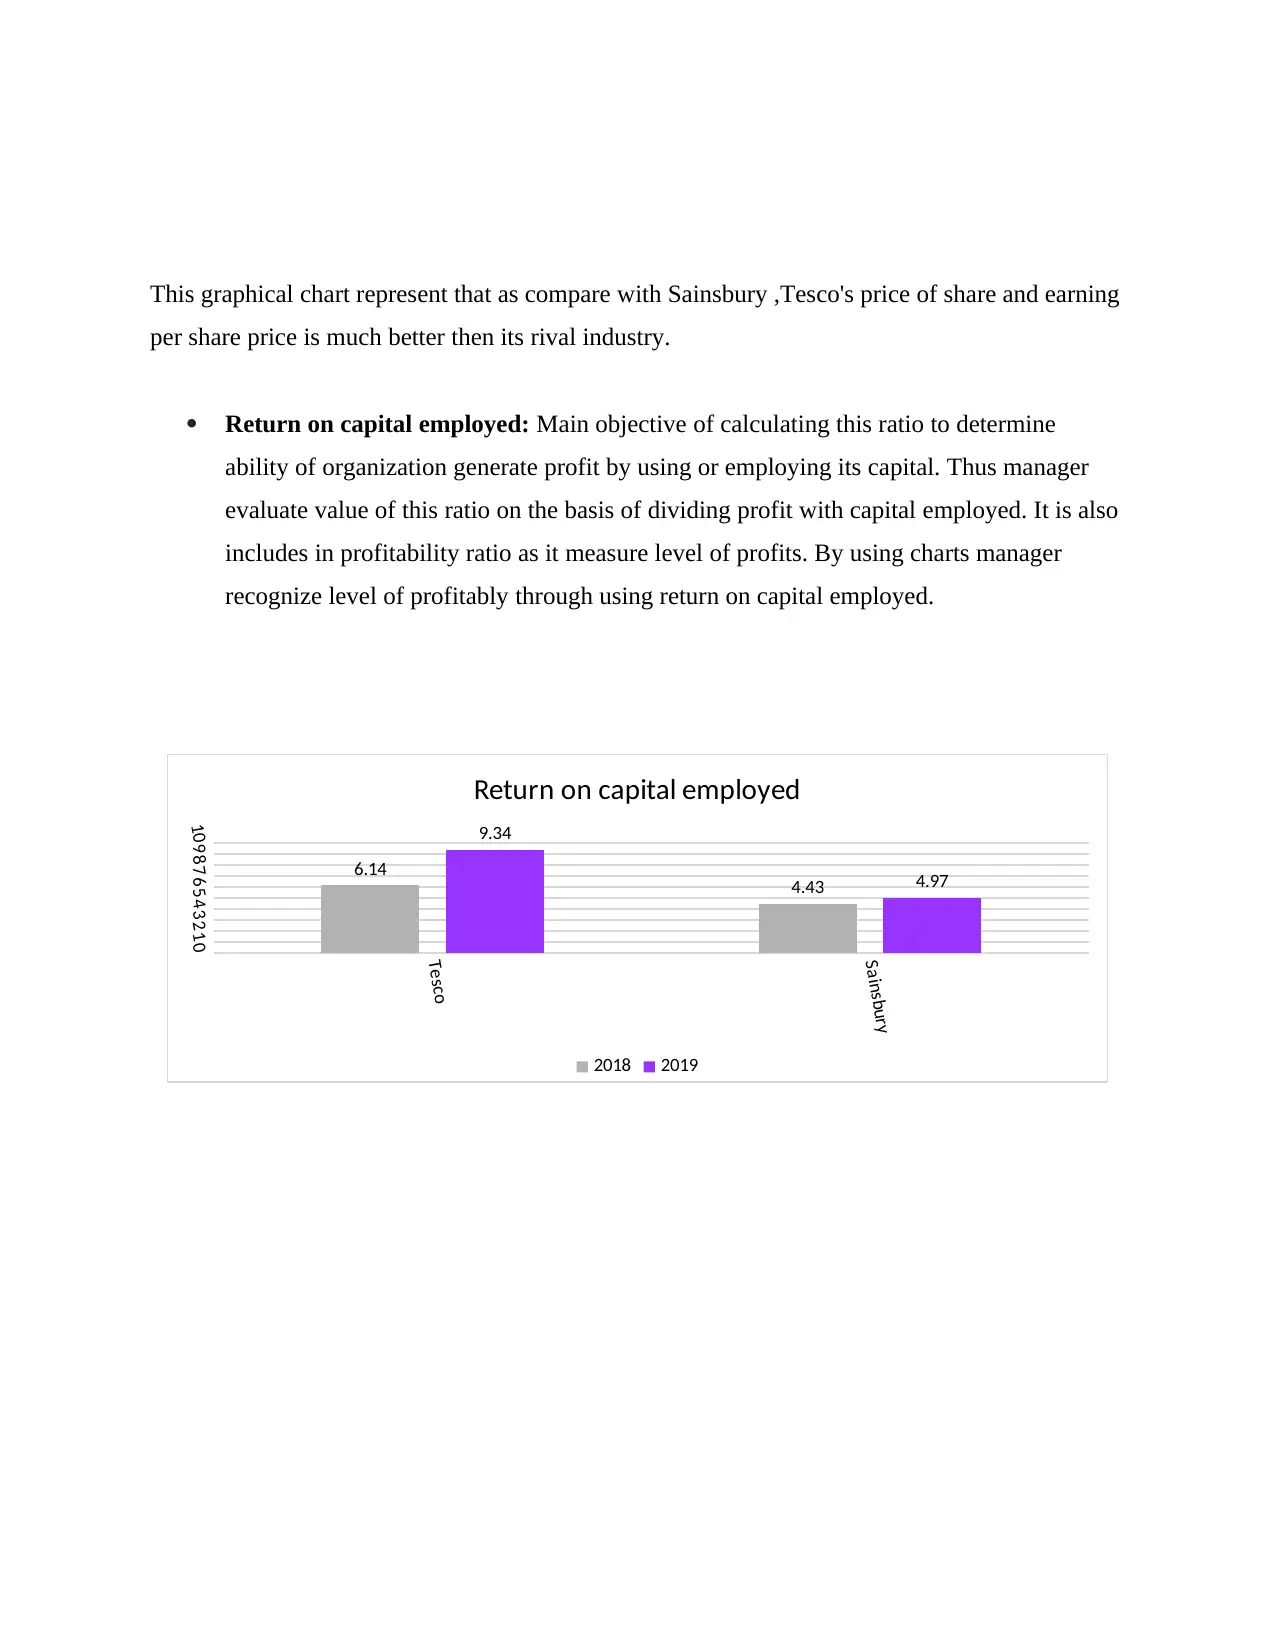
Return on capital employed: Main objective of calculating this ratio to determine
ability of organization generate profit by using or employing its capital. Thus manager
evaluate value of this ratio on the basis of dividing profit with capital employed. It is also
includes in profitability ratio as it measure level of profits. By using charts manager
recognize level of profitably through using return on capital employed.
Tesco
Sainsbury
012345678910
6.14 4.43
9.34
4.97
Return on capital employed
2018 2019
manage their asset and capital in effective manner as compare to its rival company.
Stock turnover ratio: This ratio is used to evaluate the rate at which stock has been
replace and sell within the market . Higher stock turnover ratio showcase long time
require to compete the operating cycle for goods. This ratio is define by measuring
performance of two organizations. It is showcase efficiency level of organization fr
particular time period (Meng and Wang, 2019).
Tesco Sainsburry
returm on capital
0
500
1000
1500
2000
2500
3000
3500
4000
4500
Column E
Column D
⊘ This is a preview!⊘
Do you want full access?
Subscribe today to unlock all pages.
Trusted by 1+ million students worldwide
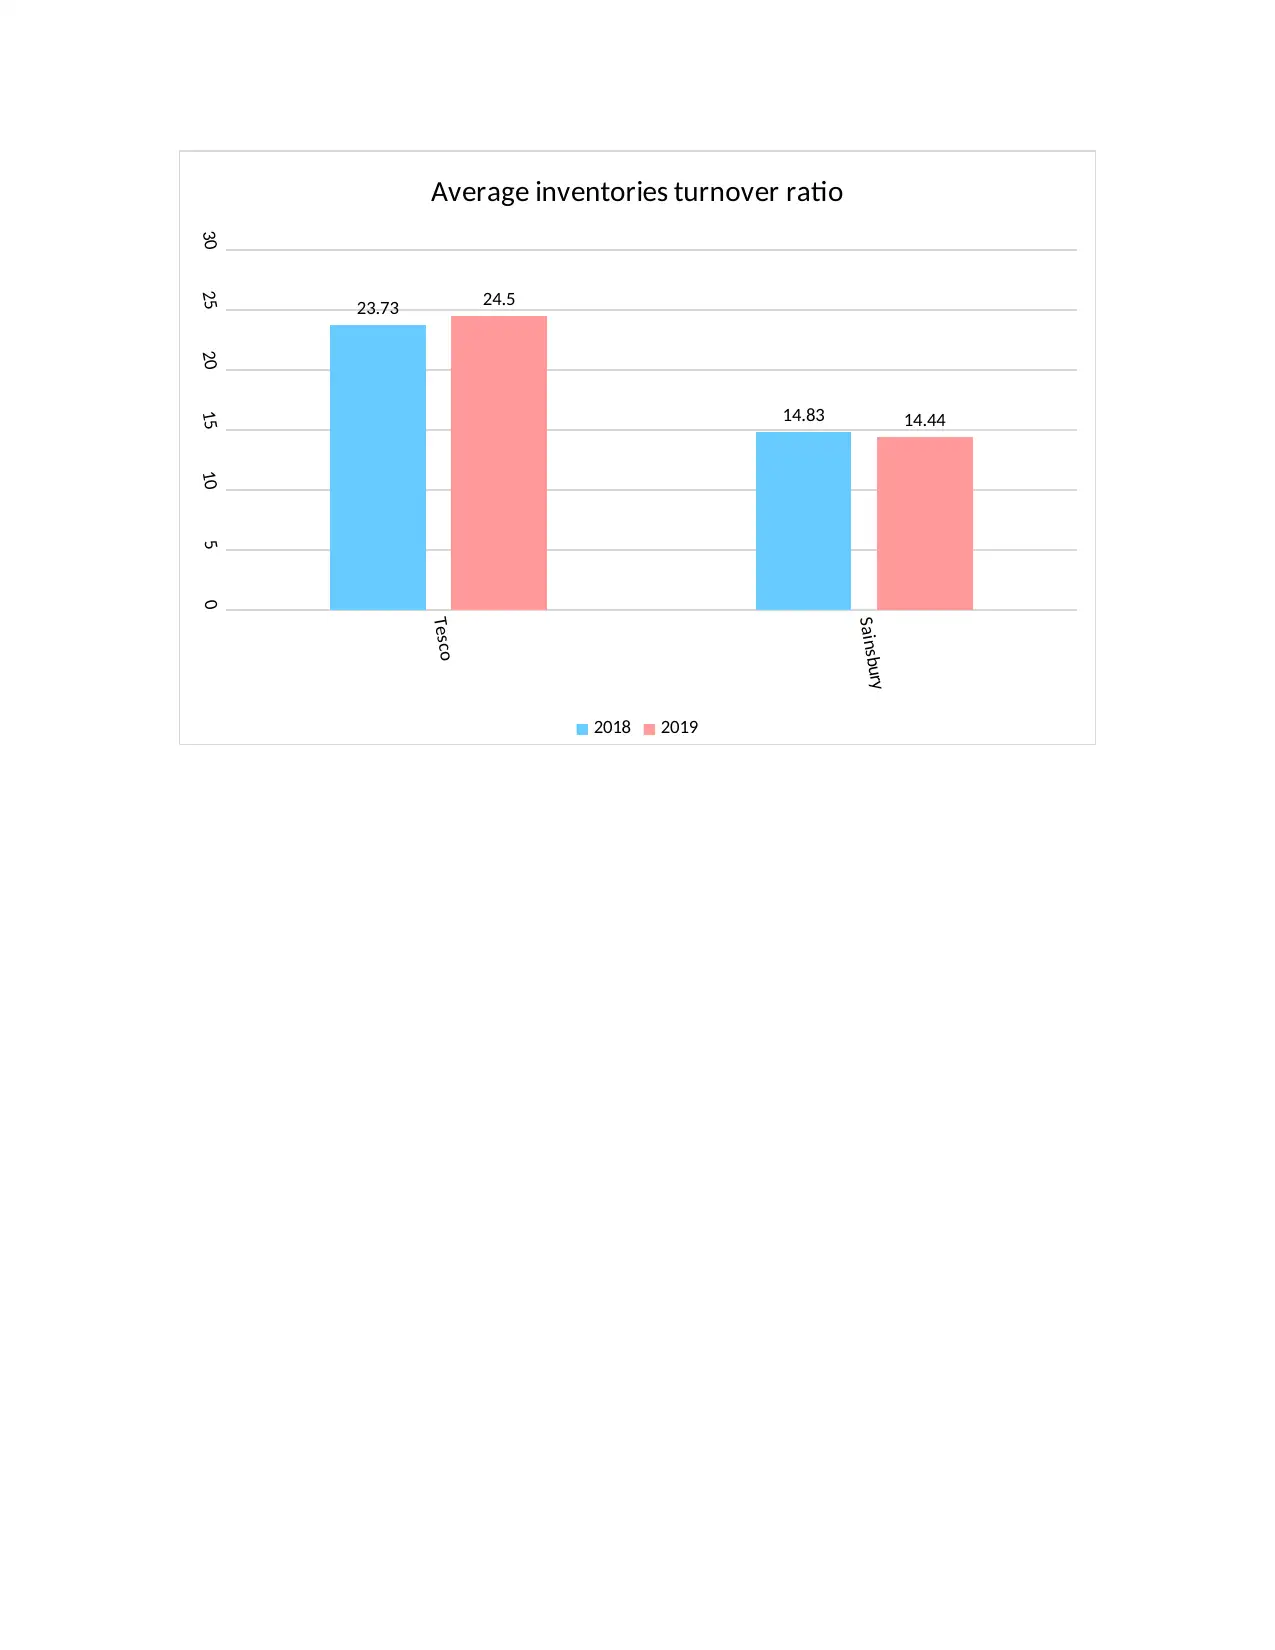
Sainsbury
0
5
10
15
20
25
30
23.73
14.83
24.5
14.44
Average inventories turnover ratio
2018 2019
Paraphrase This Document
material and run the operating cycle and as compare with this Tesco took more time for running
or compete their stock turnover cycle. This means that management department of Sainsbury
effective formulate ad control their stock management strategy.
Dividend pay-out ratio: By calculating dividend pay out ratio customers able to find out
value of dividend or rate which organization pay to their relevant shareholder. Higher dividend
pay out ratio show case positive relation between profit and dividend which means that
organization offer high rate of dividend. By formulating chart
Tesco Sainsburry
inventory
0
500
1000
1500
2000
2500
3000
3500
4000
4500
Column E
Column D
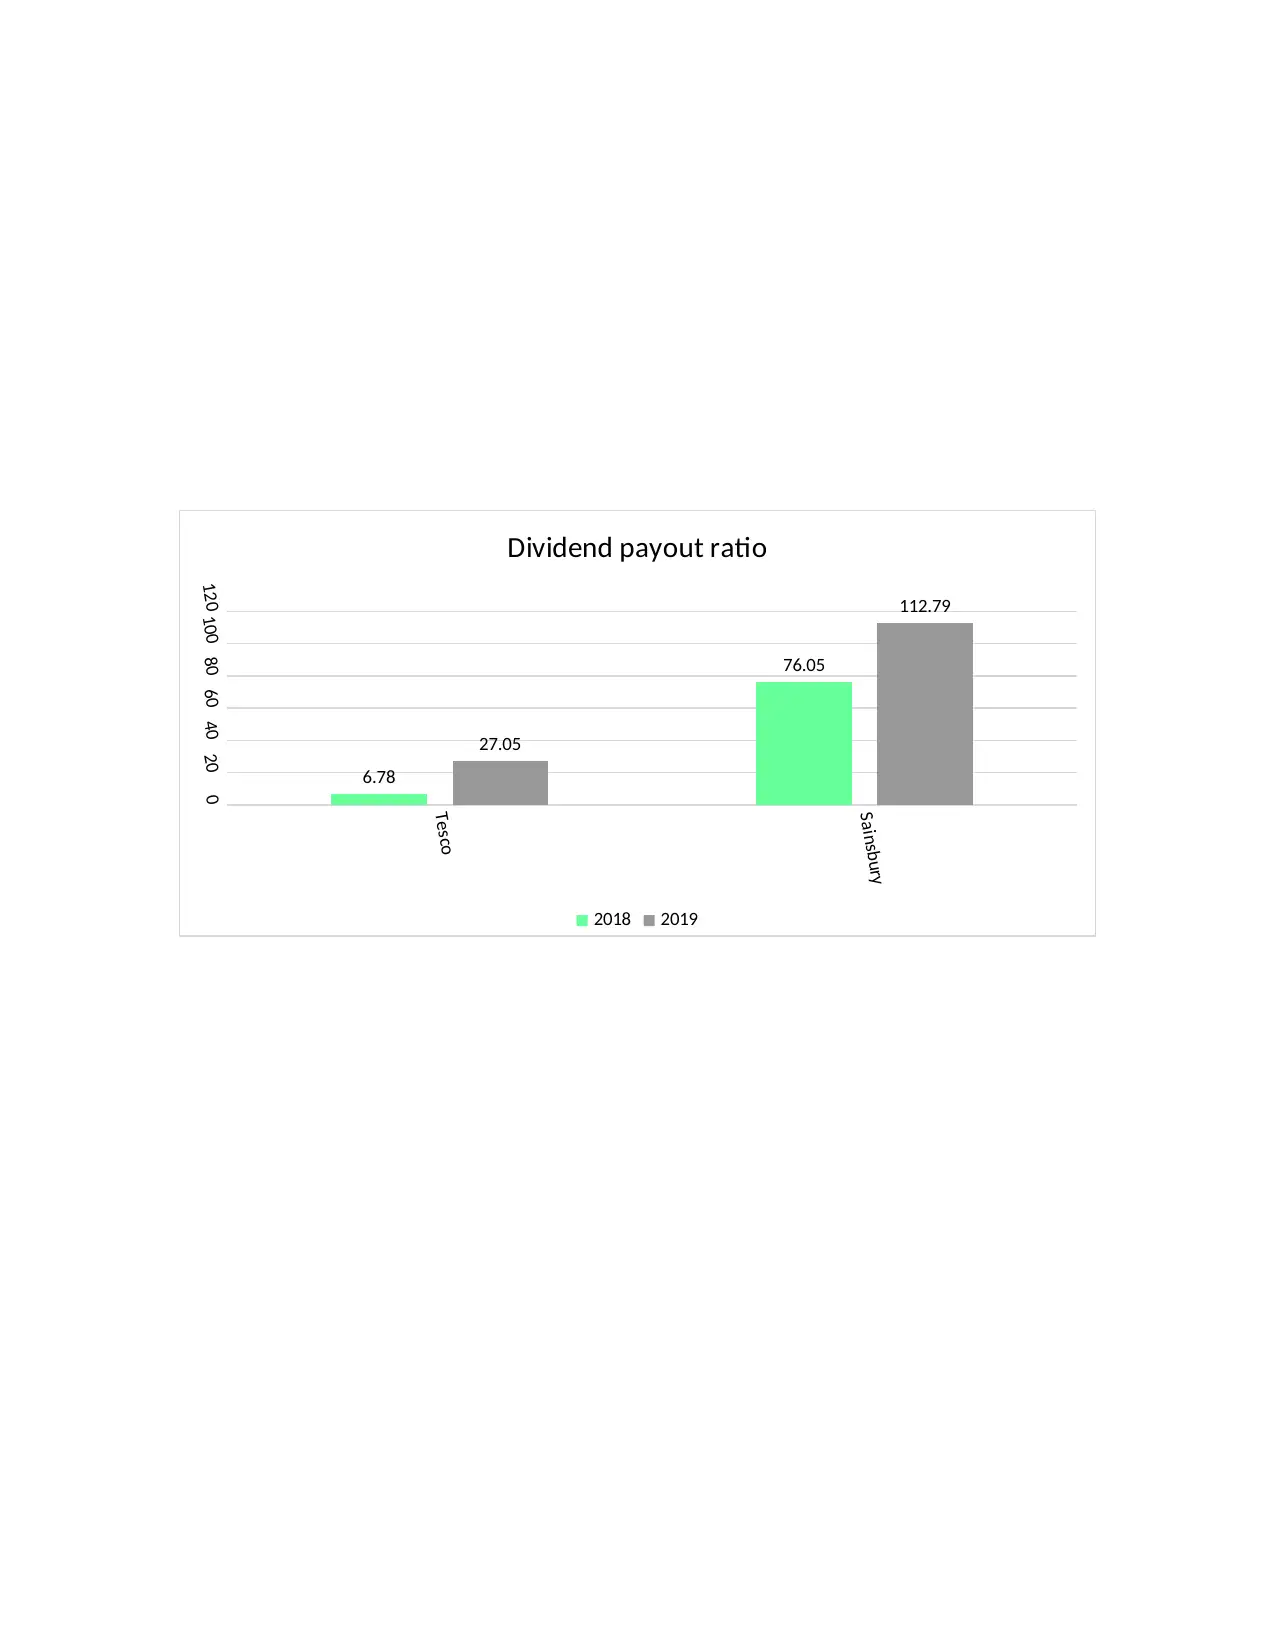
Sainsbury
020406080100120
6.78
76.05
27.05
112.79
Dividend payout ratio
2018 2019
⊘ This is a preview!⊘
Do you want full access?
Subscribe today to unlock all pages.
Trusted by 1+ million students worldwide
as compare to this Tesco only distribute 40 percentage of their dividend to shareholder. Which
mean that price of dividend of Sainsbury is much better, which represent that shareholder must
ned to invest in this organization as compare to Tesco (Musumeci and O’Brien, 2019).
C Explanation of main cause of poor performance of organization.
On the basis of analysing performance of each company, it recognized that even though
the value of ratio of both organization has been increase their performance has been enhance as
compare to 2018 but in case of comparison the performance of Sainsbury is far better then
Tesco.
Even though the net profit, earning per share ratio has been higher of Tesco then
Sainsbury however due to using effective stock management technique and offering higher rate
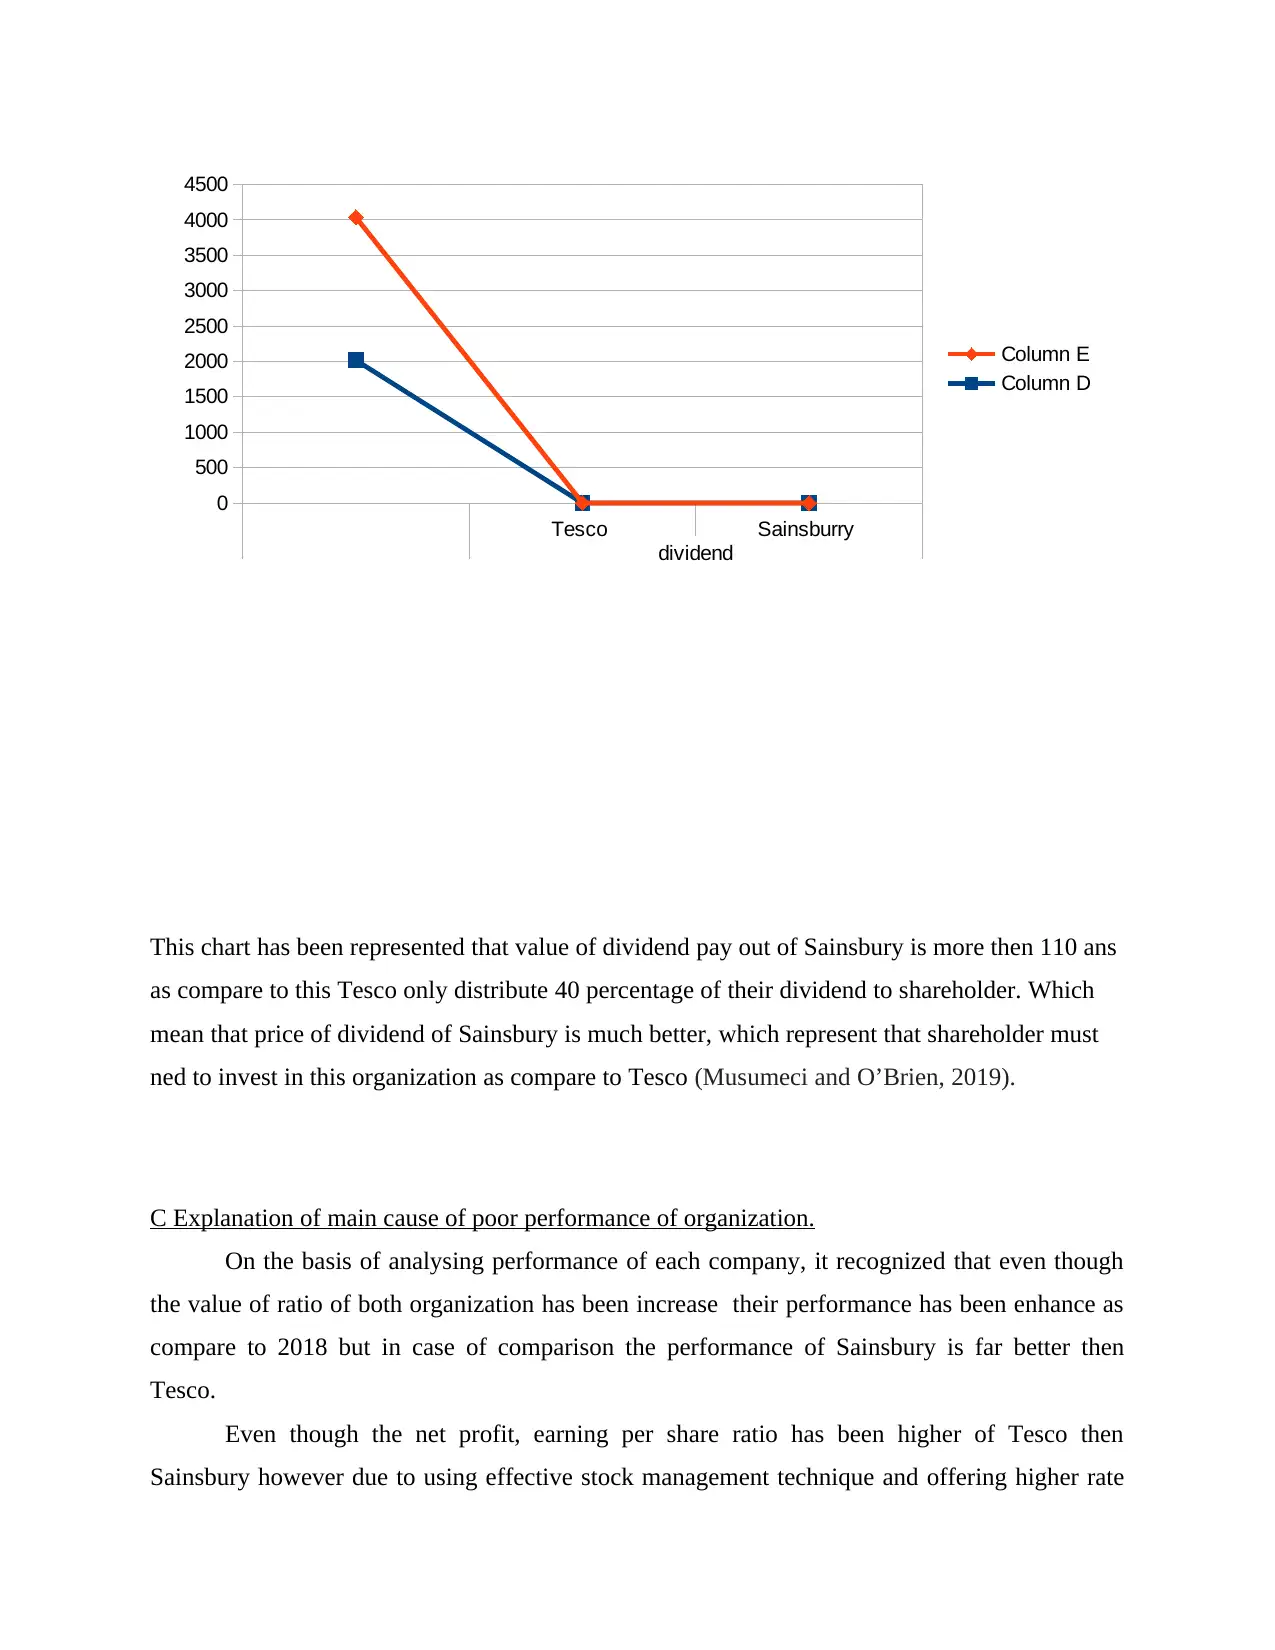
Tesco Sainsburry
dividend
0
500
1000
1500
2000
2500
3000
3500
4000
4500
Column E
Column D
Paraphrase This Document
then Tesco.
The main reason of decrement in the performance of Tesco is that their management
department is not formulator stock control management strategies, their value of cash assets is
also comparatively low. Which means that the not able to collect funds from debtors and
manage their financial funds.
Tesco due to investing in new market segment not able to generate much profit a
compare to its rival industries (Nikbakht, Shahrokhi and Corriette, 2019).
Their management department also not utilized resource and formulate budget or wok in
ethical ,systemic manner thus they are not available of beat their rivals company.
D. Limitation of financial ratio technique for measures performance of organization.
Business organization use ratio for measuring and compare their financial performance
with other companies. This may consider as appropriate tool of measurement of financial
management however there will be some of limitation of this technique which mention below
The result generate or calculate ratio are not accurate or reliable as organization belongs
from different countries use different accounting practices.
Ratio also nor define measurement of financial performance in qualitative terms.
Seasonal variation impact on the result of this ratio.
Financial ratio does not consider changes in price value. It neglect many of essential
factors.
PORTFOLIO 2
A. Use of various types of investment appraisal technique for investment decision.
Investment appraisal technique: Theses are part of financial management which
business organization use to evaluate or recognize value or performance of each alternative. On
the basis of that manager took decision which alternative provides them more benefits or which
is beneficial for attaining economic profits. Thee will be many techniques through which
manager recognize the time period and rate of profits. Following are some of them are define
below
Pay back period: This period has been calculated to identified the time required for an
alternative to cover up all the initial cost which manager use to invest during the time of project
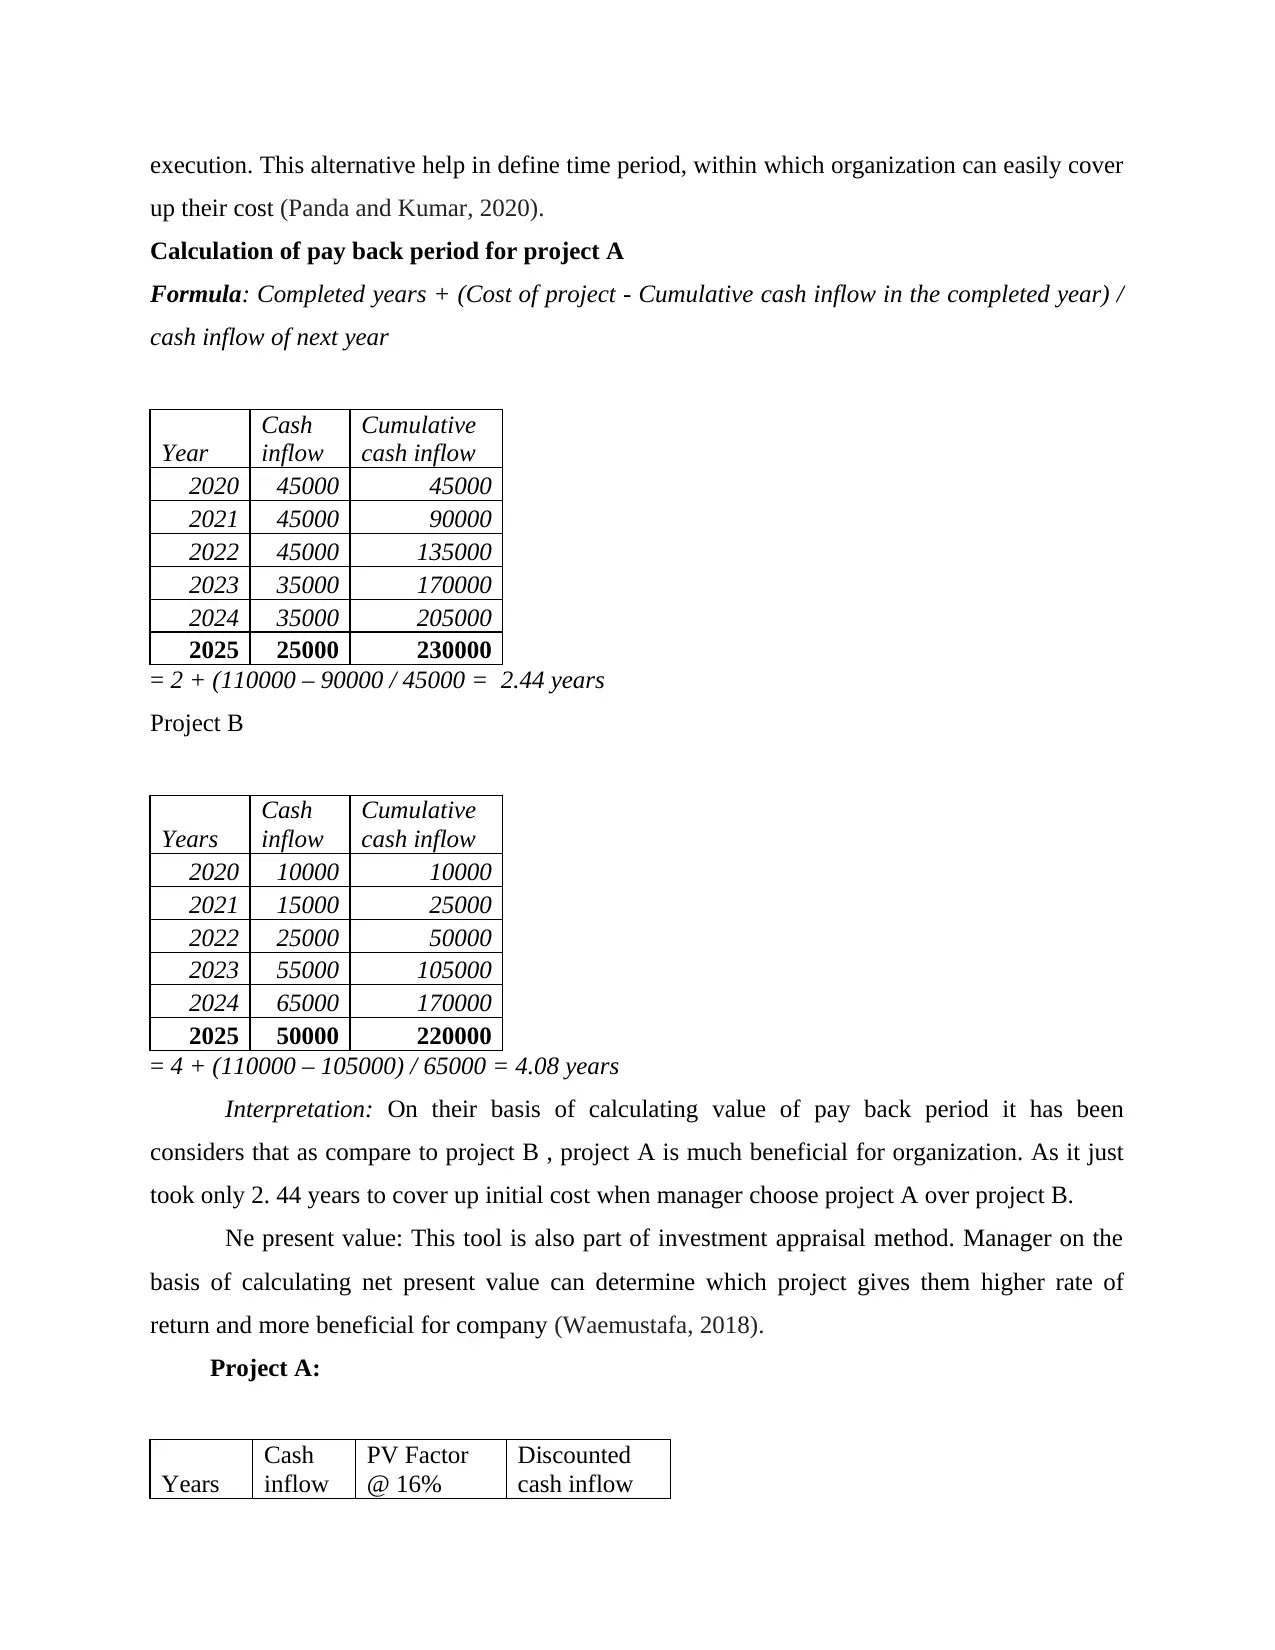
up their cost (Panda and Kumar, 2020).
Calculation of pay back period for project A
Formula: Completed years + (Cost of project - Cumulative cash inflow in the completed year) /
cash inflow of next year
Year
Cash
inflow
Cumulative
cash inflow
2020 45000 45000
2021 45000 90000
2022 45000 135000
2023 35000 170000
2024 35000 205000
2025 25000 230000
= 2 + (110000 – 90000 / 45000 = 2.44 years
Project B
Years
Cash
inflow
Cumulative
cash inflow
2020 10000 10000
2021 15000 25000
2022 25000 50000
2023 55000 105000
2024 65000 170000
2025 50000 220000
= 4 + (110000 – 105000) / 65000 = 4.08 years
Interpretation: On their basis of calculating value of pay back period it has been
considers that as compare to project B , project A is much beneficial for organization. As it just
took only 2. 44 years to cover up initial cost when manager choose project A over project B.
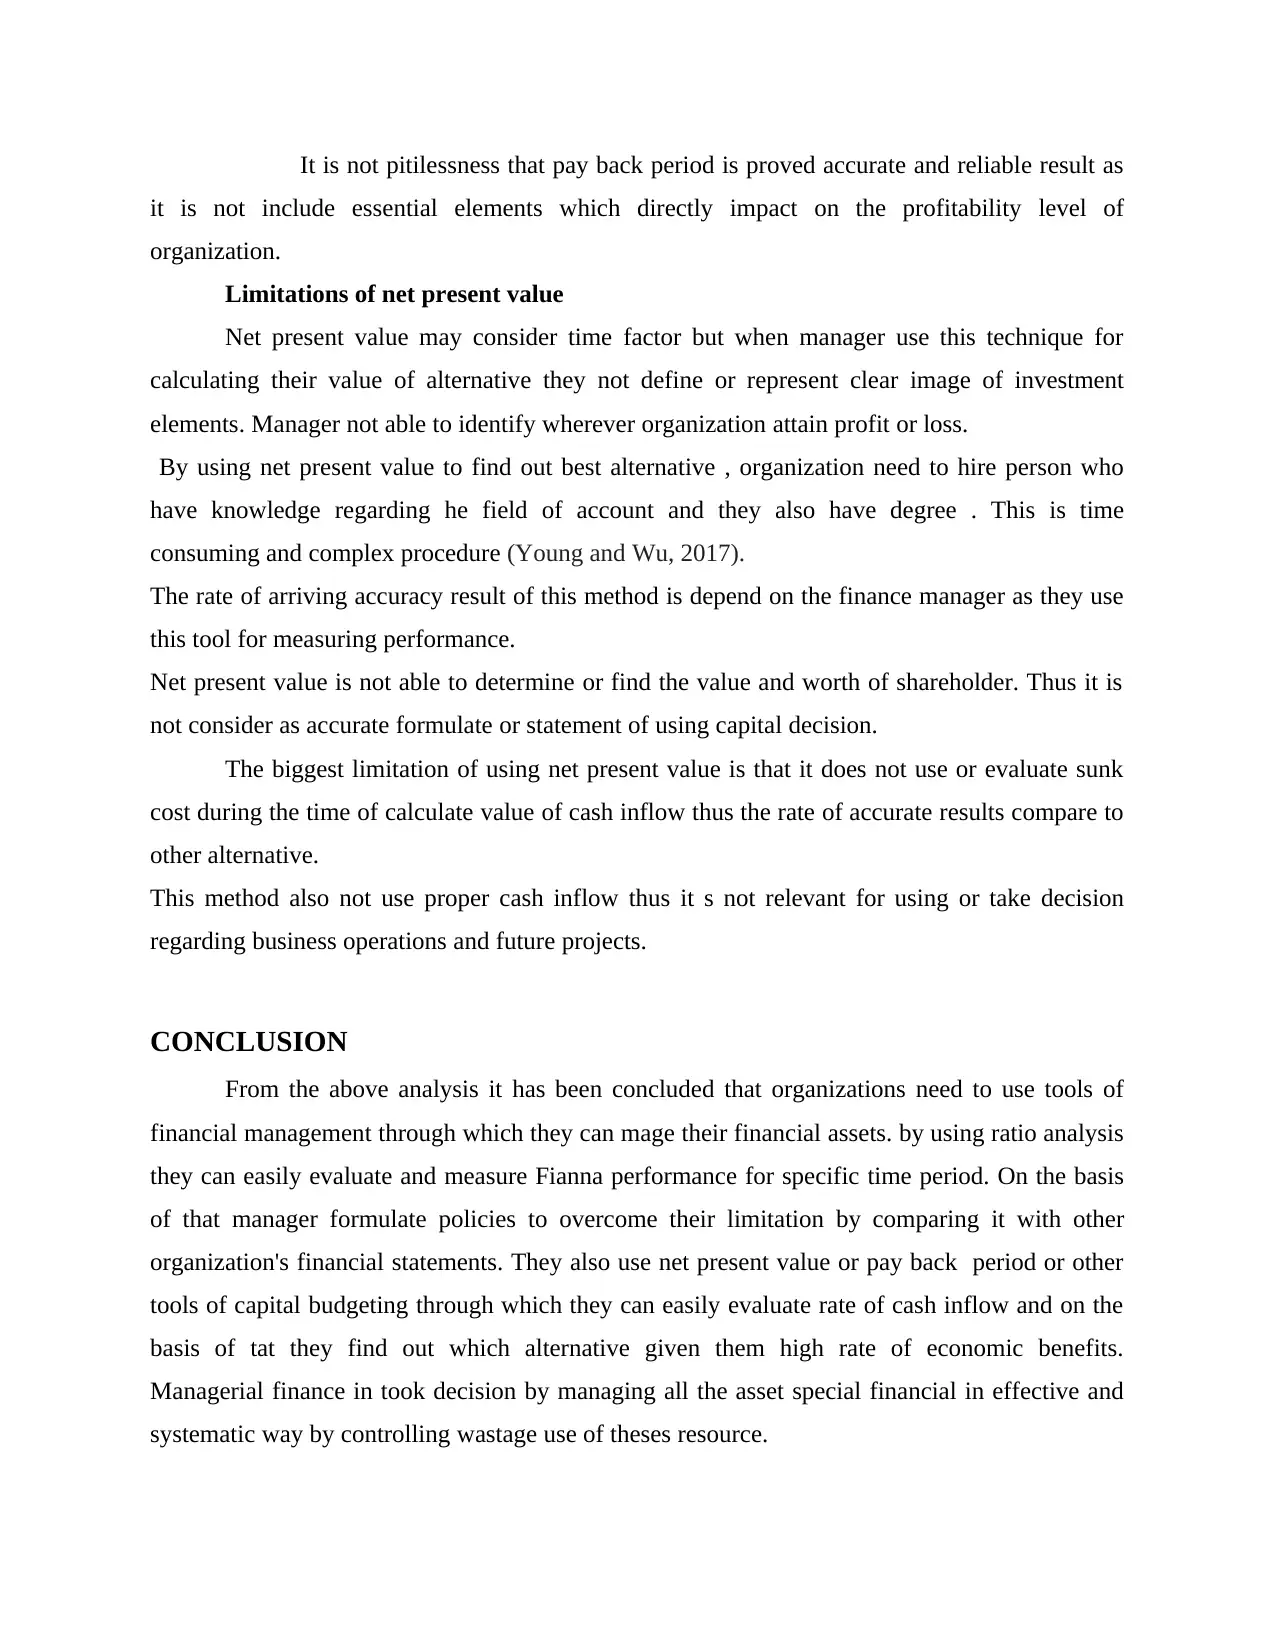
Ne present value: This tool is also part of investment appraisal method. Manager on the
basis of calculating net present value can determine which project gives them higher rate of
return and more beneficial for company (Waemustafa, 2018).
Project A:
Years
Cash
inflow
PV Factor
@ 16%
Discounted
cash inflow
⊘ This is a preview!⊘
Do you want full access?
Subscribe today to unlock all pages.
Trusted by 1+ million students worldwide
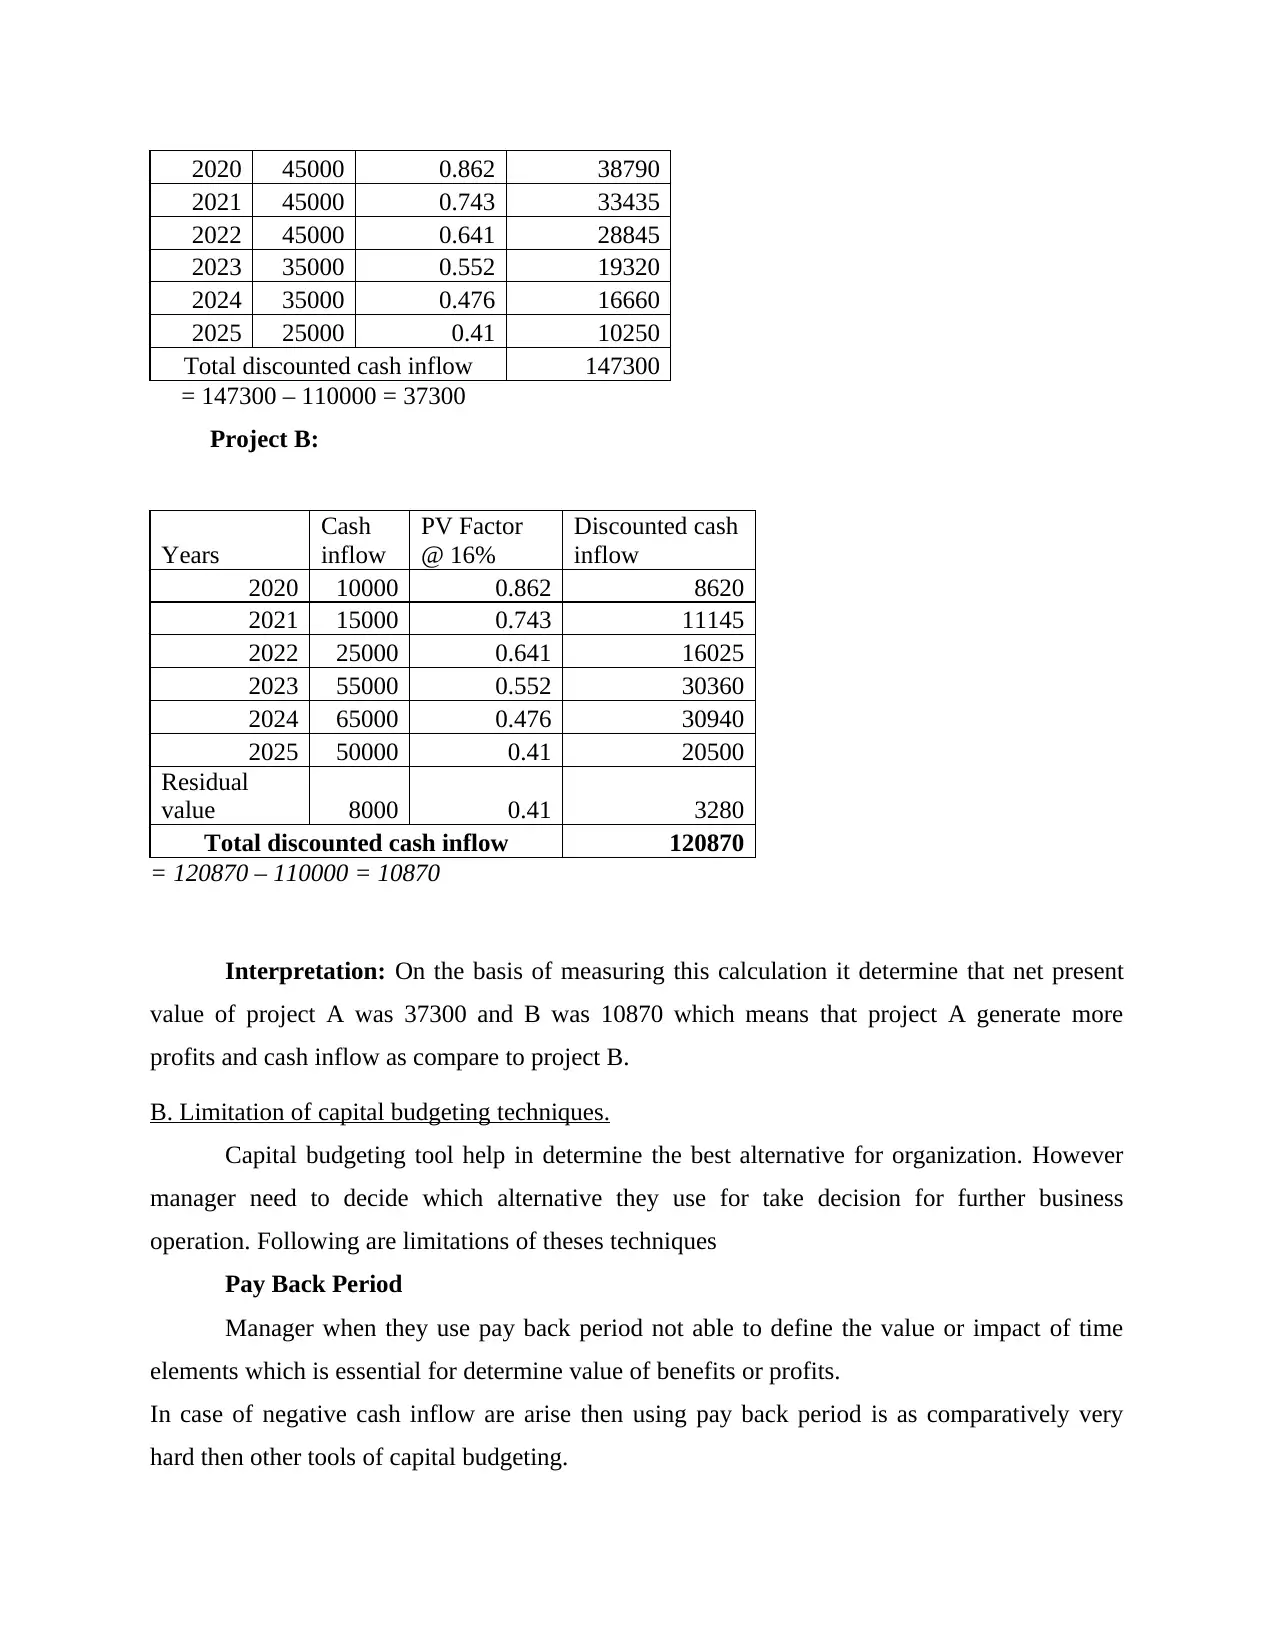
2021 45000 0.743 33435
2022 45000 0.641 28845
2023 35000 0.552 19320
2024 35000 0.476 16660
2025 25000 0.41 10250
Total discounted cash inflow 147300
= 147300 – 110000 = 37300
Project B:
Years
Cash
inflow
PV Factor
@ 16%
Discounted cash
inflow
2020 10000 0.862 8620
2021 15000 0.743 11145
2022 25000 0.641 16025
2023 55000 0.552 30360
2024 65000 0.476 30940
2025 50000 0.41 20500
Residual
value 8000 0.41 3280
Total discounted cash inflow 120870
= 120870 – 110000 = 10870
Interpretation: On the basis of measuring this calculation it determine that net present
value of project A was 37300 and B was 10870 which means that project A generate more
profits and cash inflow as compare to project B.
B. Limitation of capital budgeting techniques.
Capital budgeting tool help in determine the best alternative for organization. However
manager need to decide which alternative they use for take decision for further business
operation. Following are limitations of theses techniques
Pay Back Period
Manager when they use pay back period not able to define the value or impact of time
elements which is essential for determine value of benefits or profits.
In case of negative cash inflow are arise then using pay back period is as comparatively very
hard then other tools of capital budgeting.
Paraphrase This Document
it is not include essential elements which directly impact on the profitability level of
organization.
Limitations of net present value
Net present value may consider time factor but when manager use this technique for
calculating their value of alternative they not define or represent clear image of investment
elements. Manager not able to identify wherever organization attain profit or loss.
By using net present value to find out best alternative , organization need to hire person who
have knowledge regarding he field of account and they also have degree . This is time
consuming and complex procedure (Young and Wu, 2017).
The rate of arriving accuracy result of this method is depend on the finance manager as they use
this tool for measuring performance.
Net present value is not able to determine or find the value and worth of shareholder. Thus it is
not consider as accurate formulate or statement of using capital decision.
The biggest limitation of using net present value is that it does not use or evaluate sunk
cost during the time of calculate value of cash inflow thus the rate of accurate results compare to
other alternative.
This method also not use proper cash inflow thus it s not relevant for using or take decision
regarding business operations and future projects.
CONCLUSION
From the above analysis it has been concluded that organizations need to use tools of
financial management through which they can mage their financial assets. by using ratio analysis
they can easily evaluate and measure Fianna performance for specific time period. On the basis
of that manager formulate policies to overcome their limitation by comparing it with other
organization's financial statements. They also use net present value or pay back period or other
tools of capital budgeting through which they can easily evaluate rate of cash inflow and on the
basis of tat they find out which alternative given them high rate of economic benefits.
Managerial finance in took decision by managing all the asset special financial in effective and
systematic way by controlling wastage use of theses resource.

⊘ This is a preview!⊘
Do you want full access?
Subscribe today to unlock all pages.
Trusted by 1+ million students worldwide
Books and journals
Ahuja, B. R. and Kalra, R., 2020. Impact of macroeconomic variables on corporate capital
structure: a case of India. Managerial Finance.
Bhaumik, P. K., 2016. An appropriate risk addendum for risky projects. Managerial Finance.
Bu, Q., 2020. Mutual Fund Alpha: Is It Managerial or Emotional?. Journal of Behavioral
Finance, pp.1-10.
Ehrlich, J. A. and Potter, J. M., 2020. Is offense worth more than defense and pitching? Marginal
revenue product and revenue sharing in major league baseball. Managerial Finance.
Jaisinghani, D., Kaur, M. and Inamdar, M. M., 2019. Analyzing seasonal anomalies for Israel:
evidence from pre-and post-global financial crisis. Managerial Finance.
Kwon, G. J., 2018. Comparative value relevance of accounting information among Asian
countries. Managerial Finance.
Meng, Y. and Wang, X., 2019. Do institutional investors have homogeneous influence on
corporate social responsibility? Evidence from investor investment horizon. Managerial
Finance.
Musumeci, J. and O’Brien, T., 2019. Lease vs buy: clarifying the impact of tax and borrowing
rates. Managerial Finance.
Nikbakht, E., Shahrokhi, M. and Corriette, A., 2019. Blockchain & distributed financial data.
Managerial Finance.
Panda, B. and Kumar, G., 2020. What matters to ownership structure? Evidence from pre-and
post-global financial crisis in an emerging market. Managerial Finance.
Waemustafa, W., 2018. The paradox of managerial ownership and financial decisions of the
textile sector: An Asian market perspective. Journal of Social Sciences Research. (4).
pp.184-190.
Young, W. and Wu, C. C., 2017. Abnormal investment, changes in institutional ownership, and
SEO long-run performance. Managerial Finance
Related Documents


Your All-in-One AI-Powered Toolkit for Academic Success.
+13062052269
info@desklib.com
Available 24*7 on WhatsApp / Email
![[object Object]](/_next/static/media/star-bottom.7253800d.svg)
© 2024 | Zucol Services PVT LTD | All rights reserved.