Managerial Finance Report: Financial Analysis of Sports Retail Sector

Verified

Added on  2020/07/23

|25
|4524
|39
Report
AI Summary
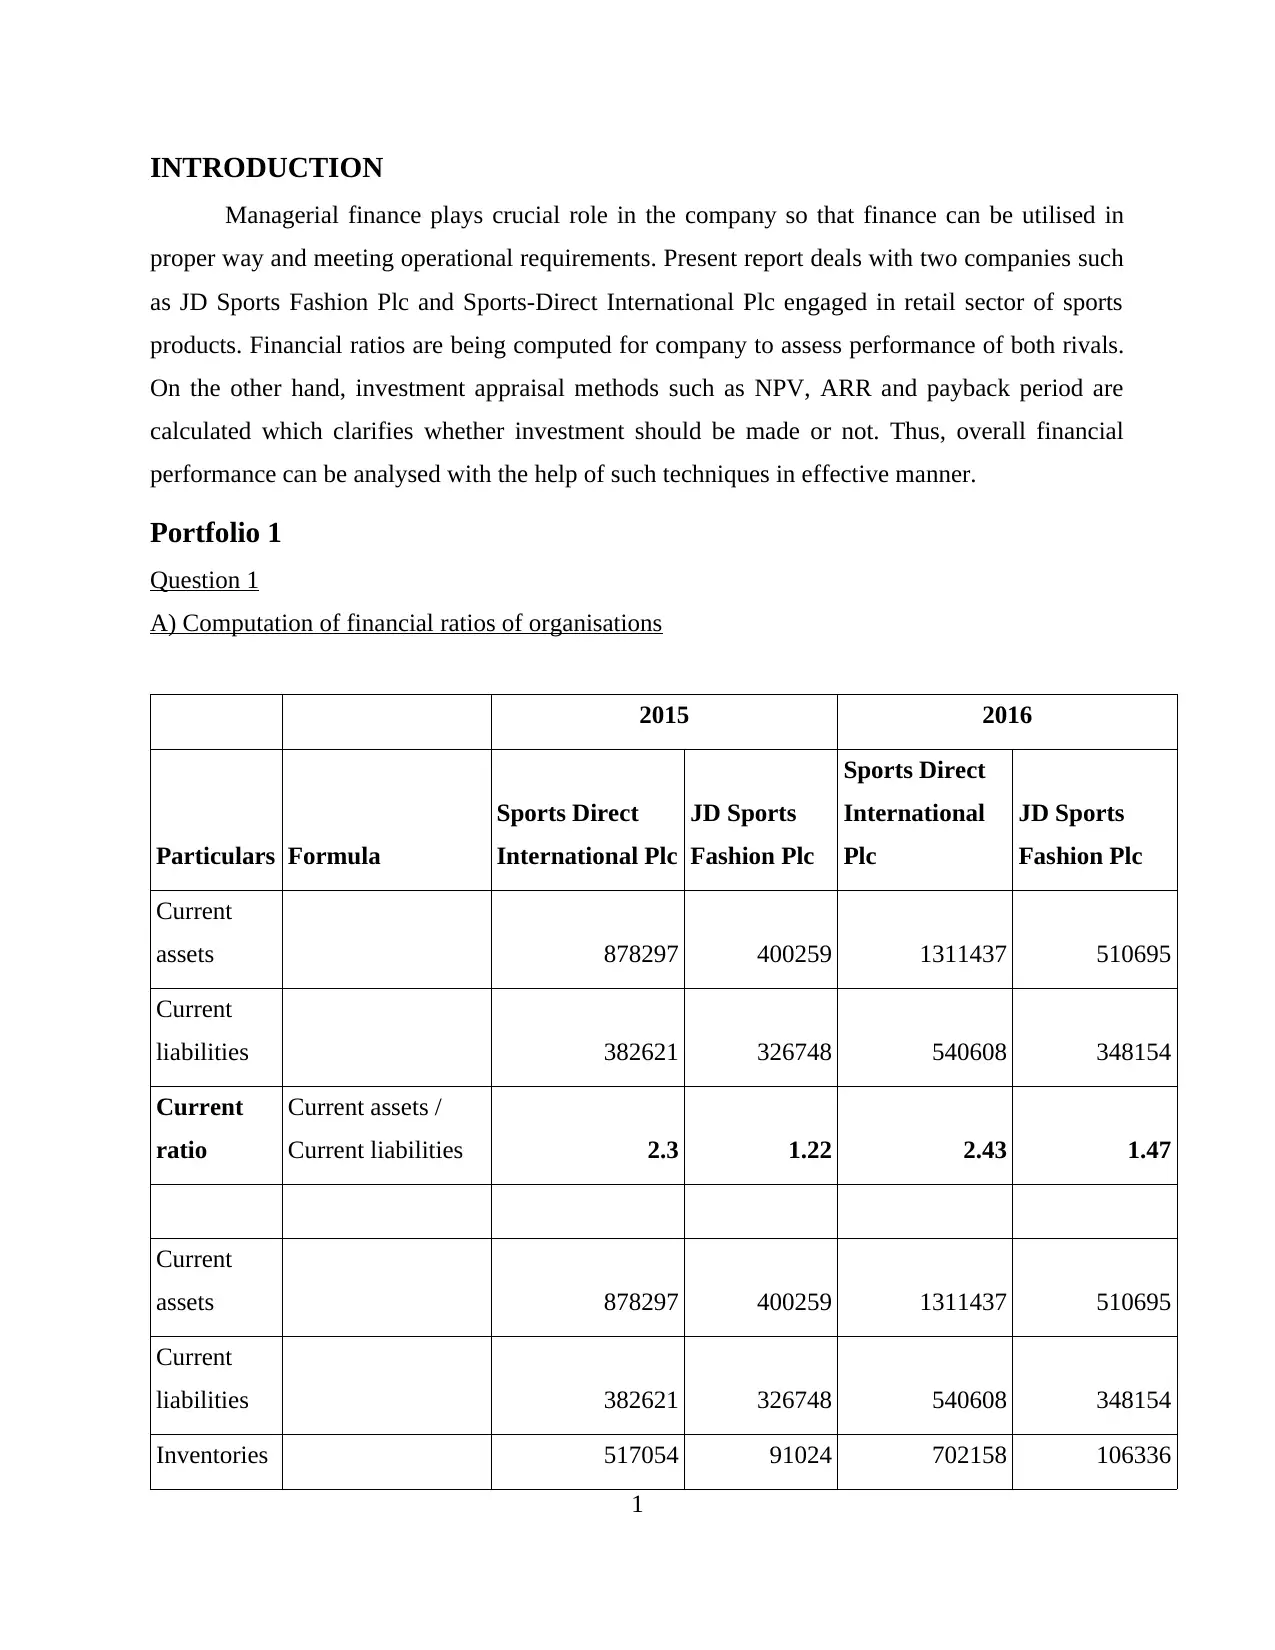
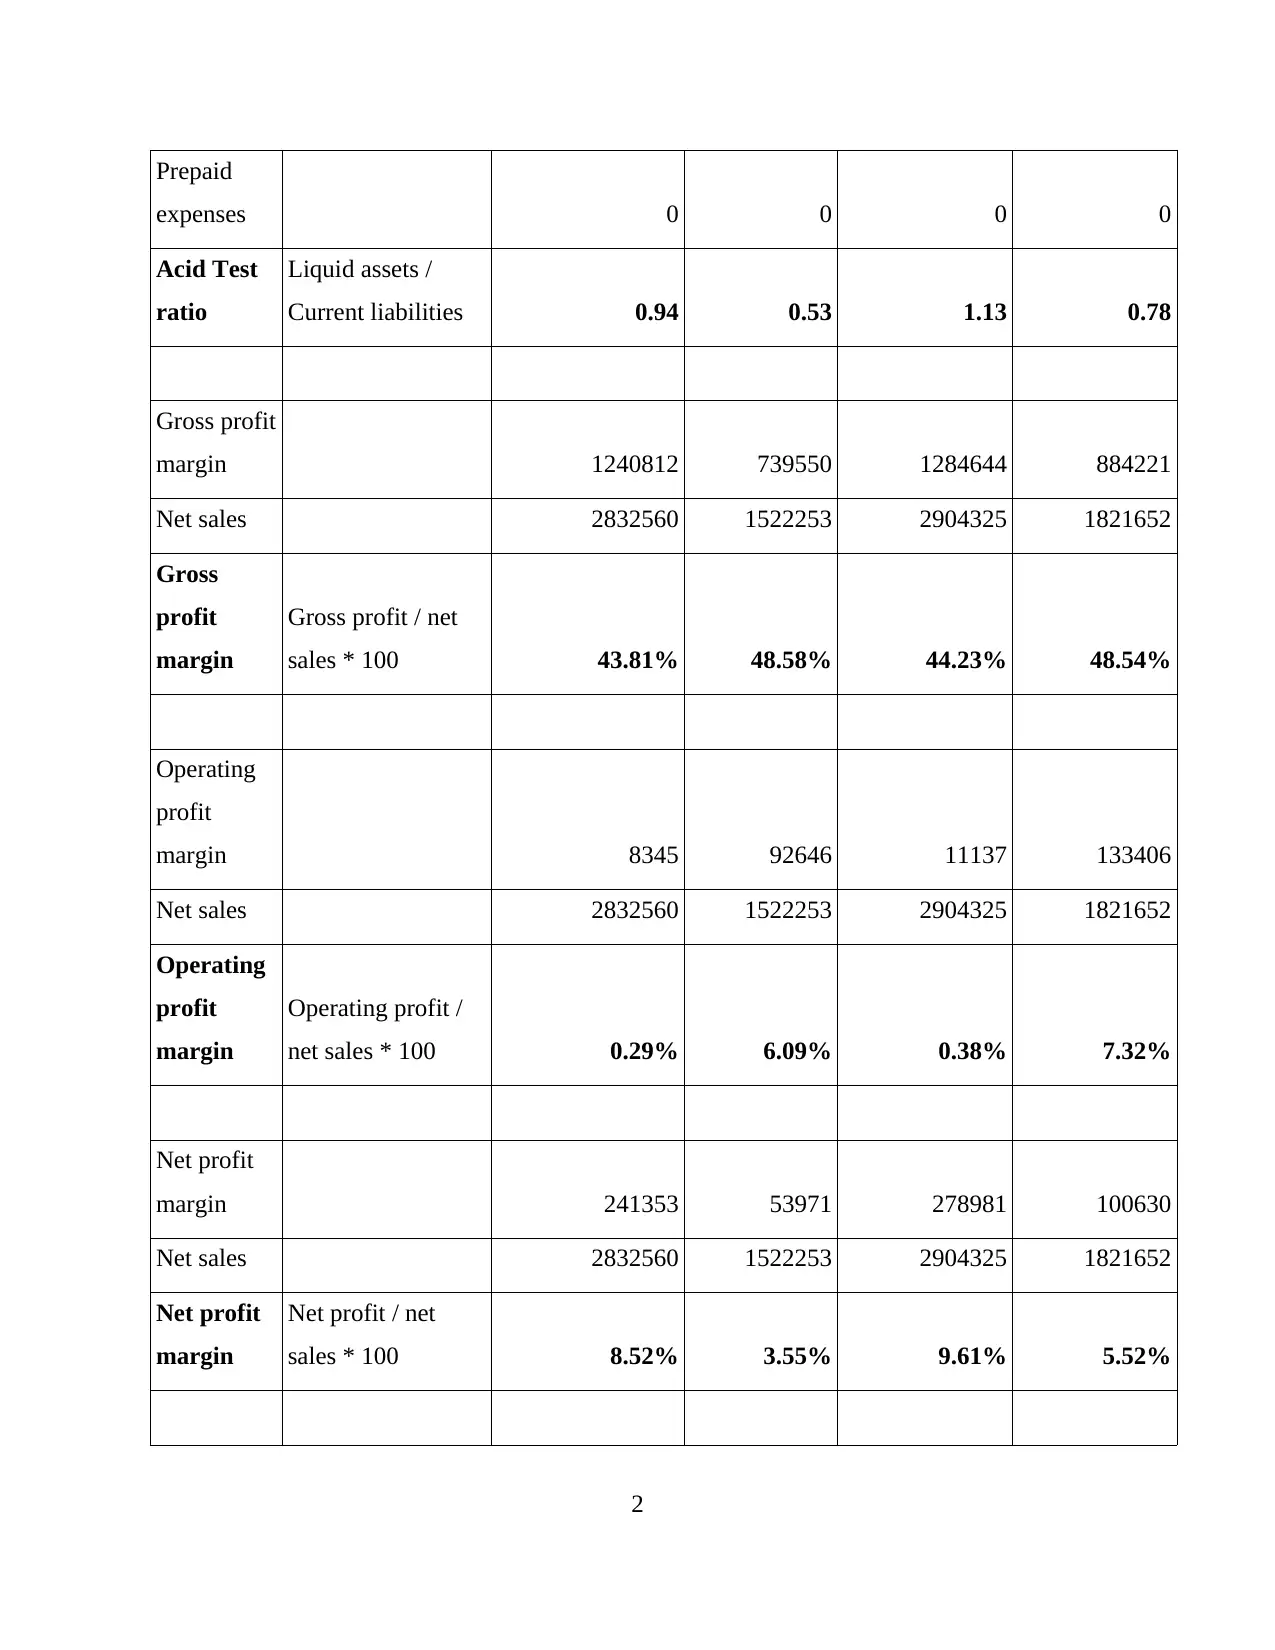
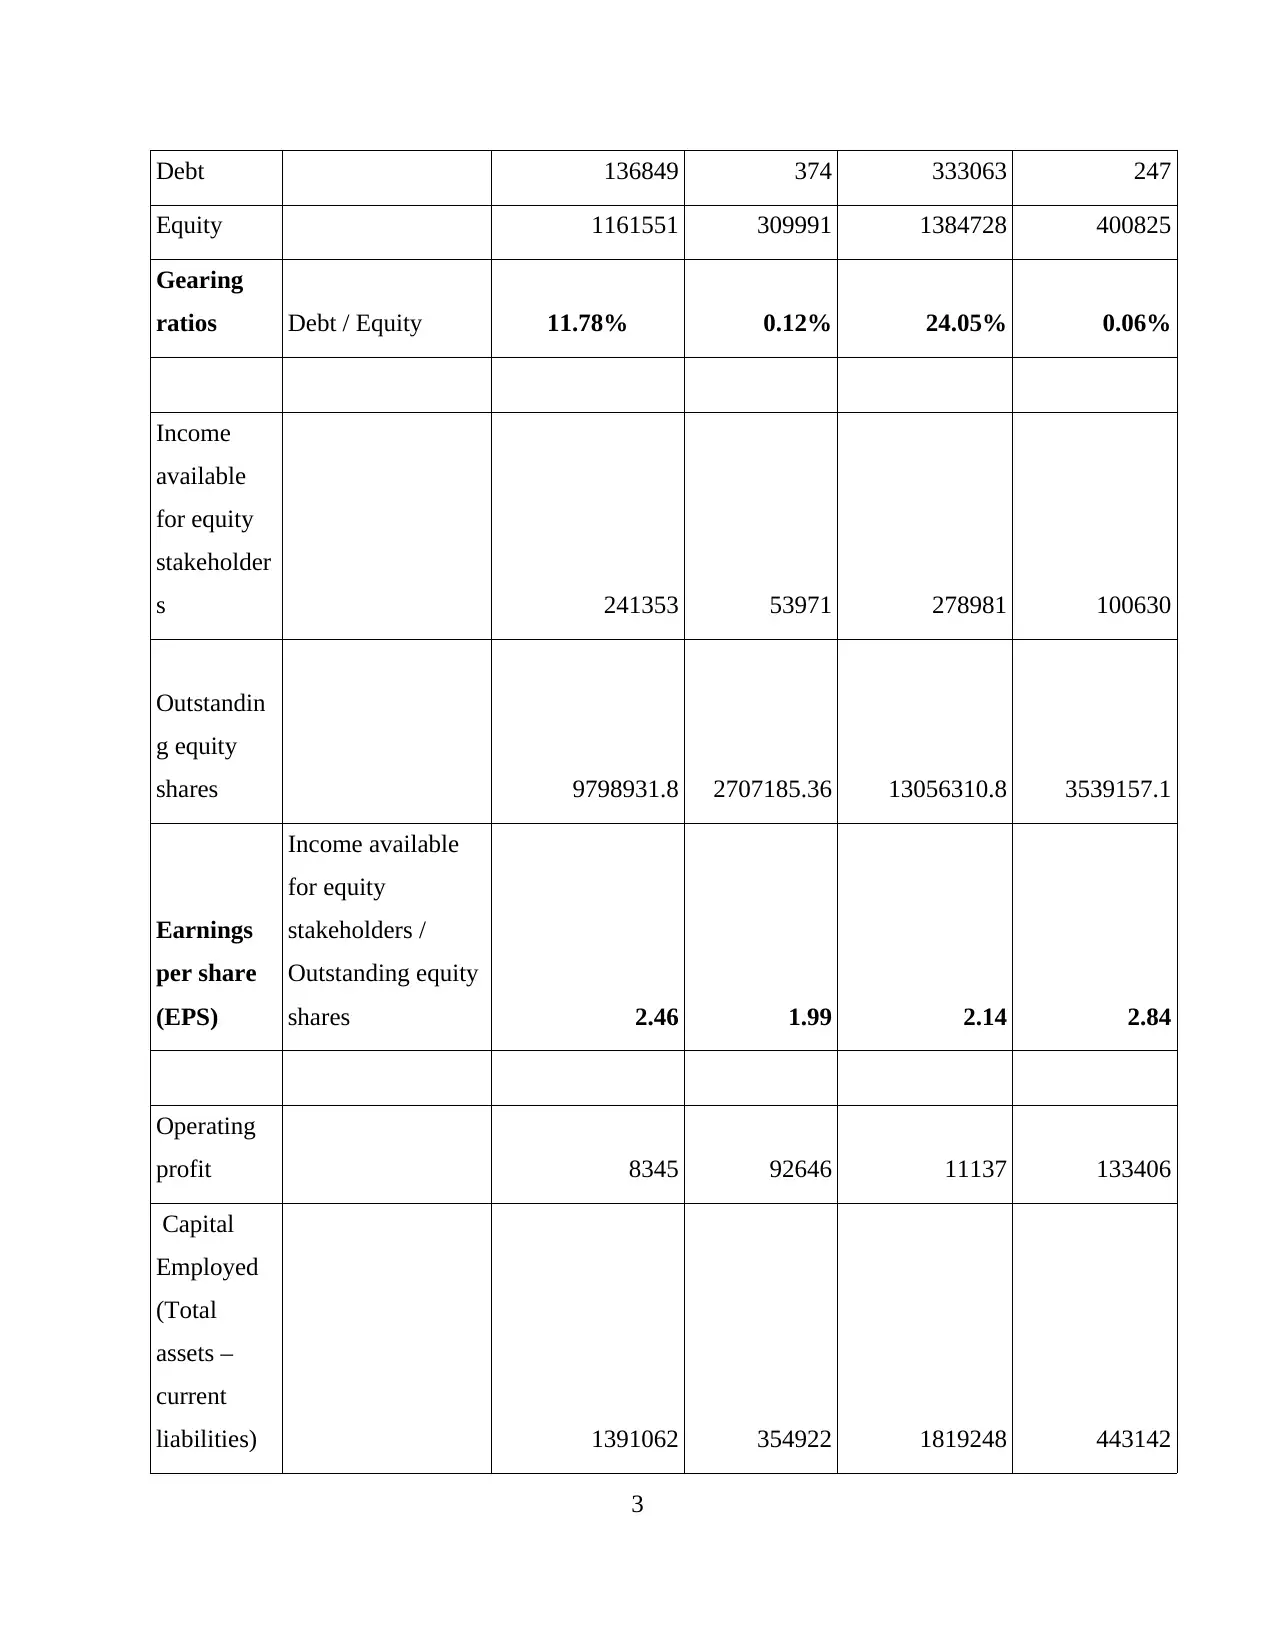
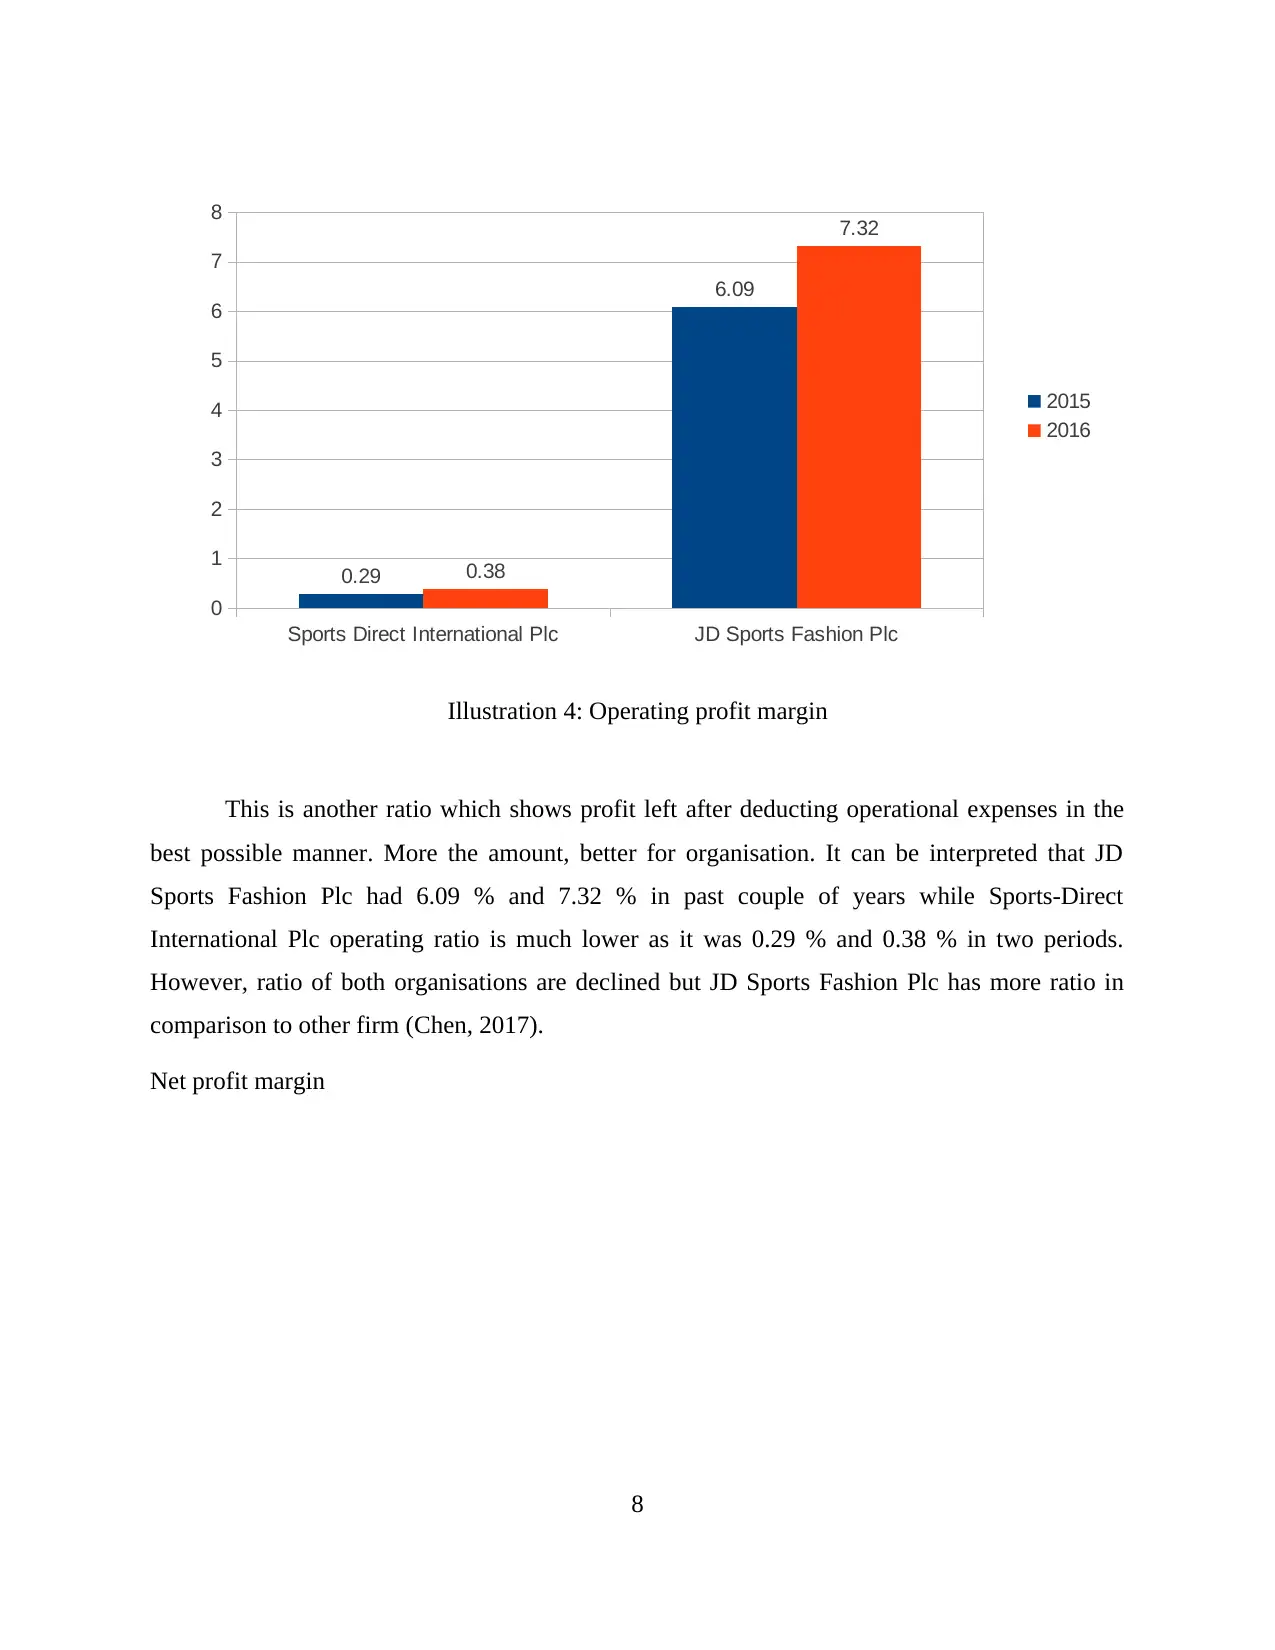
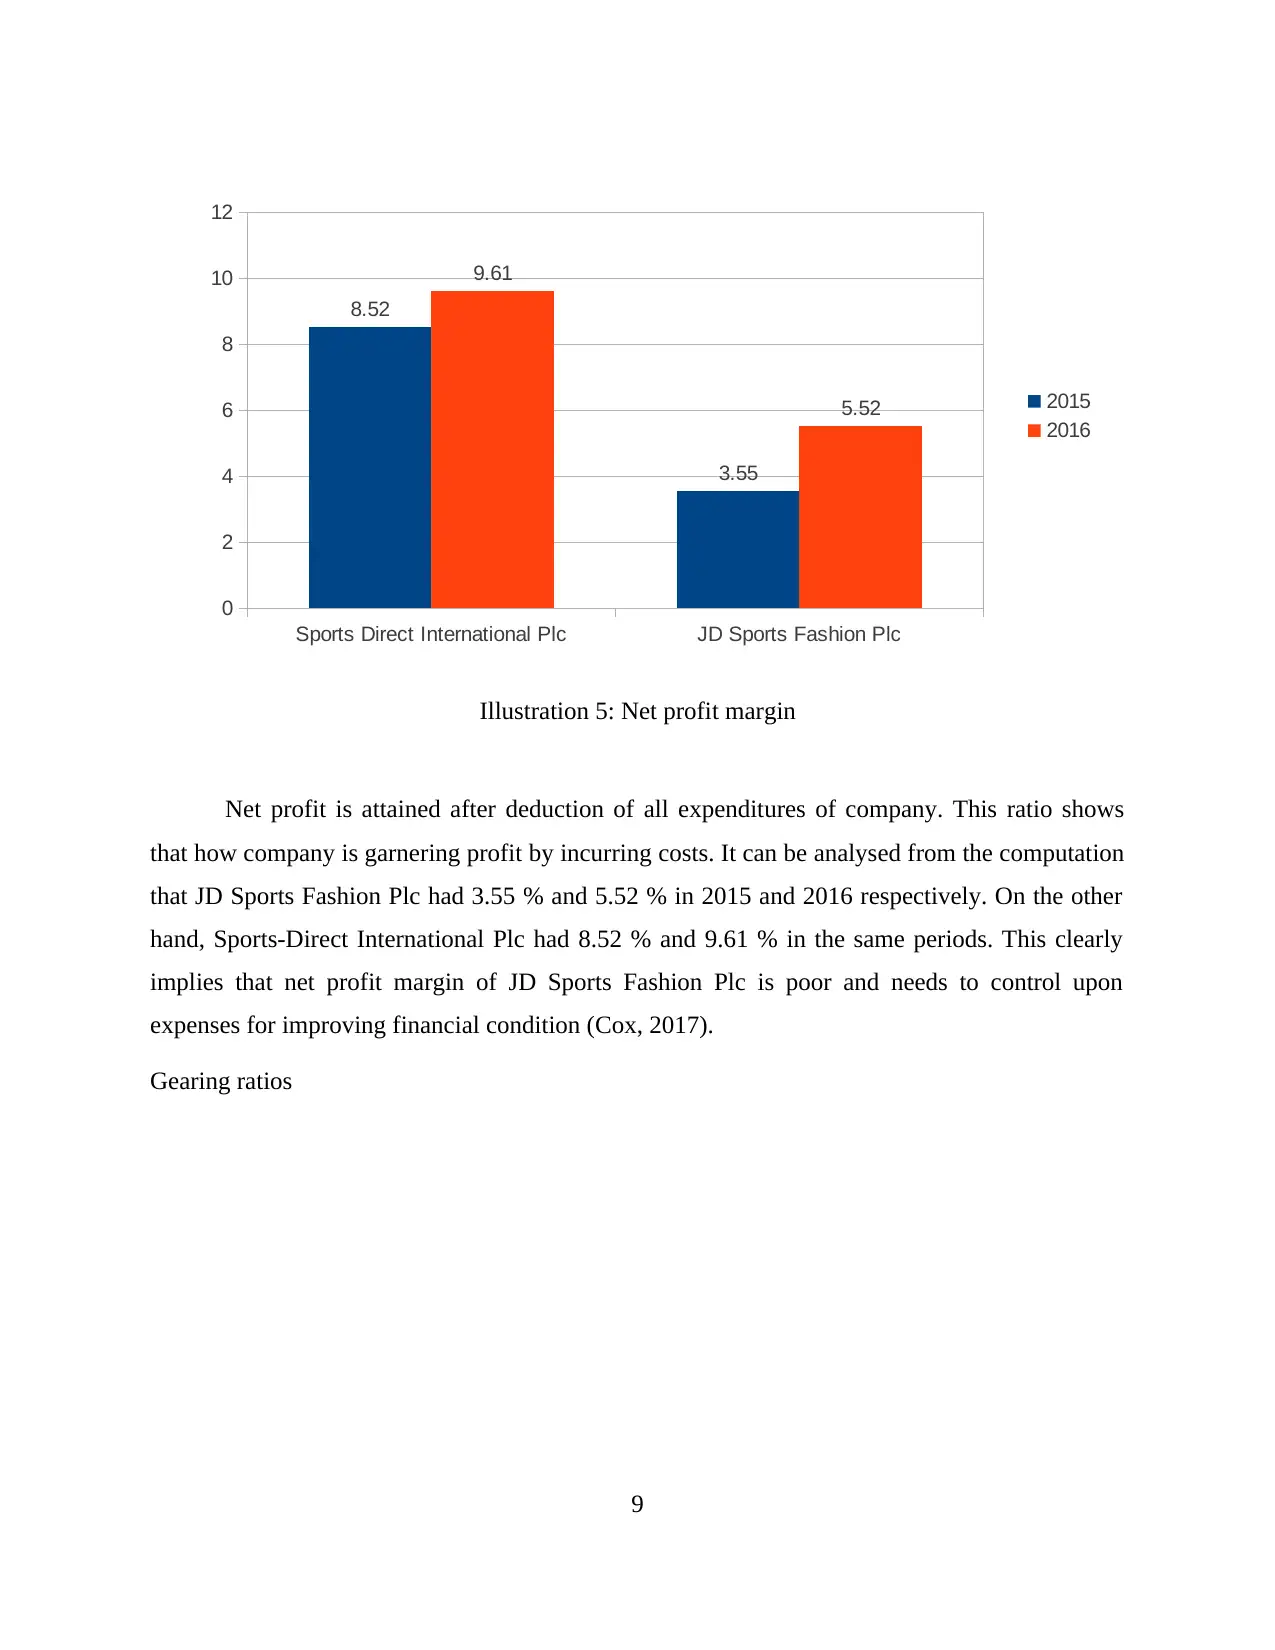
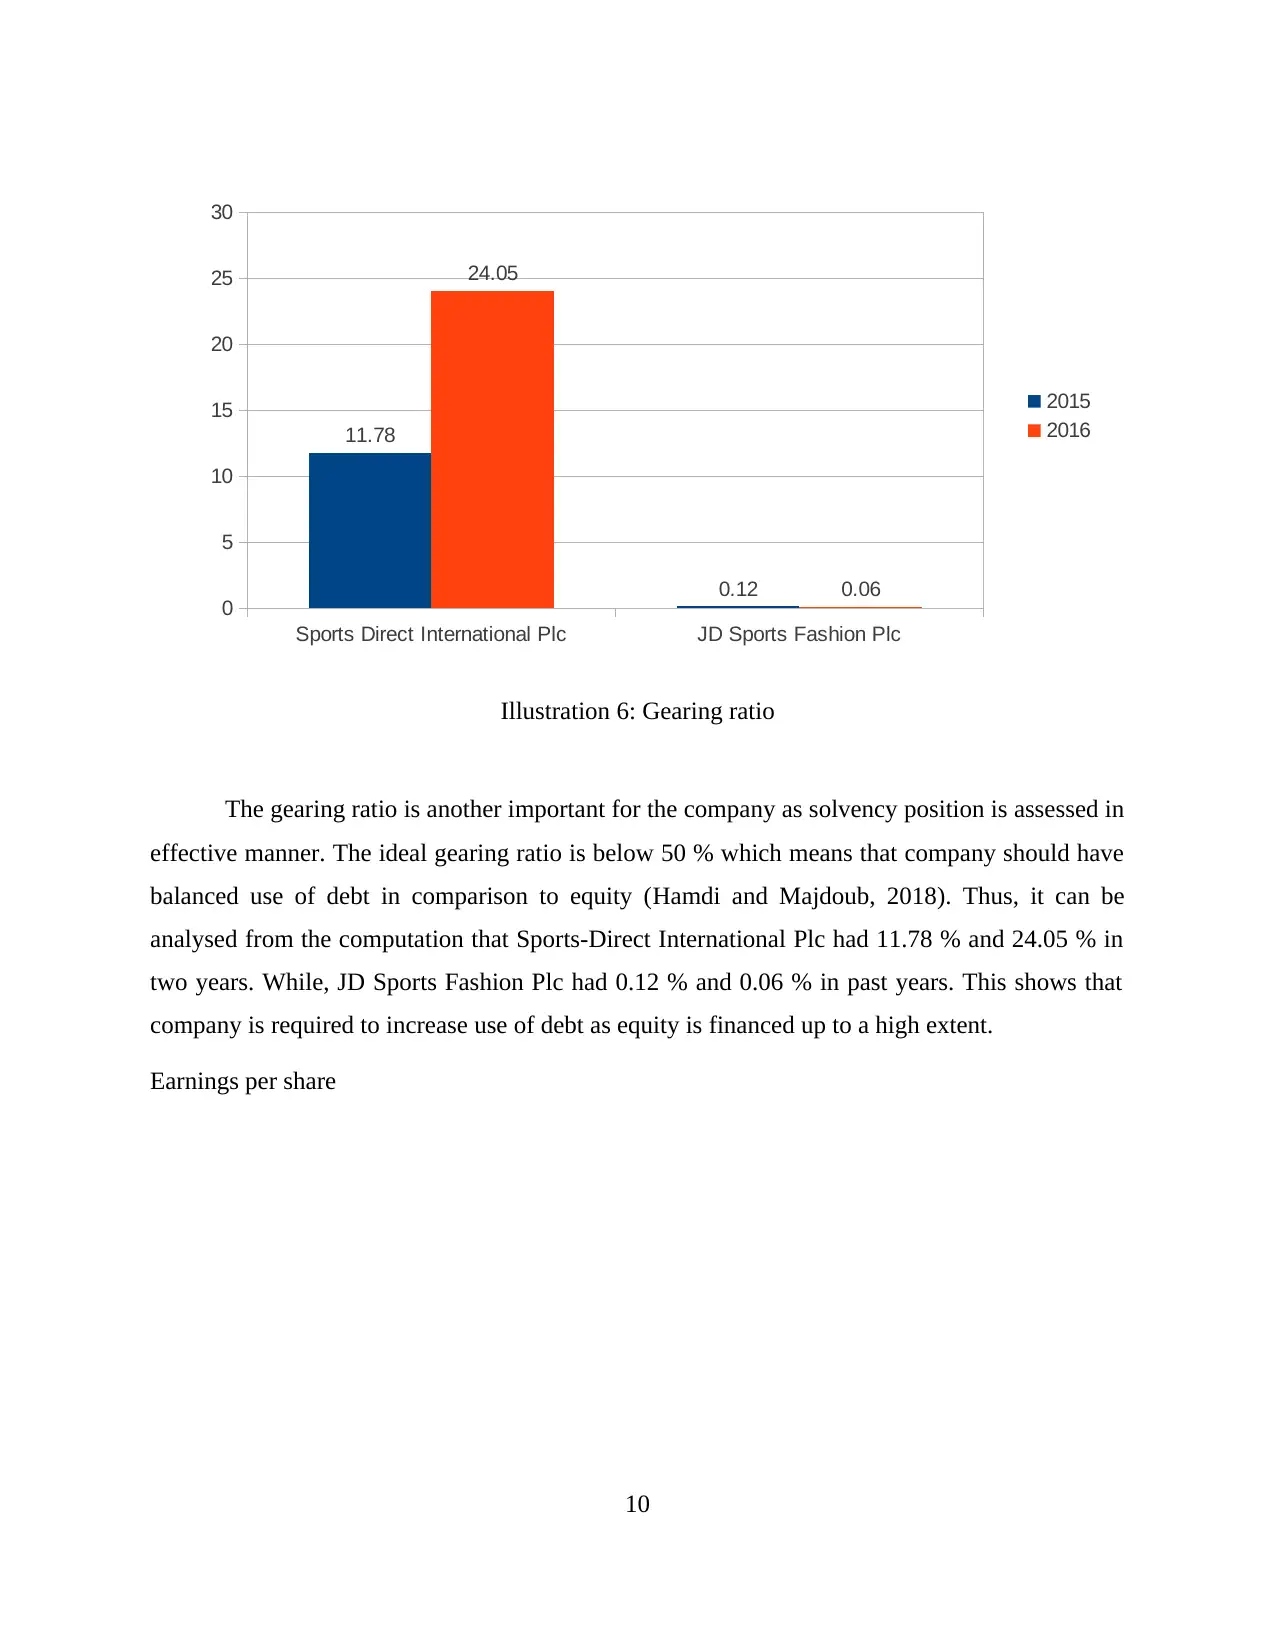
This report delves into managerial finance, focusing on the financial analysis of two prominent sports retail companies: JD Sports Fashion Plc and Sports-Direct International Plc. It begins with a detailed computation of various financial ratios, including current ratio, acid test ratio, gross profit margin, operating profit margin, net profit margin, gearing ratios, earnings per share (EPS), return on capital employed (ROCE), and stock turnover period, for both companies over two years (2015 and 2016). The analysis then interprets these ratios to assess the companies' financial performance, highlighting strengths and weaknesses. Furthermore, the report explores investment appraisal techniques such as Net Present Value (NPV), Average Rate of Return (ARR), and payback period, providing recommendations to management regarding investment decisions. Finally, it discusses the limitations of using financial ratios and investment appraisal methods for long-term decision-making, offering a comprehensive overview of financial analysis within the retail sector.
Document Page
Managerial Finance
tabler-icon-diamond-filled.svg

Paraphrase This Document

Need a fresh take? Get an instant paraphrase of this document with our AI Paraphraser
Document Page
TABLE OF CONTENTS
INTRODUCTION...........................................................................................................................1
Portfolio 1........................................................................................................................................1
Question 1...............................................................................................................................1
A) Computation of financial ratios of organisations..............................................................1
B) Analyse financial performance of companies...................................................................4
C) Suggestions to initiate improvement for poor performing company...............................14
D) Limitations of financial ratios.........................................................................................15
Portfolio 2......................................................................................................................................16
Question 2.............................................................................................................................16
A) Investment appraisal techniques and suggestions to management of entity...................16
B) Limitations of investment appraisal methods to aid in long-term decision-making.......20
CONCLUSION..............................................................................................................................21
REFERENCES..............................................................................................................................22
Document Page
INTRODUCTION
Managerial finance plays crucial role in the company so that finance can be utilised in
proper way and meeting operational requirements. Present report deals with two companies such
as JD Sports Fashion Plc and Sports-Direct International Plc engaged in retail sector of sports
products. Financial ratios are being computed for company to assess performance of both rivals.
On the other hand, investment appraisal methods such as NPV, ARR and payback period are
calculated which clarifies whether investment should be made or not. Thus, overall financial
performance can be analysed with the help of such techniques in effective manner.
Portfolio 1
Question 1
A) Computation of financial ratios of organisations
2015 2016
Particulars Formula
Sports Direct
International Plc
JD Sports
Fashion Plc
Sports Direct
International
Plc
JD Sports
Fashion Plc
Current
assets 878297 400259 1311437 510695
Current
liabilities 382621 326748 540608 348154
Current
ratio
Current assets /
Current liabilities 2.3 1.22 2.43 1.47
Current
assets 878297 400259 1311437 510695
Current
liabilities 382621 326748 540608 348154
Inventories 517054 91024 702158 106336
1
Document Page
Prepaid
expenses 0 0 0 0
Acid Test
ratio
Liquid assets /
Current liabilities 0.94 0.53 1.13 0.78
Gross profit
margin 1240812 739550 1284644 884221
Net sales 2832560 1522253 2904325 1821652
Gross
profit
margin
Gross profit / net
sales * 100 43.81% 48.58% 44.23% 48.54%
Operating
profit
margin 8345 92646 11137 133406
Net sales 2832560 1522253 2904325 1821652
Operating
profit
margin
Operating profit /
net sales * 100 0.29% 6.09% 0.38% 7.32%
Net profit
margin 241353 53971 278981 100630
Net sales 2832560 1522253 2904325 1821652
Net profit
margin
Net profit / net
sales * 100 8.52% 3.55% 9.61% 5.52%
2
tabler-icon-diamond-filled.svg

Paraphrase This Document

Need a fresh take? Get an instant paraphrase of this document with our AI Paraphraser
Document Page
Debt 136849 374 333063 247
Equity 1161551 309991 1384728 400825
Gearing
ratios Debt / Equity 11.78% 0.12% 24.05% 0.06%
Income
available
for equity
stakeholder
s 241353 53971 278981 100630
Outstandin
g equity
shares 9798931.8 2707185.36 13056310.8 3539157.1
Earnings
per share
(EPS)
Income available
for equity
stakeholders /
Outstanding equity
shares 2.46 1.99 2.14 2.84
Operating
profit 8345 92646 11137 133406
Capital
Employed
(Total
assets –
current
liabilities) 1391062 354922 1819248 443142
3
Document Page
Return on
capital
employed
(ROCE)
Operating profit /
Capital Employed 0.60% 26.10% 0.61% 30.10%
Cost of
Sales 1591748 782703 1619681 937431
Average
stock 517054 91024 702158 106336
Stock
turnover
period
Cost of Sales /
Average stock 119 days 43 days 158 days 41 days
Dividend
paid 0 13260 0 13820
Net income
available to
equity
shareholder
s 241353 53971 278981 100630
Dividend
payout
ratios
Dividends / Net
income available to
equity shareholders 0.00% 24.57% 0.00% 13.73%
B) Analyse financial performance of companies
Financial ratios are quite helpful in determining performance of the company in that way
by which improvement if any required can be made by interpreting results in the best possible
manner (Arena and Ferris, 2017). It can be said that computation of ratios are beneficial for
4
Document Page
organisation so that necessary improvements may be easily done and as such, financial condition
can be enhanced with much ease. In relation to this, financial ratios for JD Sports Plc and Sports-
Direct International Plc have been calculated for the period of two years ie 2015 and 2016.
Current ratio
Current ratio of both companies have been computed for two periods. It shows how much
assets company has to effectively fulfil liabilities which becomes liquid within one year. Thus,
short-term liabilities are to be paid from the current assets. The ideal current ratio is 2 : 1 as
recommended by the market experts. It can be analysed that JD Sports Fashion Plc had 1.22 and
1.47 respectively in financial years 2015 and 2016. On the other hand, current ratio of Sports-
Direct International Plc had 2.3 and 2.43 in past two years. It clearly shows that Sports-Direct
International Plc has effective ratio which is more than ideal one as well. JD Sports Fashion Plc
has to improve upon its current ratio so that liabilities can be met within time frame.
Acid Test ratio
5
Sports Direct International Plc JD Sports Fashion Plc
0
0.5
1
1.5
2
2.5
3
2.3 2.43
1.22
1.47 2015
2016
Illustration 1: Current ratio
tabler-icon-diamond-filled.svg

Paraphrase This Document

Need a fresh take? Get an instant paraphrase of this document with our AI Paraphraser
Document Page
Acid Test ratio is further extension of above discussed ratio as it implies whether
liabilities can be paid within extreme liquid assets falling in one year. Here, extreme liquid assets
means that by subtracting prepaid expenses and inventories from current assets. Thus, residual
left after such subtraction is known as liquid assets. It can be interpreted that JD Sports Fashion
Plc has 0.53 and 0.78 ratio in both years. While, other organisation has 0.94 and 1.13 in 2015 and
2016. It shows that JD Sports Fashion Plc has to improve upon acid test ratio (Jackowicz,
Mielcarz and Wnuczak, 2017).
Gross Profit margin
6
Sports Direct International Plc JD Sports Fashion Plc
0
0.2
0.4
0.6
0.8
1
1.2
0.94
0.53
1.13
0.78
2015
2016
Illustration 2: Acid test ratio
Document Page
This is a ratio that pertains to profitability aspect of the population in effective way.
Gross profit margin shows whether company has enough gross margin after reducing cost of
sales from revenue. If expenses are more than it is required to initiate control over the same so
that desired profit can be attained. It can be interpreted that Sports-Direct International Plc had
43.81 % in 2015 and 44.23 % in next year. On the other hand, JD Sports Fashion Plc had 48.58%
and 48.54 % in two years respectively (Diltz and Rakowski, 2018). This shows that latter
company has effective gross profit margin. While, former organisation has to reduce
expenditures for attaining more income.
Operating profit margin
7
Sports Direct International Plc JD Sports Fashion Plc
41
42
43
44
45
46
47
48
49
43.81
48.58
44.23
48.54
2015
2016
Illustration 3: Gross profit margin
Document Page
This is another ratio which shows profit left after deducting operational expenses in the
best possible manner. More the amount, better for organisation. It can be interpreted that JD
Sports Fashion Plc had 6.09 % and 7.32 % in past couple of years while Sports-Direct
International Plc operating ratio is much lower as it was 0.29 % and 0.38 % in two periods.
However, ratio of both organisations are declined but JD Sports Fashion Plc has more ratio in
comparison to other firm (Chen, 2017).
Net profit margin
8
Sports Direct International Plc JD Sports Fashion Plc
0
1
2
3
4
5
6
7
8
0.29
6.09
0.38
7.32
2015
2016
Illustration 4: Operating profit margin
tabler-icon-diamond-filled.svg

Paraphrase This Document

Need a fresh take? Get an instant paraphrase of this document with our AI Paraphraser
Document Page
Net profit is attained after deduction of all expenditures of company. This ratio shows
that how company is garnering profit by incurring costs. It can be analysed from the computation
that JD Sports Fashion Plc had 3.55 % and 5.52 % in 2015 and 2016 respectively. On the other
hand, Sports-Direct International Plc had 8.52 % and 9.61 % in the same periods. This clearly
implies that net profit margin of JD Sports Fashion Plc is poor and needs to control upon
expenses for improving financial condition (Cox, 2017).
Gearing ratios
9
Sports Direct International Plc JD Sports Fashion Plc
0
2
4
6
8
10
12
8.52
3.55
9.61
5.52 2015
2016
Illustration 5: Net profit margin
Document Page
The gearing ratio is another important for the company as solvency position is assessed in
effective manner. The ideal gearing ratio is below 50 % which means that company should have
balanced use of debt in comparison to equity (Hamdi and Majdoub, 2018). Thus, it can be
analysed from the computation that Sports-Direct International Plc had 11.78 % and 24.05 % in
two years. While, JD Sports Fashion Plc had 0.12 % and 0.06 % in past years. This shows that
company is required to increase use of debt as equity is financed up to a high extent.
Earnings per share
10
Sports Direct International Plc JD Sports Fashion Plc
0
5
10
15
20
25
30
11.78
0.12
24.05
0.06
2015
2016
Illustration 6: Gearing ratio
chevron_up_icon
1 out of 25
circle_padding
hide_on_mobile
zoom_out_icon
[object Object]