logo

Managerial Finance: Performance Analysis and Recommendations

19 Pages3763 Words97 Views
   

Added on  2023-01-05

About This Document

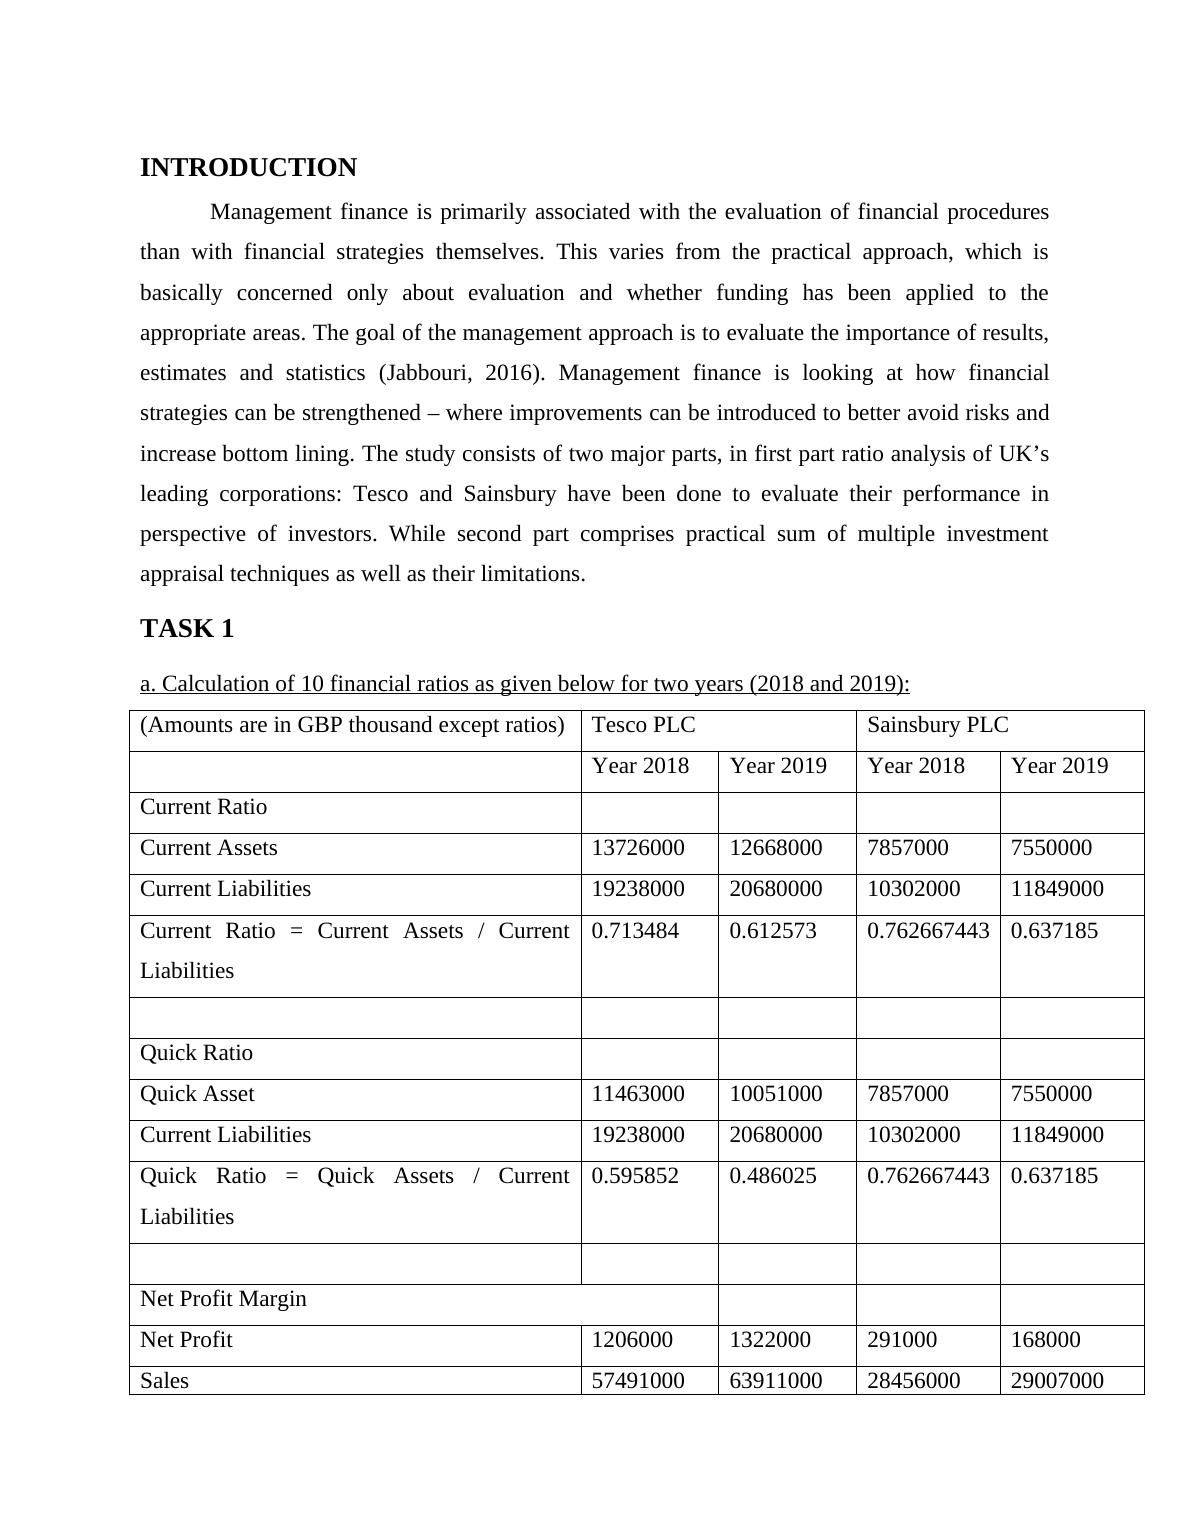
This document provides an analysis of the performance, financial position, and investment potential of Tesco and Sainsbury in managerial finance. It includes calculations of financial ratios for both companies, such as current ratio, quick ratio, net profit margin, gross profit margin, gearing ratio, P/E ratio, EPS, ROCE, average stock turnover period, and dividend pay-out ratio. The analysis reveals that Sainsbury has a stronger liquidity position, while Tesco has higher profitability and dividend pay-outs. Recommendations are provided for both companies to improve their financial performance. The document also discusses the limitations of relying solely on financial ratios for analysis.

Managerial Finance: Performance Analysis and Recommendations

   Added on 2023-01-05

ShareRelated Documents
Managerial Finance
Managerial Finance: Performance Analysis and Recommendations_1
Contents
INTRODUCTION...........................................................................................................................3
TASK 1............................................................................................................................................3
a. Calculate 10 financial ratios as given below for two years (2018 and 2019):....................3
b. Analyse performance, financial position and investment potential of both companies:....5
c. Provide recommendations:...............................................................................................11
d. Limitations of relying on financial ratios.........................................................................12
TASK 2..........................................................................................................................................13
a. Investment appraisal techniques:......................................................................................13
b. Limitations of using investment appraisal techniques in long term decision making:.....15
CONCLUSION..............................................................................................................................18
REFERENCES..............................................................................................................................19
Managerial Finance: Performance Analysis and Recommendations_2
INTRODUCTION
Management finance is primarily associated with the evaluation of financial procedures
than with financial strategies themselves. This varies from the practical approach, which is
basically concerned only about evaluation and whether funding has been applied to the
appropriate areas. The goal of the management approach is to evaluate the importance of results,
estimates and statistics (Jabbouri, 2016). Management finance is looking at how financial
strategies can be strengthened – where improvements can be introduced to better avoid risks and
increase bottom lining. The study consists of two major parts, in first part ratio analysis of UK’s
leading corporations: Tesco and Sainsbury have been done to evaluate their performance in
perspective of investors. While second part comprises practical sum of multiple investment
appraisal techniques as well as their limitations.
TASK 1
a. Calculation of 10 financial ratios as given below for two years (2018 and 2019):
(Amounts are in GBP thousand except ratios) Tesco PLC Sainsbury PLC
Year 2018 Year 2019 Year 2018 Year 2019
Current Ratio
Current Assets 13726000 12668000 7857000 7550000
Current Liabilities 19238000 20680000 10302000 11849000
Current Ratio = Current Assets / Current
Liabilities
0.713484 0.612573 0.762667443 0.637185
Quick Ratio
Quick Asset 11463000 10051000 7857000 7550000
Current Liabilities 19238000 20680000 10302000 11849000
Quick Ratio = Quick Assets / Current
Liabilities
0.595852 0.486025 0.762667443 0.637185
Net Profit Margin
Net Profit 1206000 1322000 291000 168000
Sales 57491000 63911000 28456000 29007000
Managerial Finance: Performance Analysis and Recommendations_3
Net Profit Margin = Net Profit / Sales *100 2.09772 2.068502 1.022631431 0.579171
Gross Profit Margin
Gross Profit 3350000 4144000 544000 620000
Sales 57491000 63911000 28456000 29007000
Gross Profit Margin = Gross Profit / Sales
*100
5.826999 6.484017 1.911723362 2.137415
Gearing ratios
Long term Liabilities 15144000 13509000 2552000 7607000
Capital Employed 10480000 14858000 7411000 7782000
Gearing Ratio = Long term Liabilities / CE *
100
144.5038 90.92072 34.44 97.75
P/E ratio
Price 197.4 255.1 260 229.2
Earning per Share 0.44 0.39 12.54 6.79
PE Ratio = Price / EPS 448.6364 654.1026 20.73365231 33.75552
Earnings per share
Total net profit 1206000 1322000 291000 168000
Total no. of outstanding shares 2731000 3253000 243700 245700
EPS = Net Profit / Total no. outstanding
shares
0.441596 0.406394 1.194091096 0.683761
Return on capital employed
EBIT 1564000 2077000 544000 620000
CE 10480000 14858000 7411000 7782000
ROCE = EBIT / CE 14.92366 13.979 7.340439887 7.967104
Managerial Finance: Performance Analysis and Recommendations_4

End of preview

Want to access all the pages? Upload your documents or become a member.

Related Documents
Management Finance: Performance Analysis of Tesco and Sainsbury
|19
|4018
|53

Managerial Finance: Analysis of Financial Ratios and Investment Potential
|18
|3489
|2

Financial Management: Analysis and Evaluation of Two Companies
|19
|3889
|55

Managerial Finance: Analysis of Financial Ratios for Tesco and Sainsbury
|19
|3821
|42

Managerial Finance: Analysis of Tesco and Sainsbury's Financial Ratios
|19
|3832
|83

Managerial Finance: Analysis of Tesco & Sainsbury's Financial Performance
|15
|3727
|69