LSBM203 Managerial Finance: Investment Portfolio & Financial Analysis
VerifiedAdded on 2022/12/30
|23
|3962
|24
Report
AI Summary
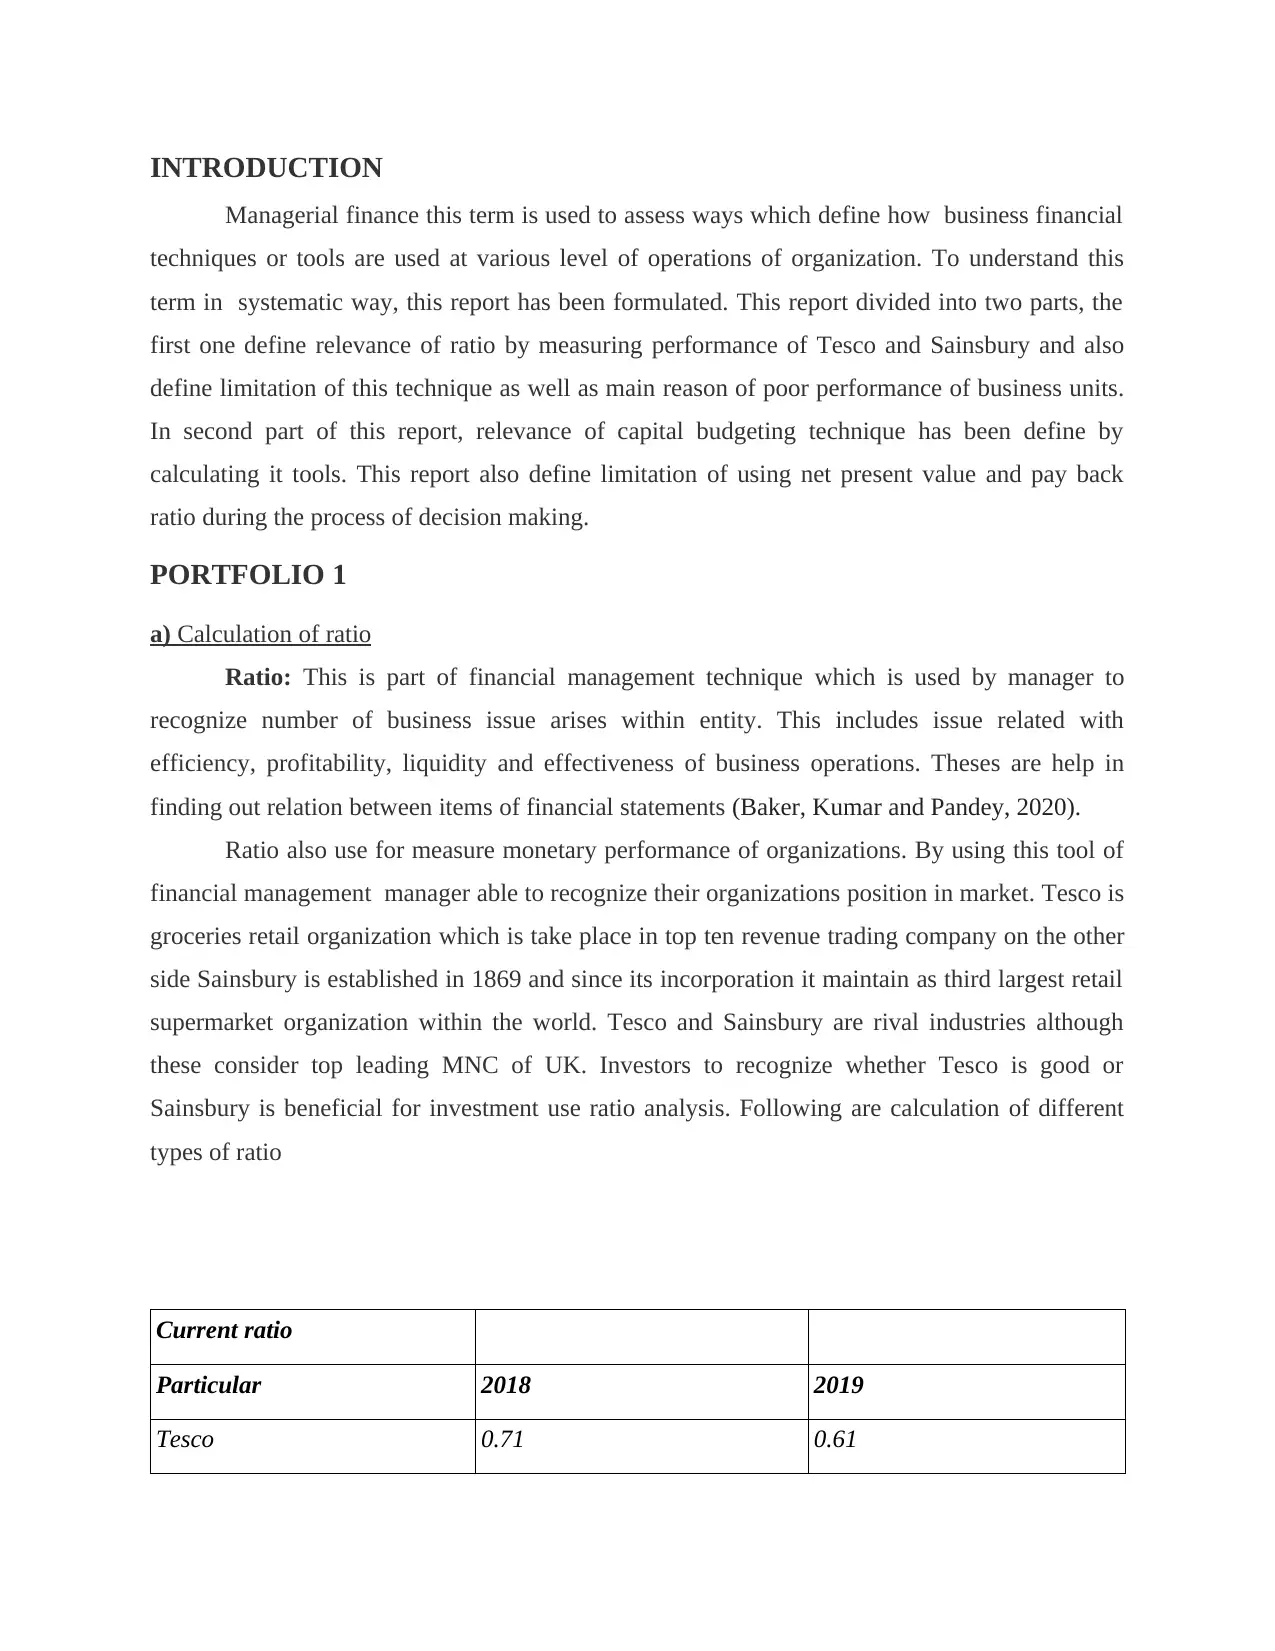
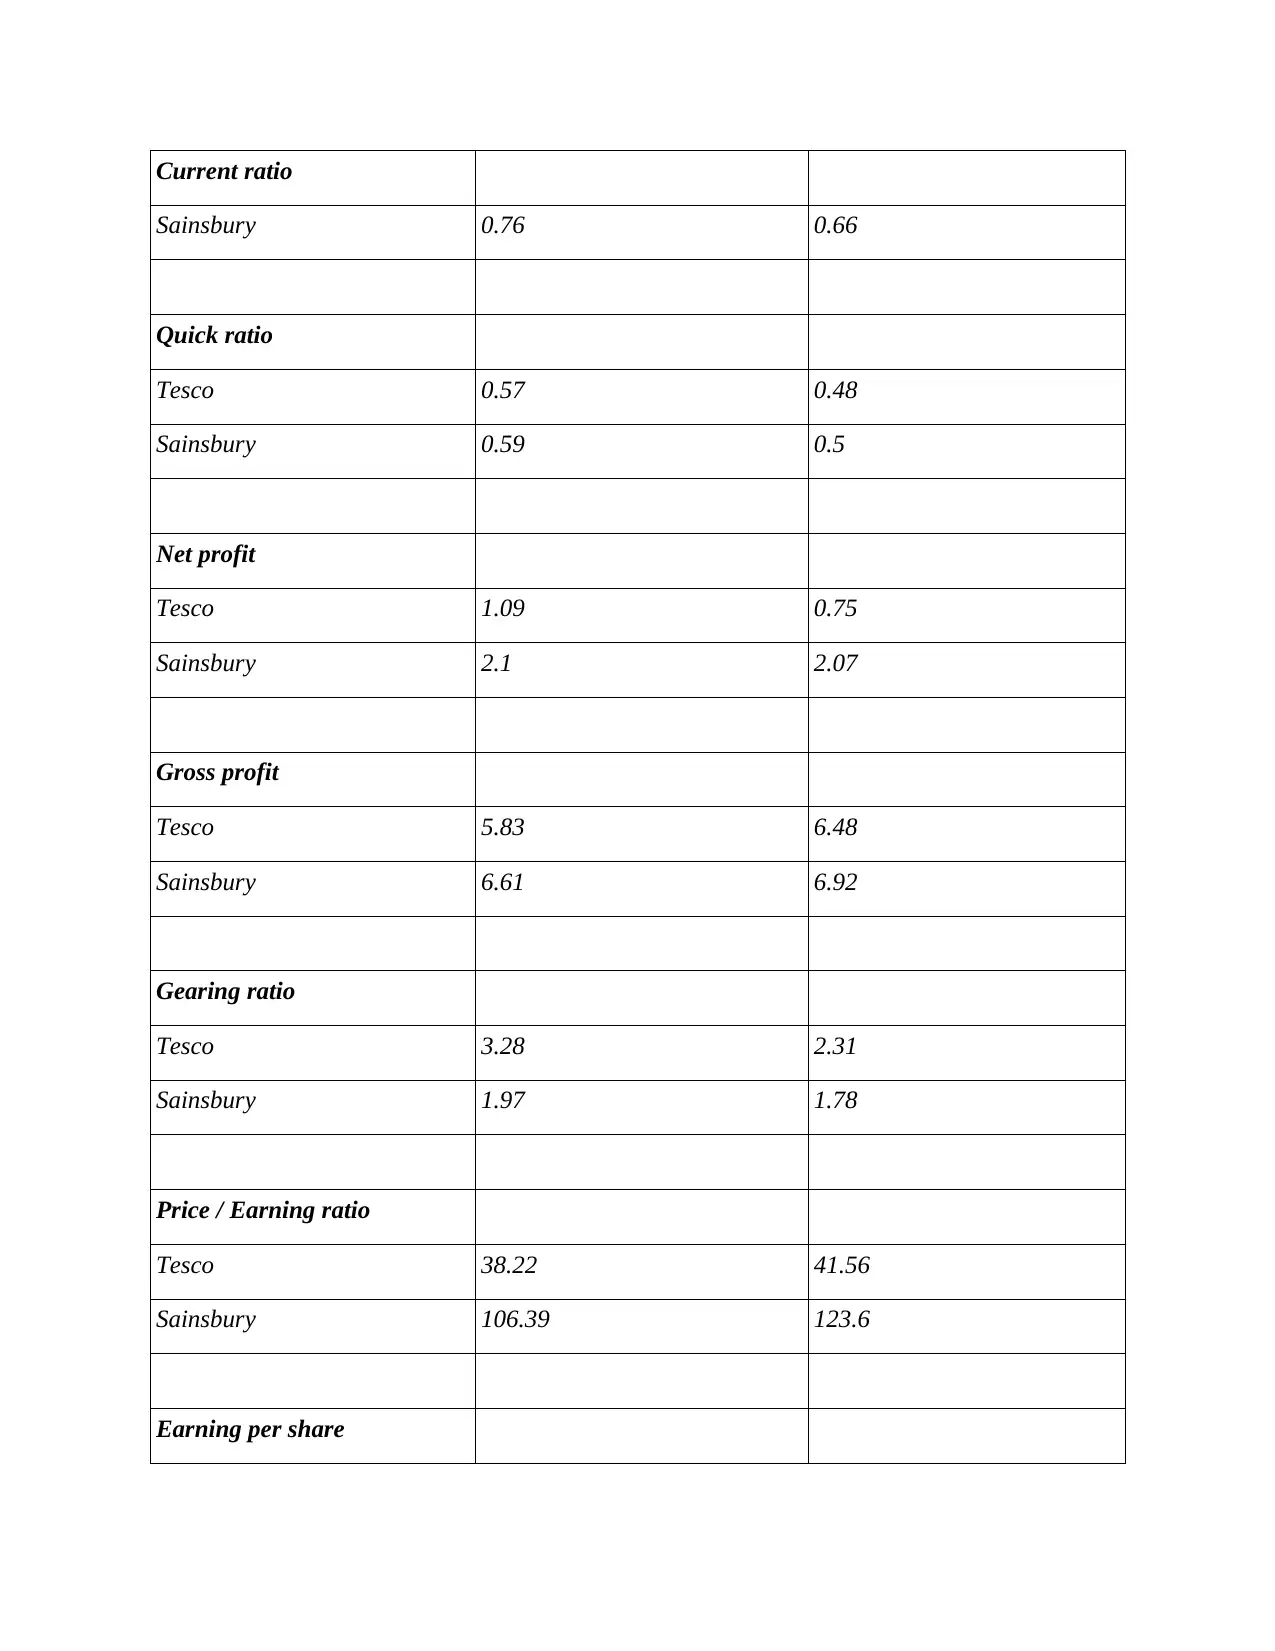
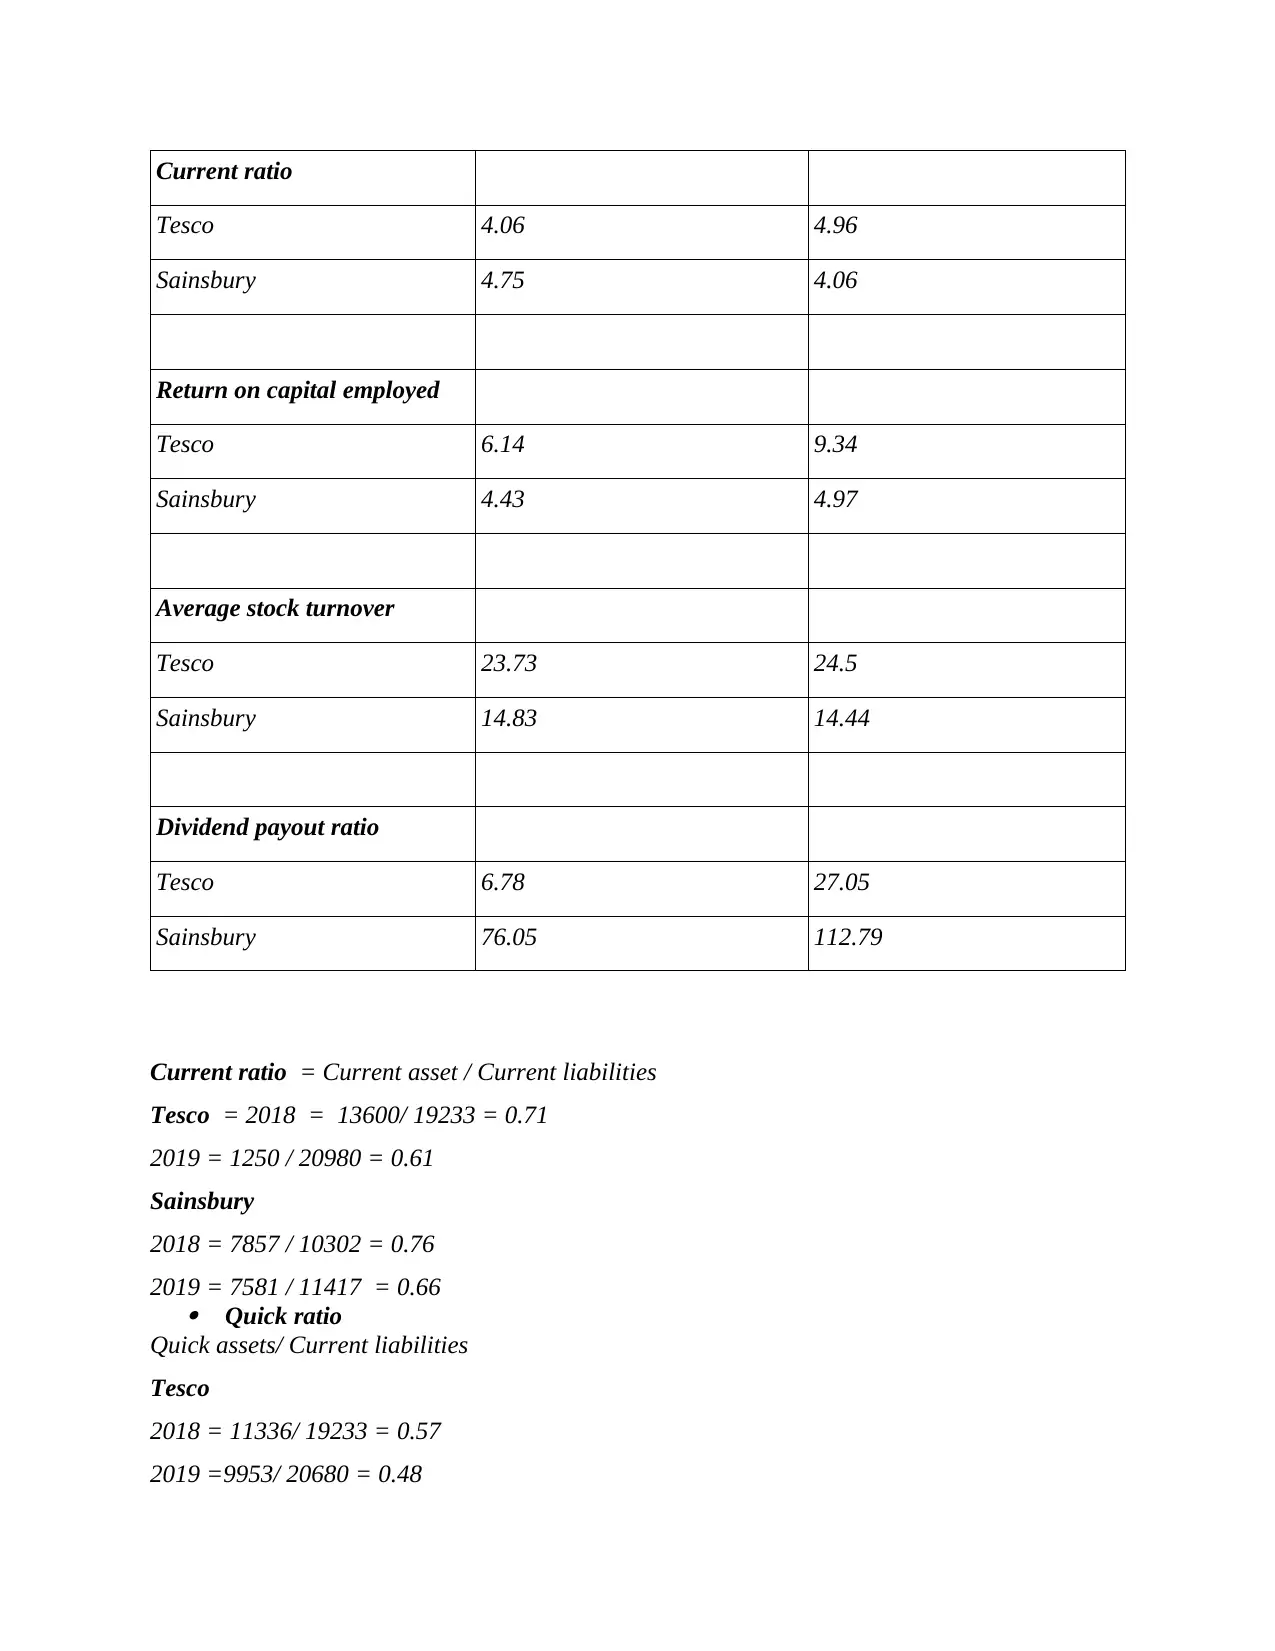
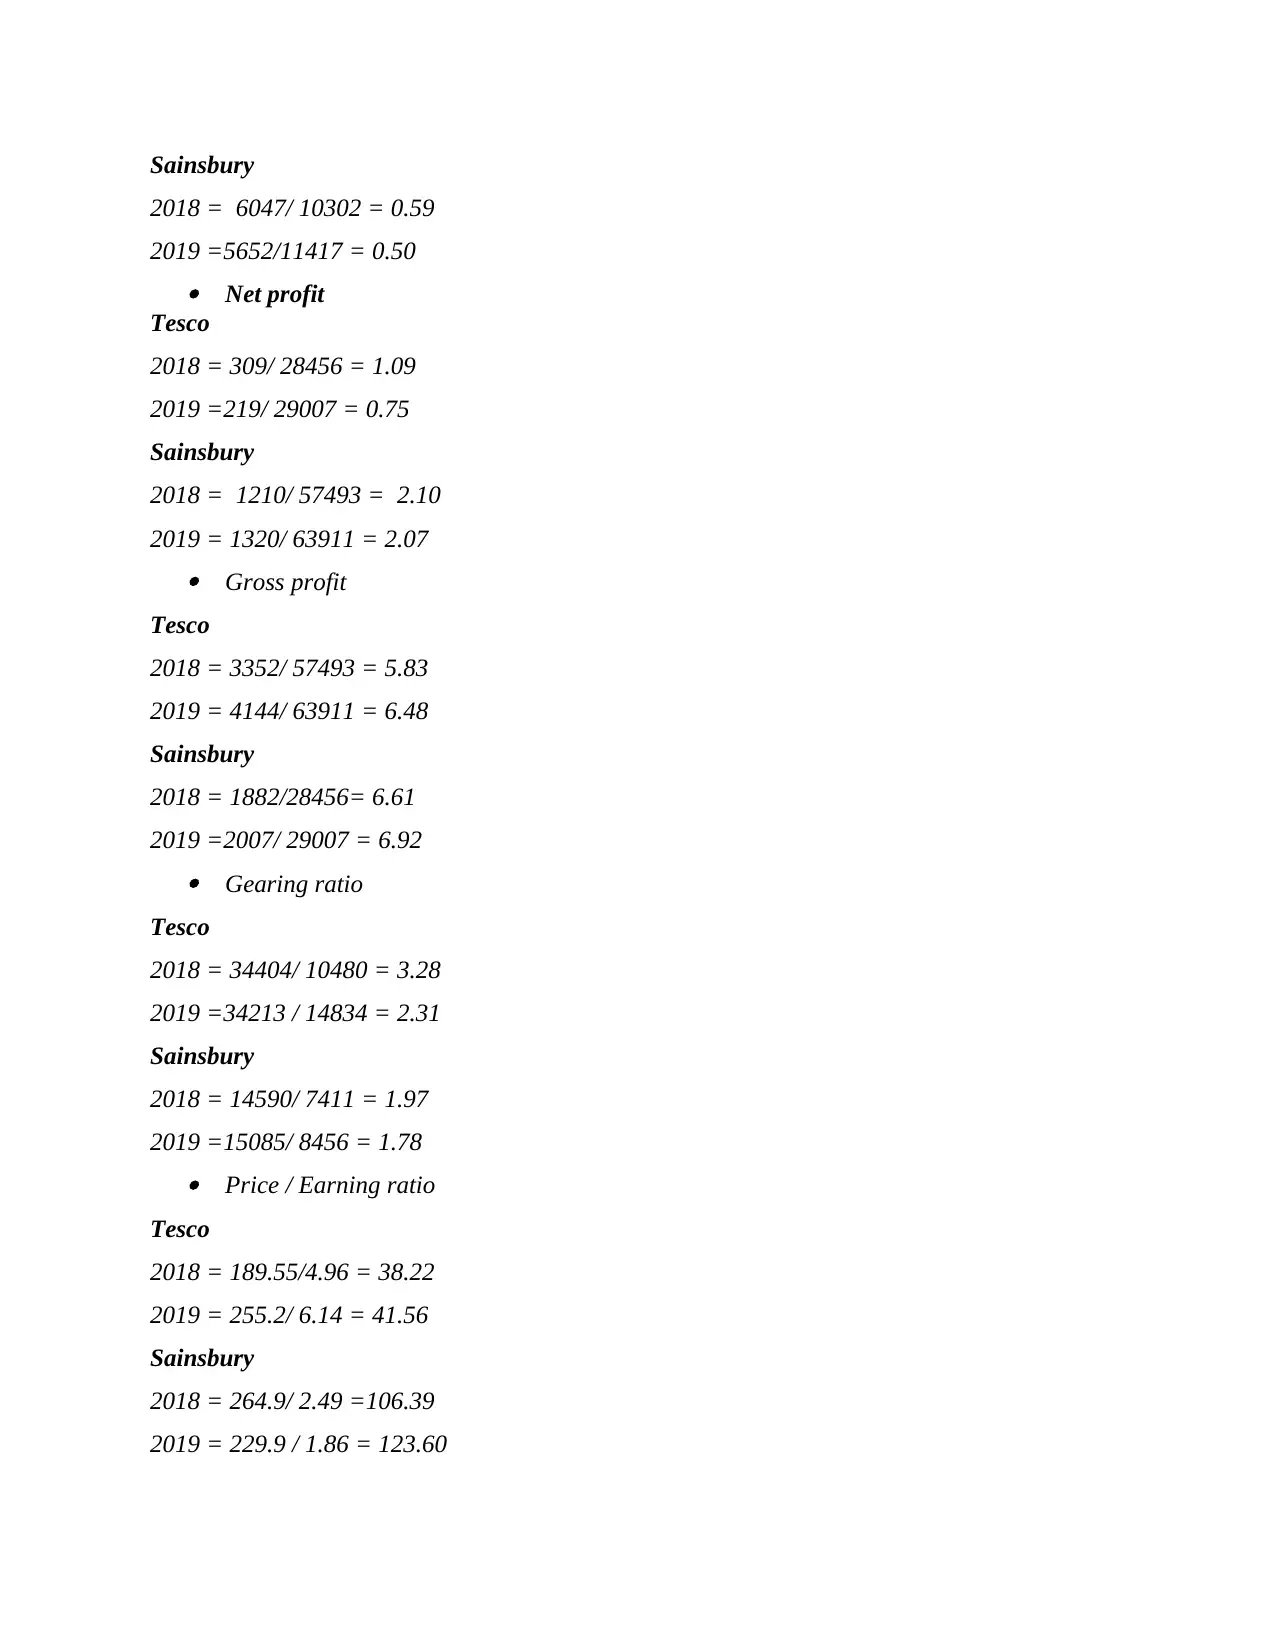
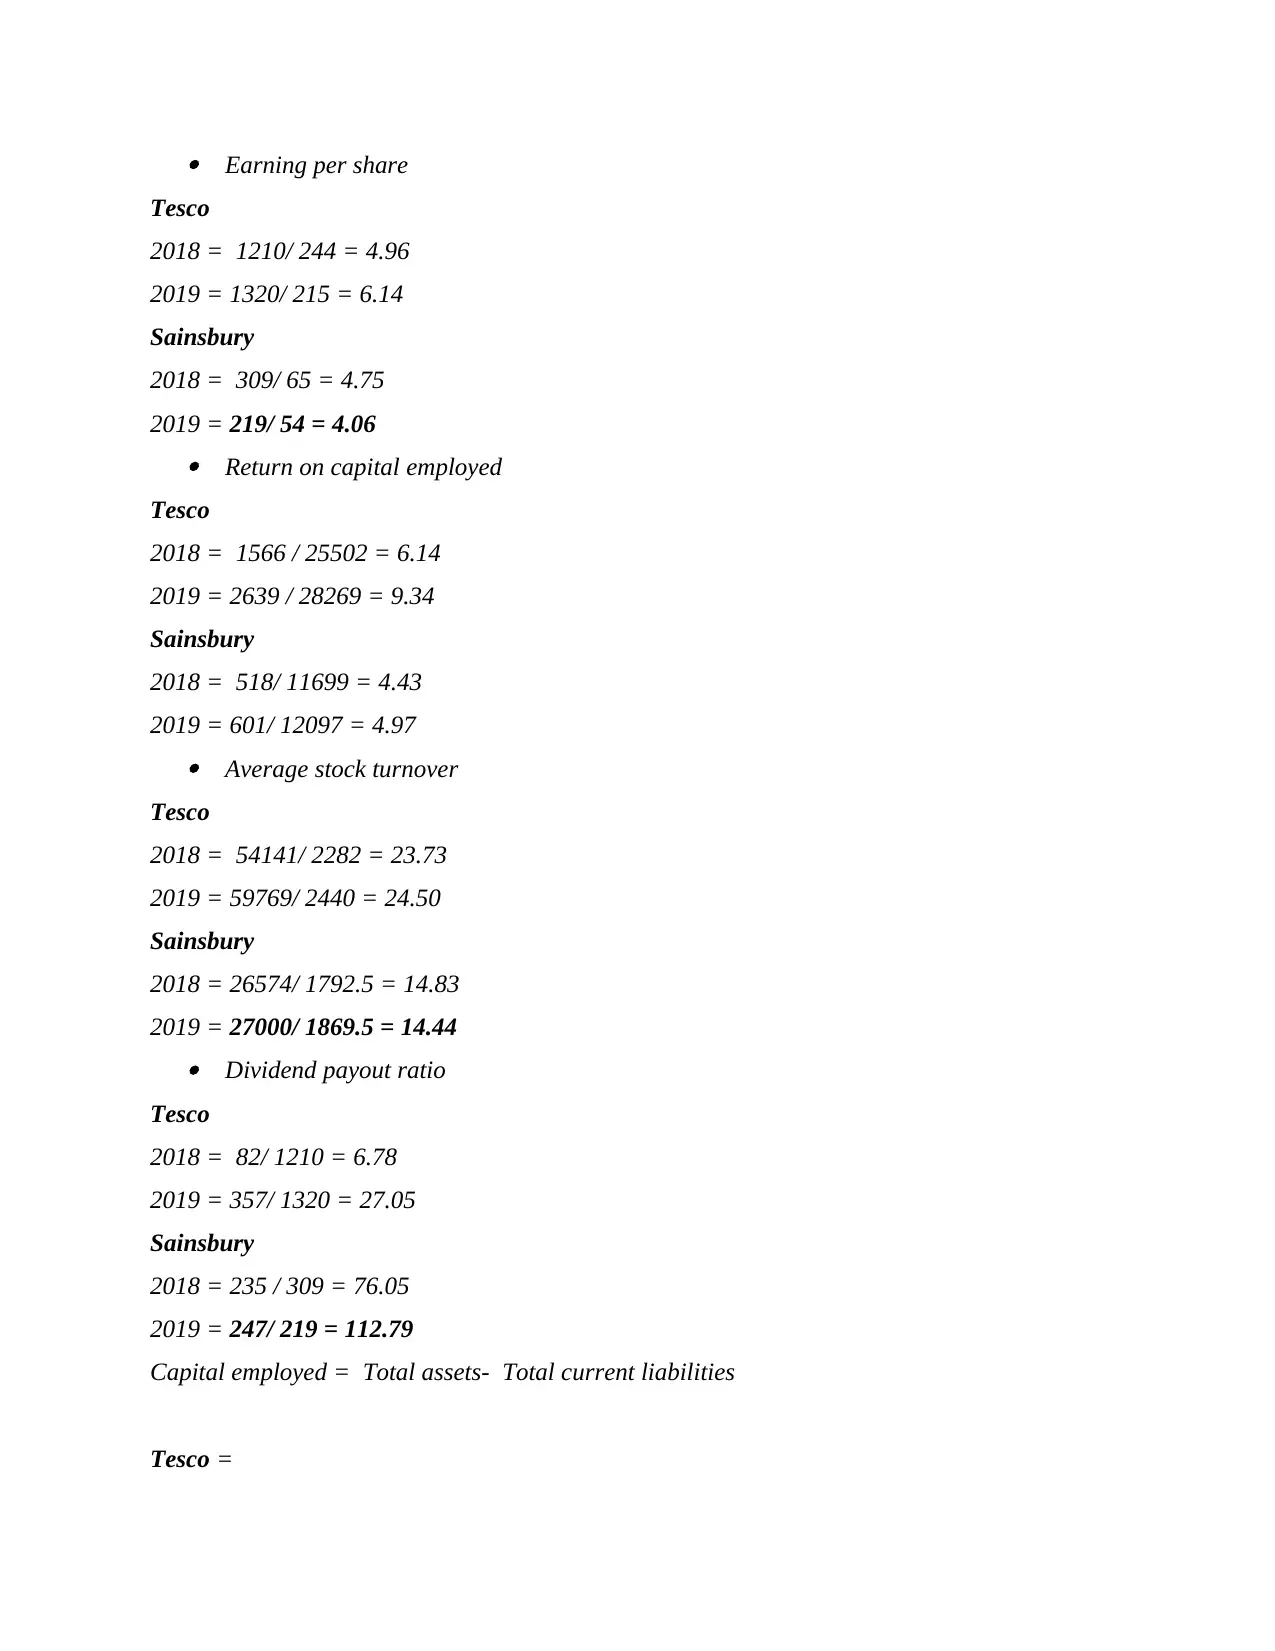
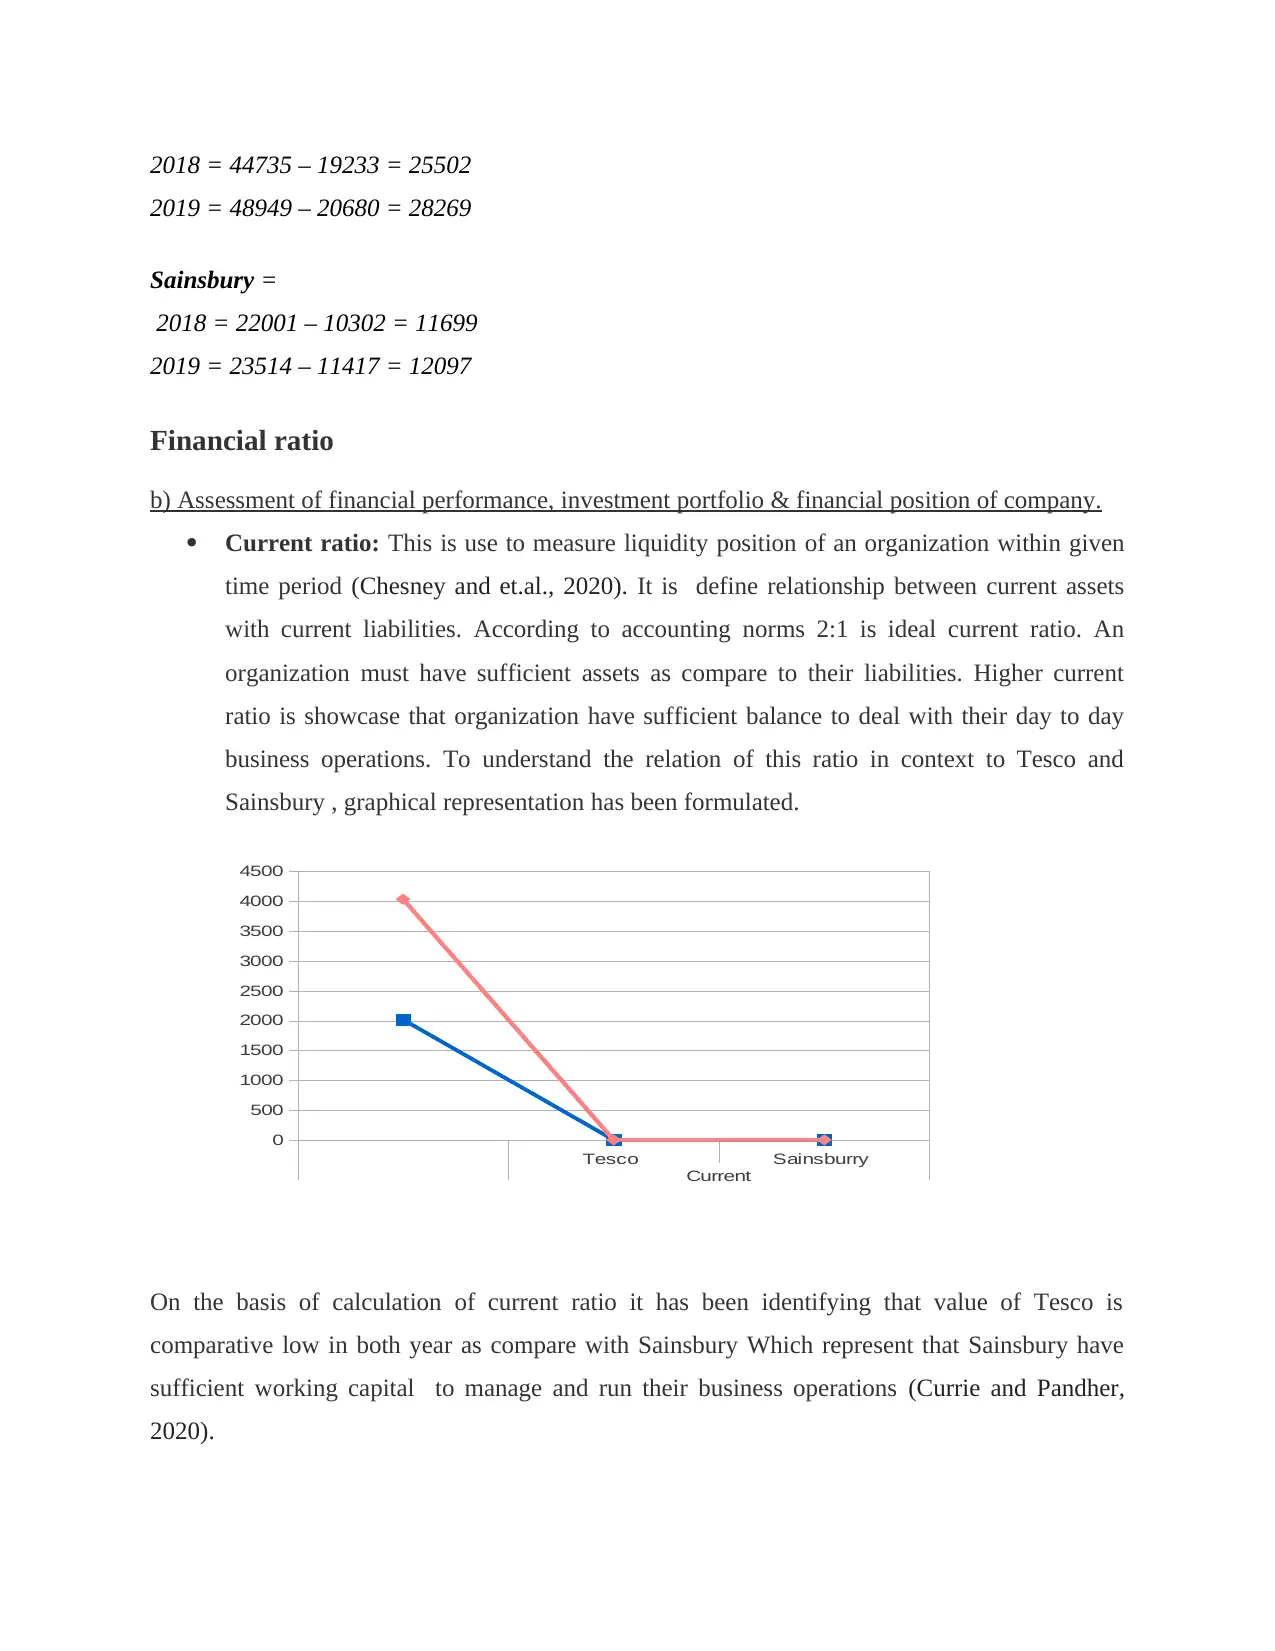
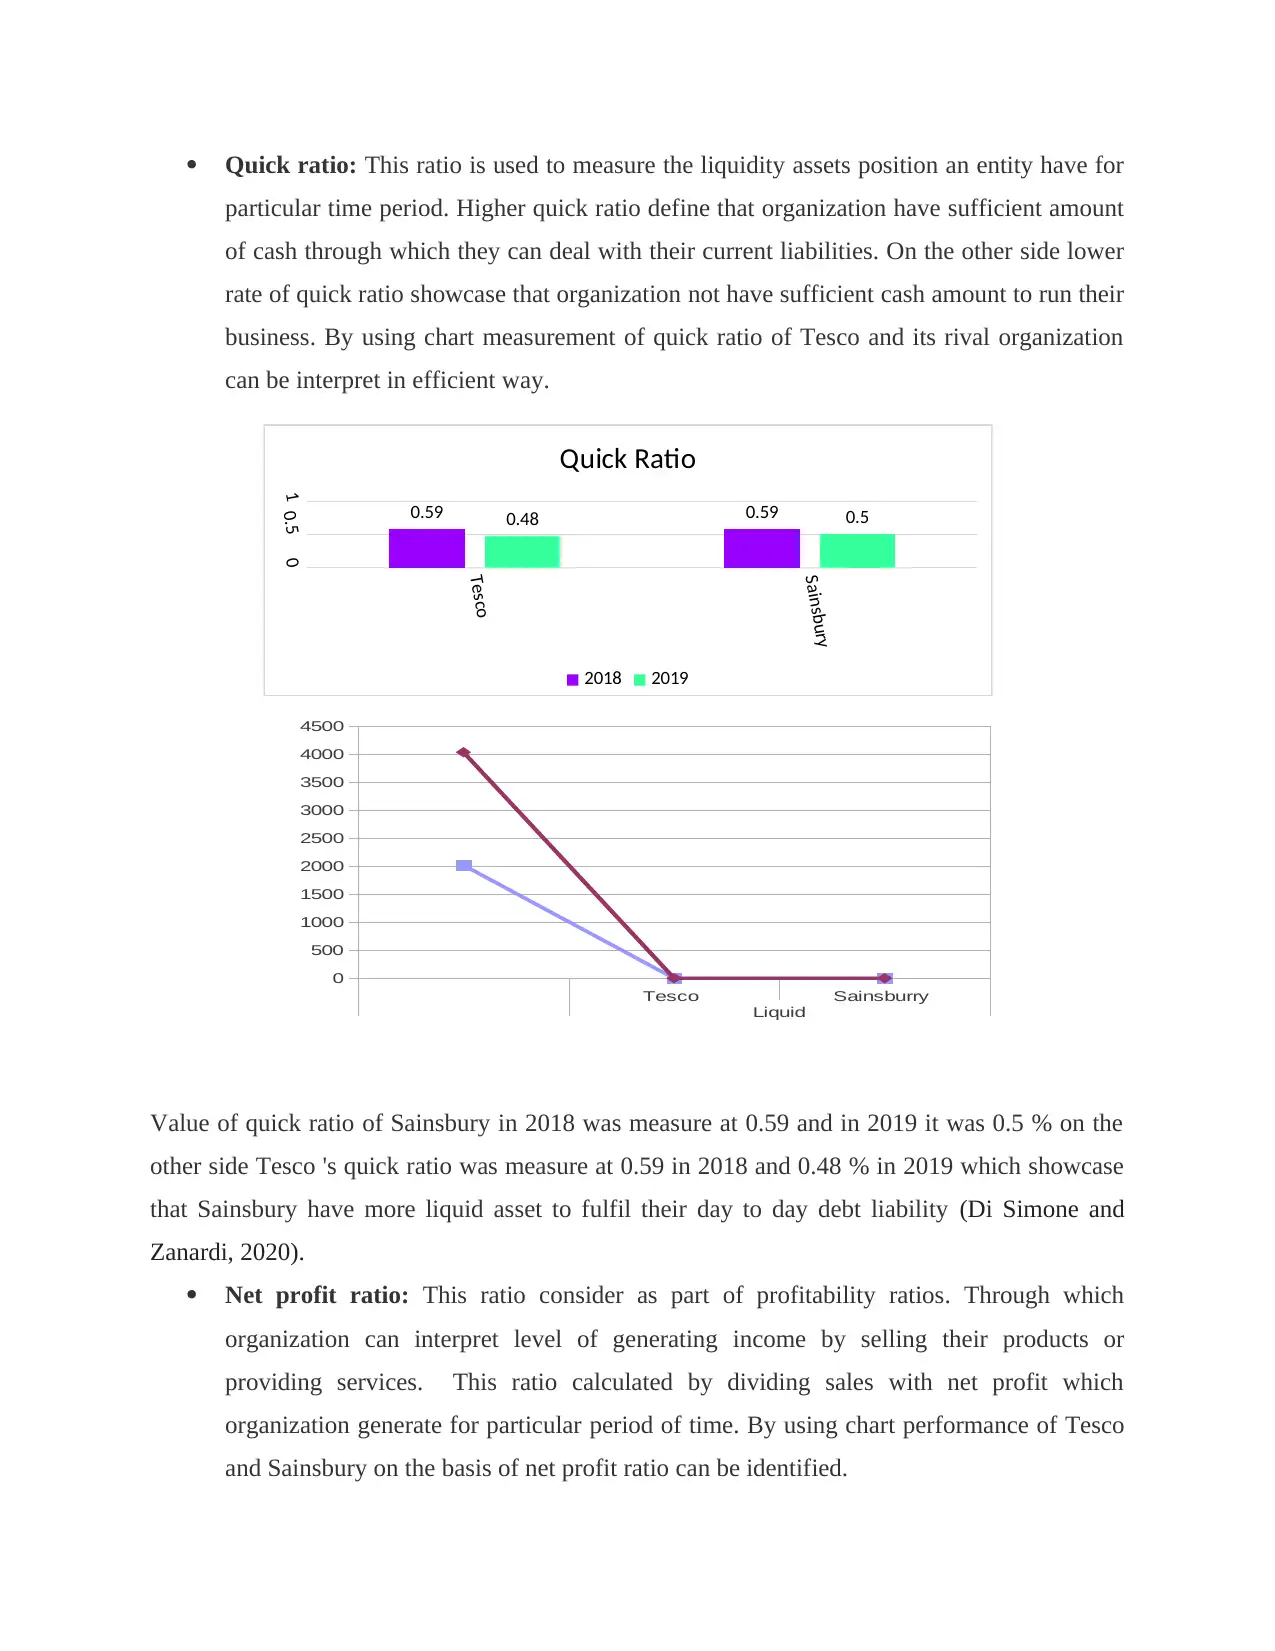
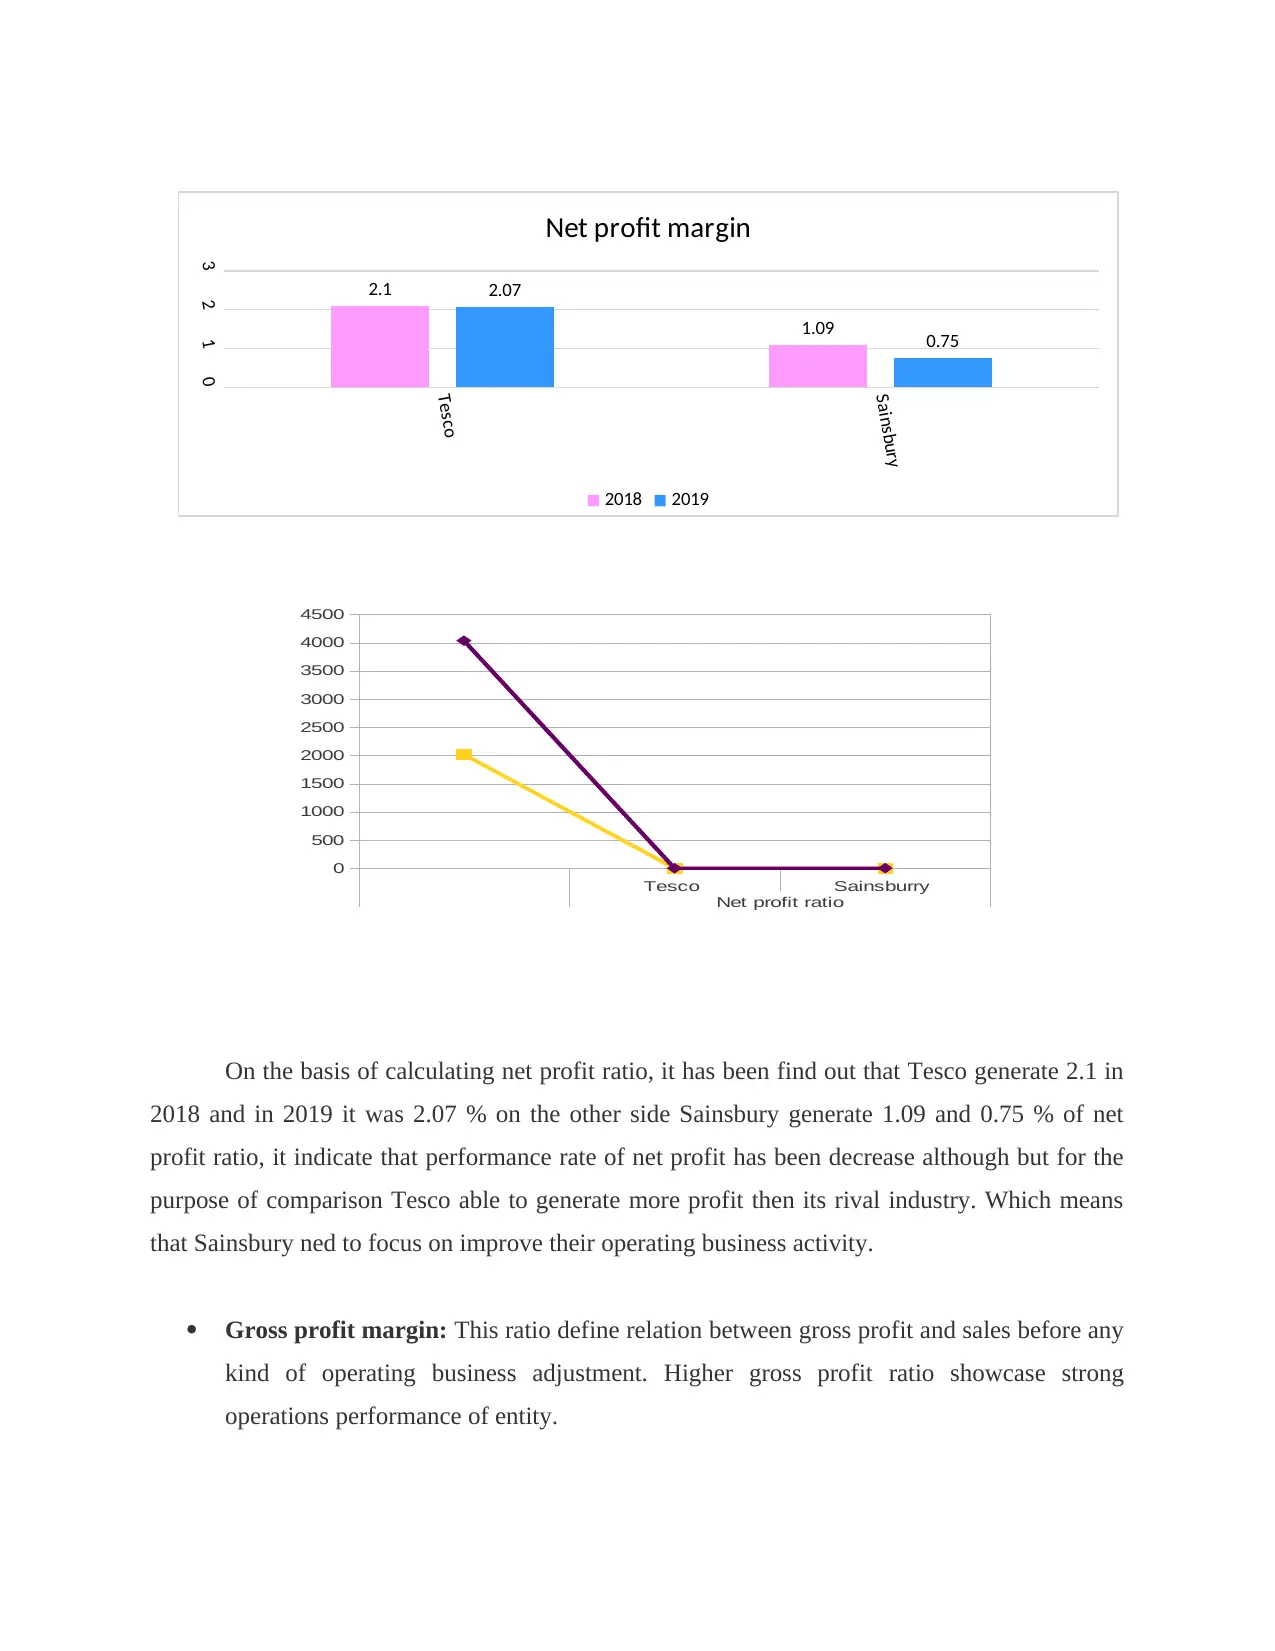
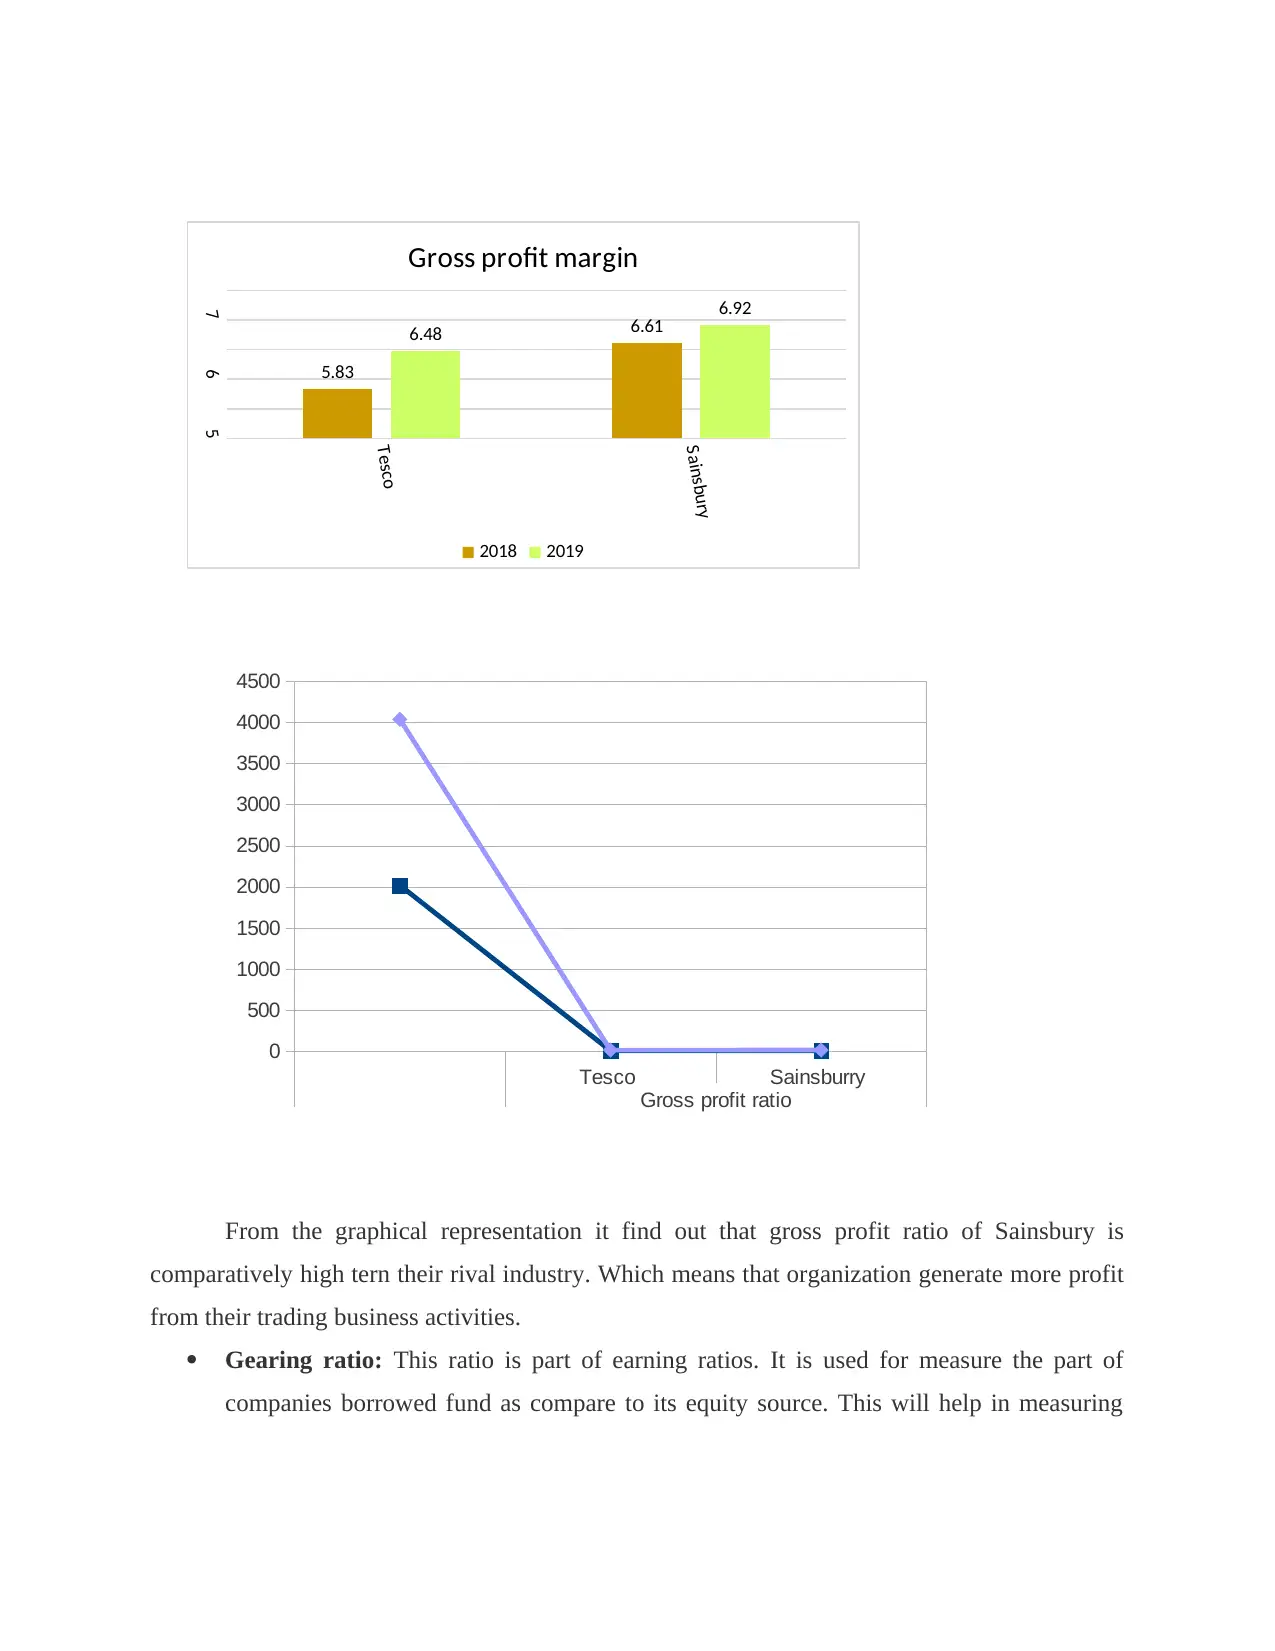
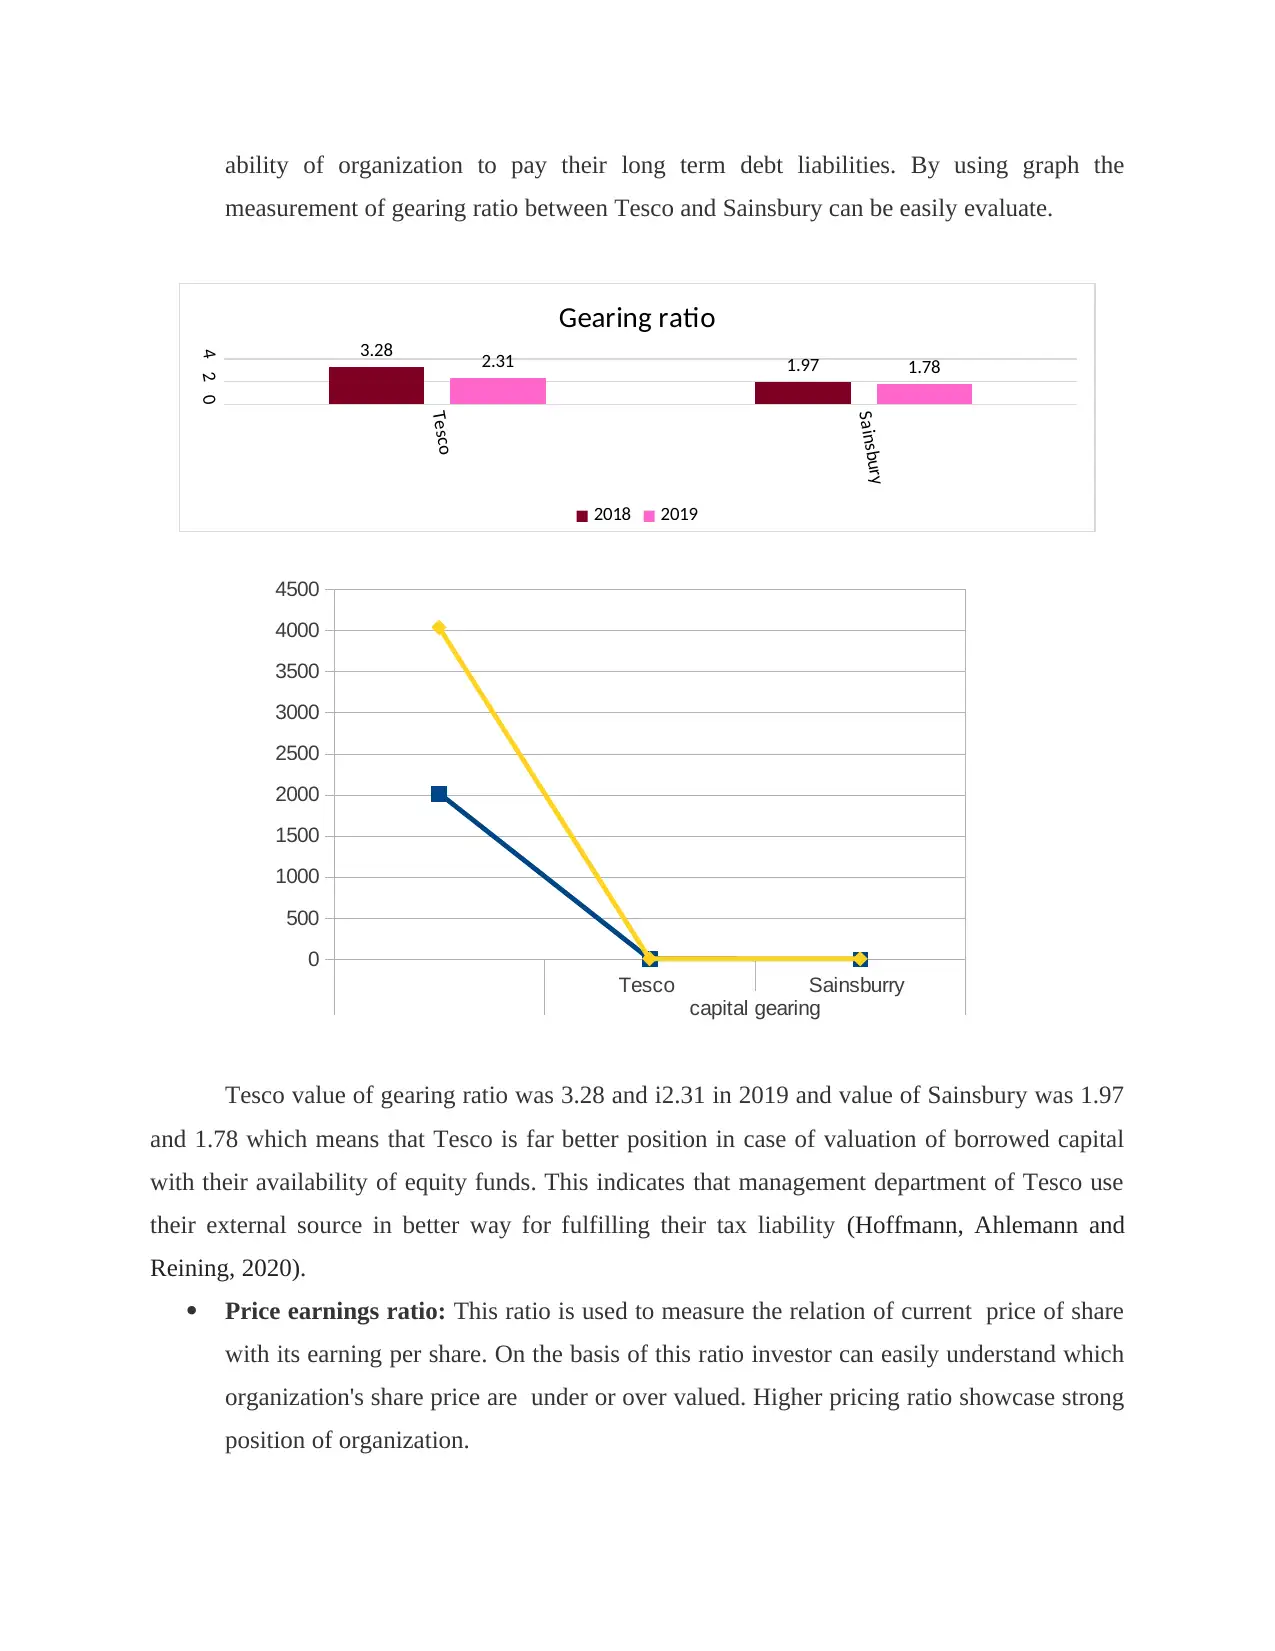
This managerial finance report provides a comprehensive portfolio analysis of Tesco and Sainsbury, focusing on key financial ratios to assess their performance, investment portfolios, and financial positions. The report includes calculations and graphical representations of current ratio, quick ratio, net profit margin, gross profit margin, gearing ratio, price-earnings ratio, earnings per share, return on capital employed, and stock turnover ratio. It evaluates the liquidity, profitability, and solvency of both companies, highlighting their strengths and weaknesses. Furthermore, the report discusses various capital investment appraisal methods, such as net present value and payback period, along with their limitations in decision-making. The analysis aims to provide insights for investors and managers to understand the financial health and investment potential of Tesco and Sainsbury, with the complete assignment available on Desklib, where students can find a wide array of solved assignments and past papers.
1 out of 23
Related Documents


Your All-in-One AI-Powered Toolkit for Academic Success.
+13062052269
info@desklib.com
Available 24*7 on WhatsApp / Email
![[object Object]](/_next/static/media/star-bottom.7253800d.svg)
Copyright © 2020–2025 A2Z Services. All Rights Reserved. Developed and managed by ZUCOL.