Data Management: Analysis and Information Report - [Course Name]
VerifiedAdded on 2023/01/03
|14
|783
|1
Report
AI Summary
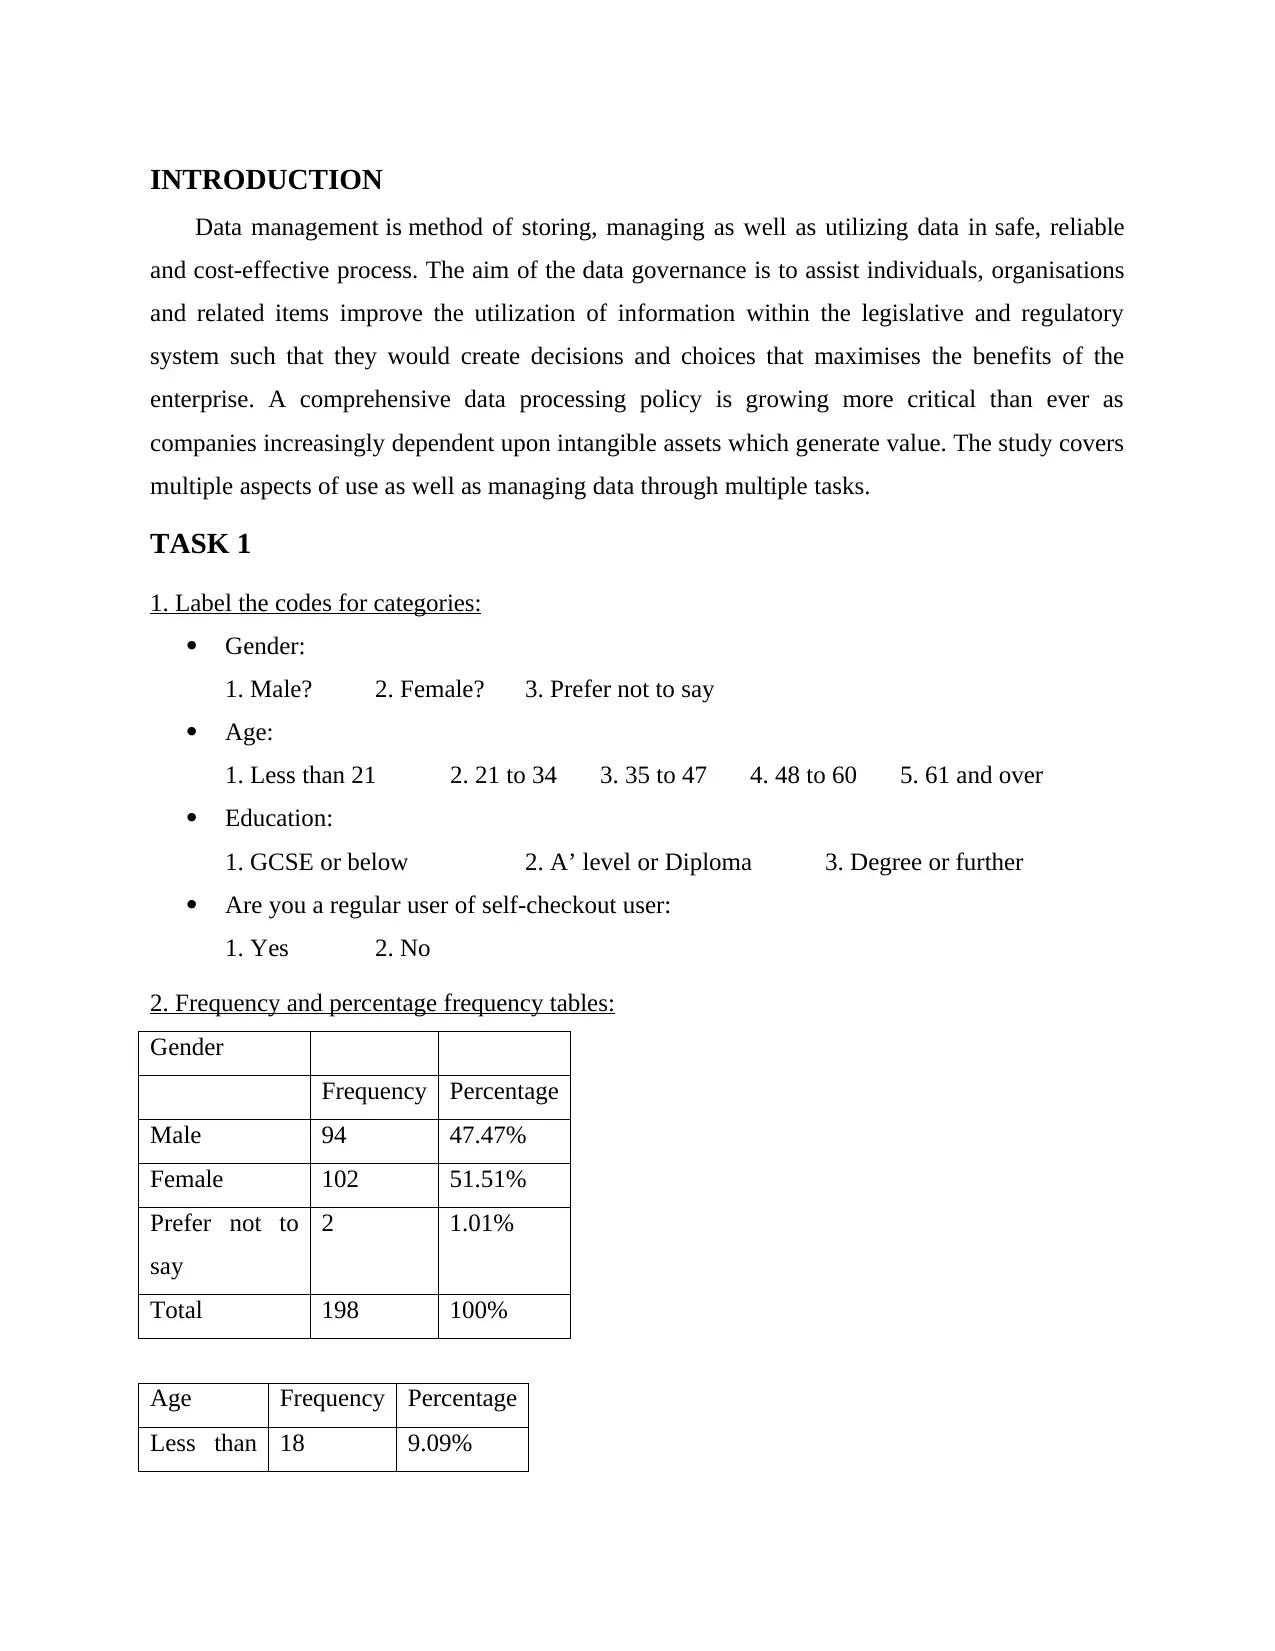
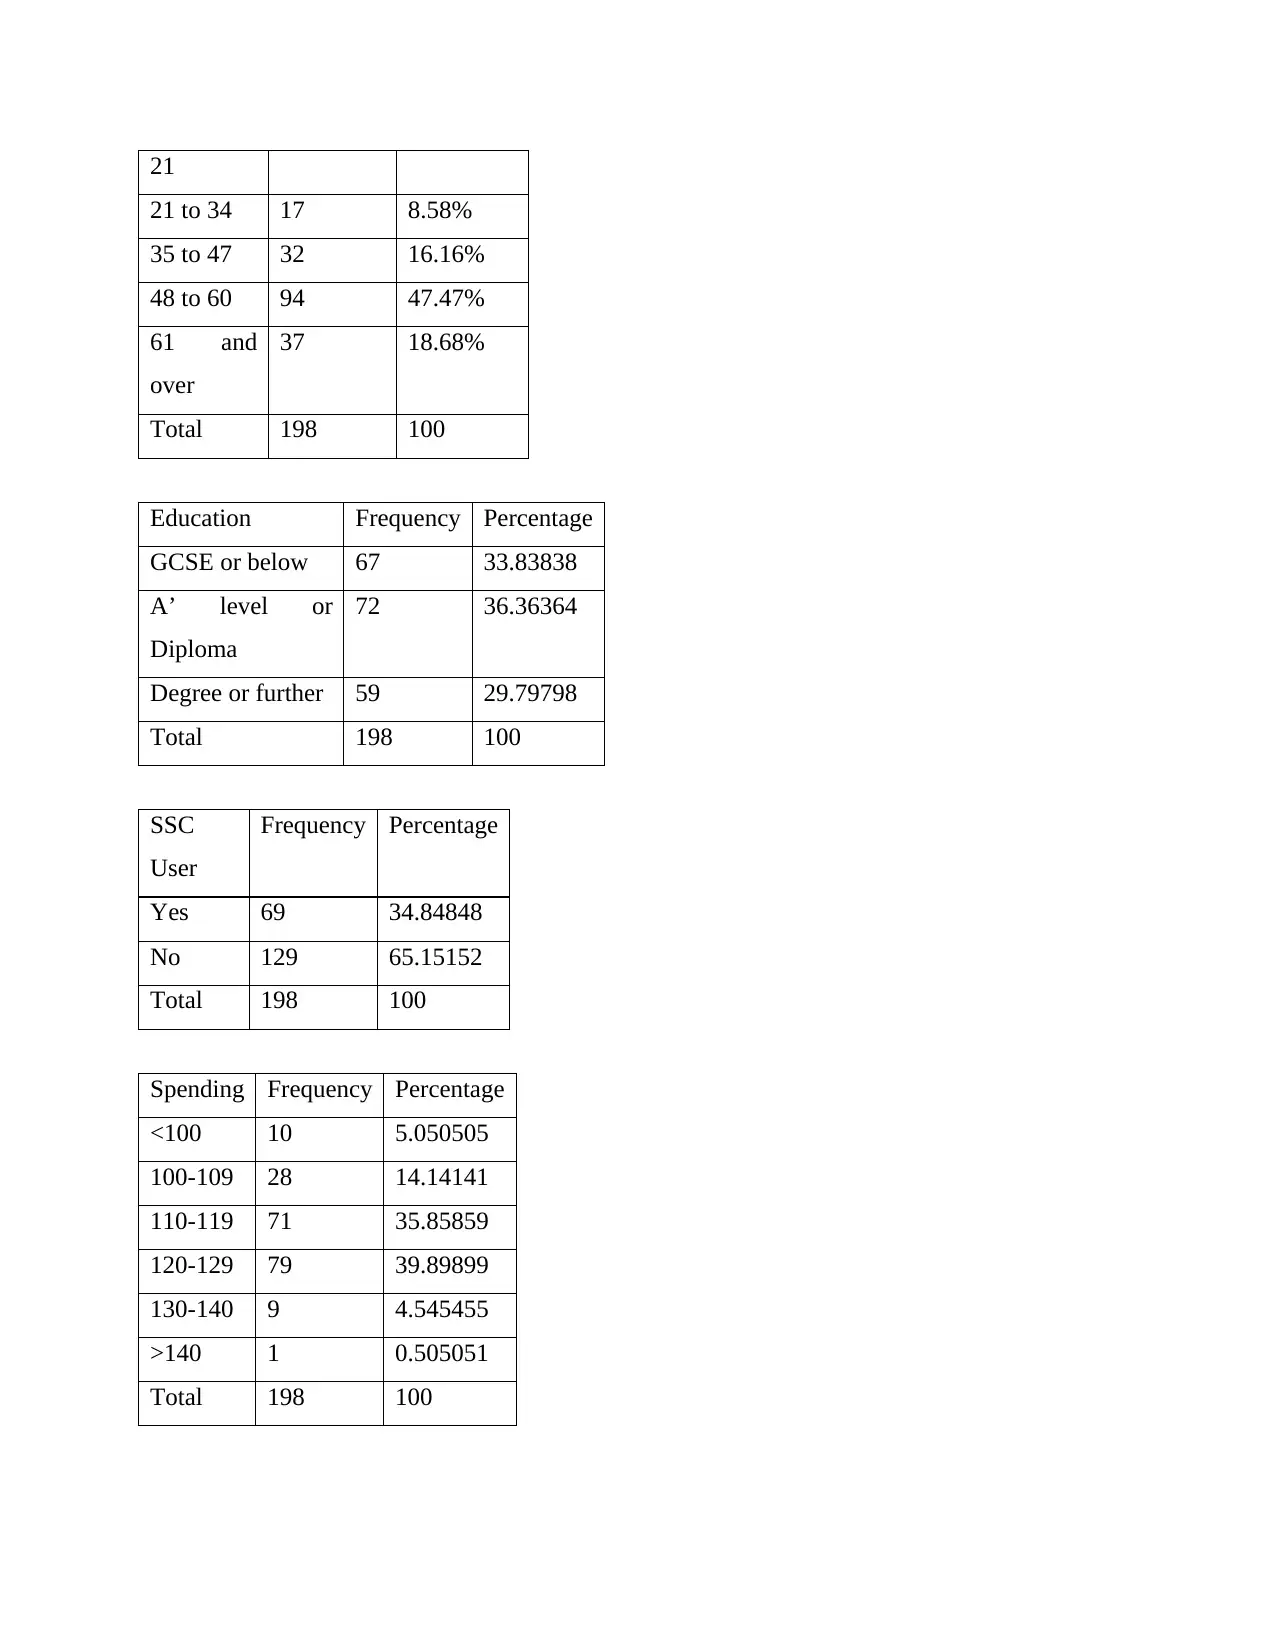
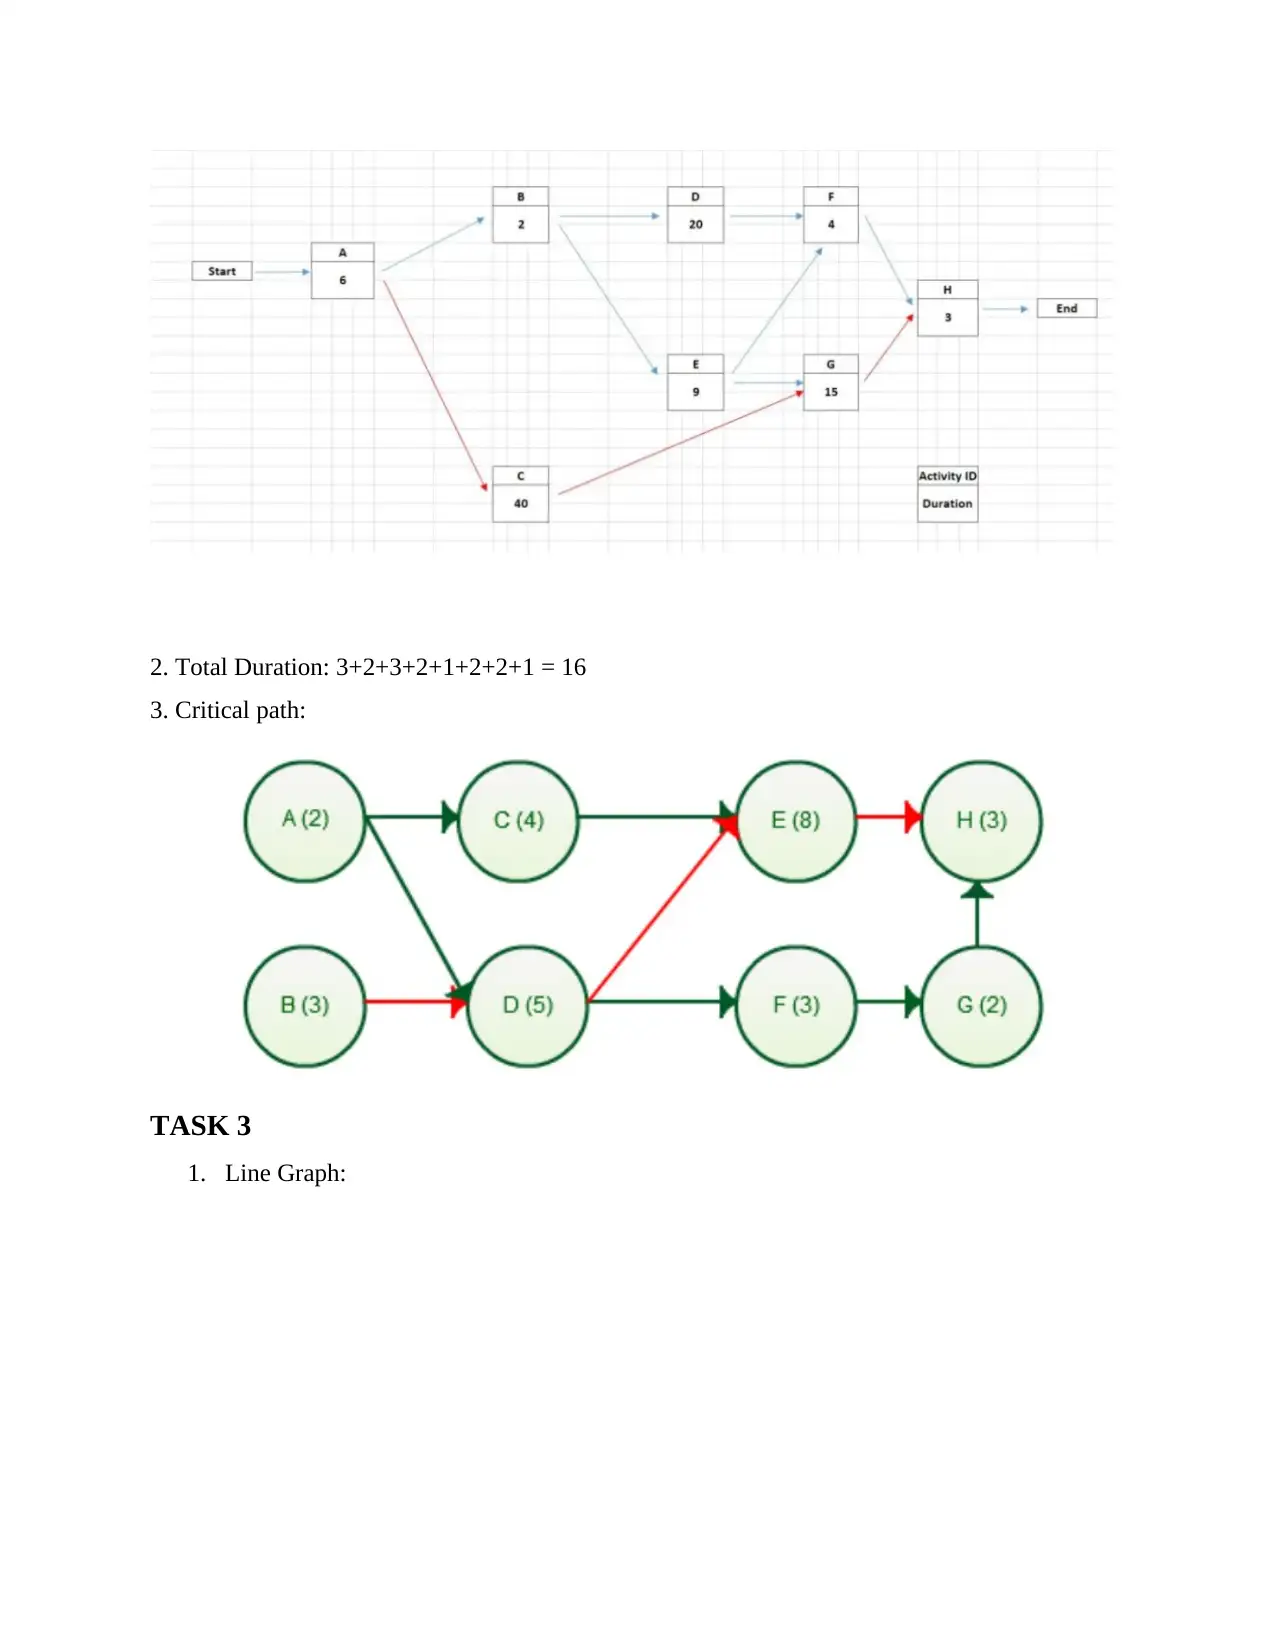
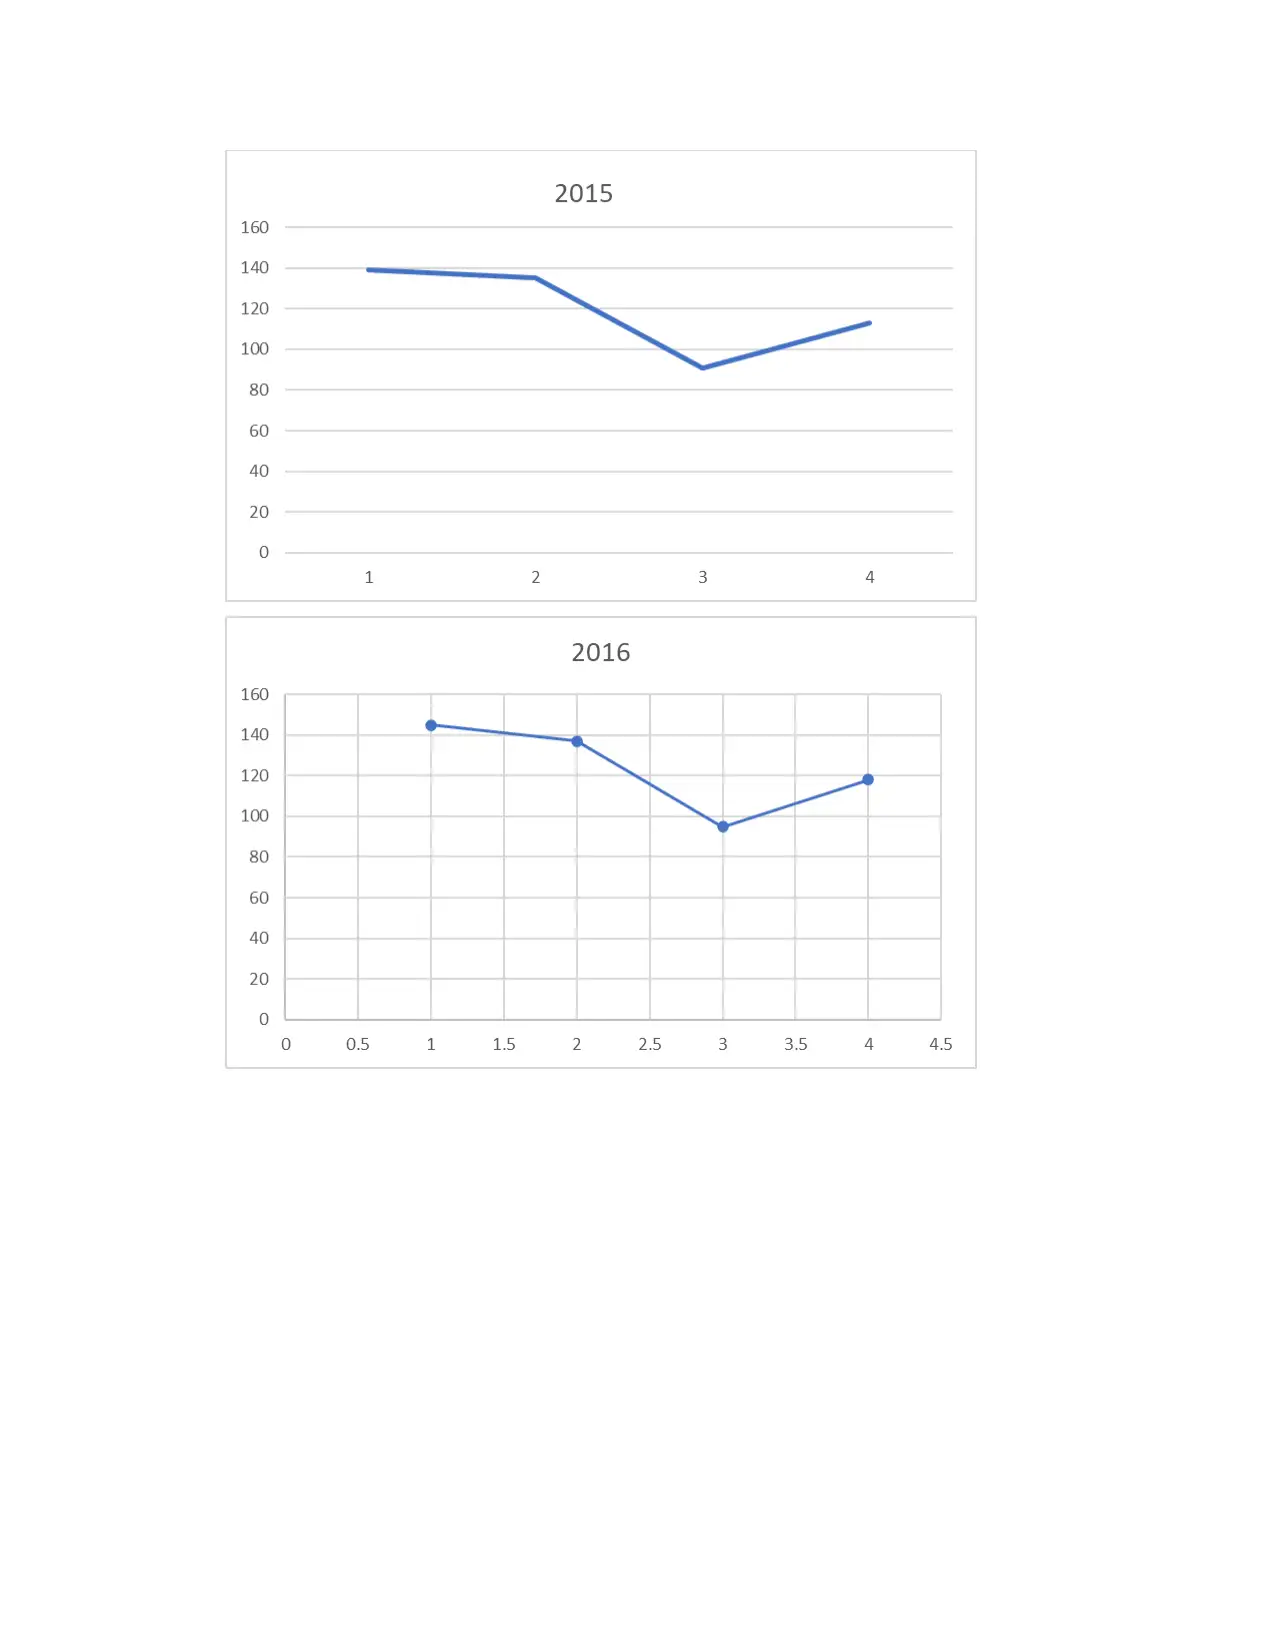
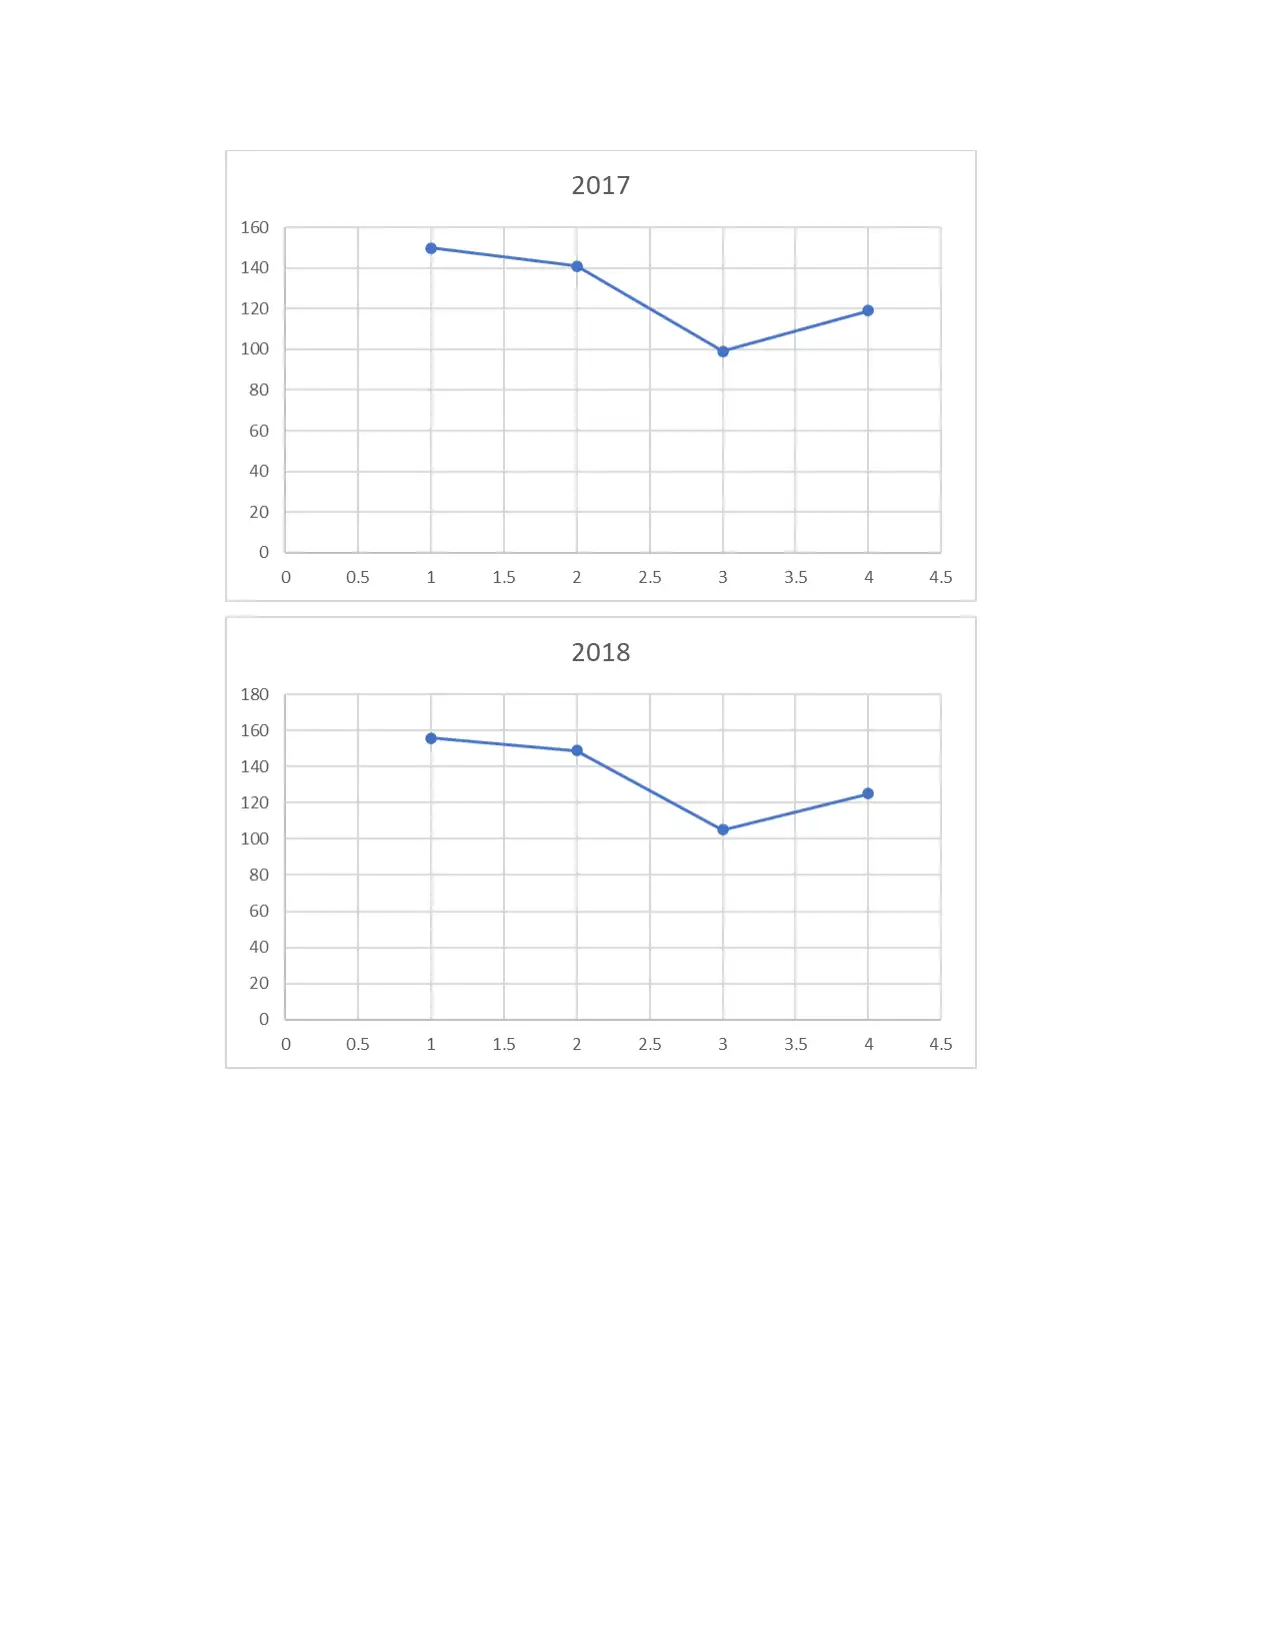
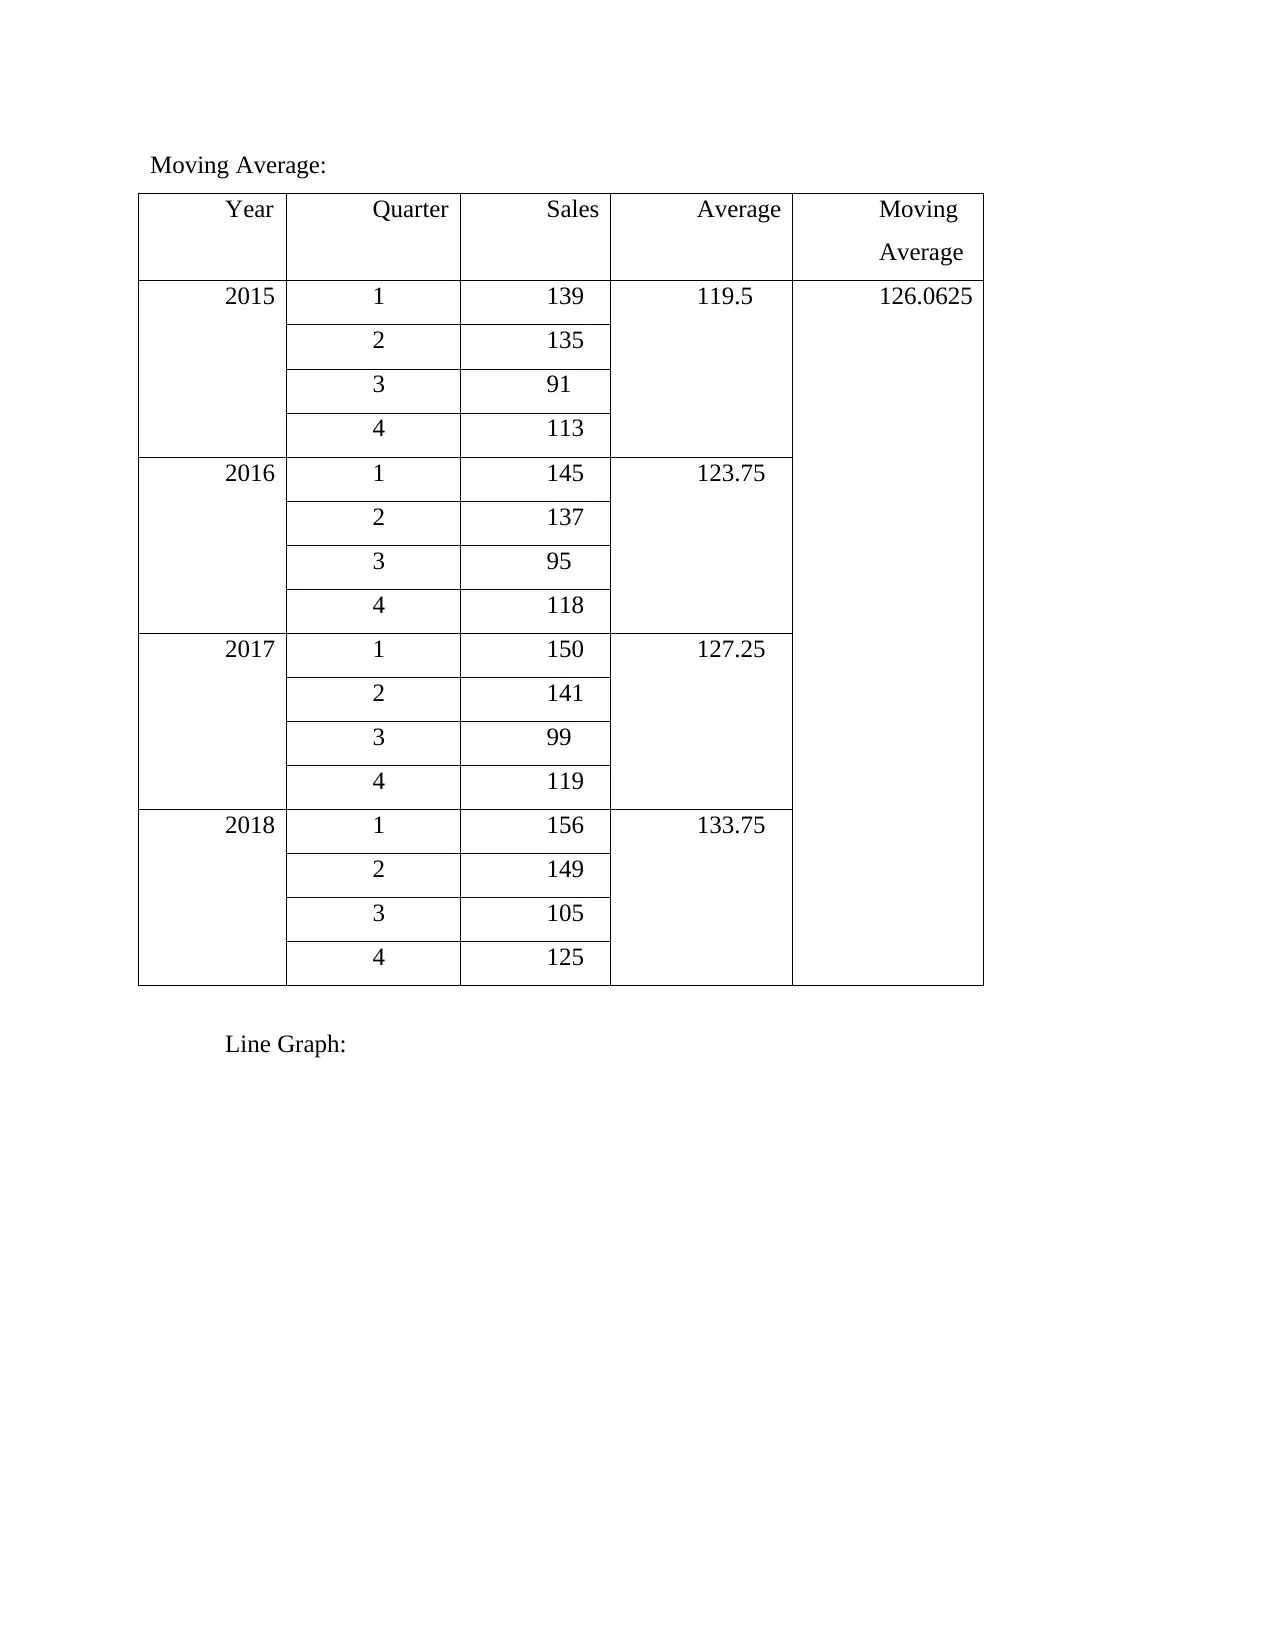
This report provides a comprehensive analysis of data and information management techniques. It begins with labeling codes for categories and constructing frequency and percentage frequency tables. The report then delves into graphical representations, including bar charts and pie charts, followed by an analysis of spending patterns and the creation of cross tables and scatter diagrams to visualize relationships between different variables. Task 2 explores network diagrams and critical path analysis to determine project durations. Task 3 involves the use of line graphs and moving averages to analyze trends in sales data. Finally, Task 4 focuses on profit analysis, including calculating profit and identifying the factors that maximize profitability. The conclusion emphasizes the importance of effective data management systems for modern corporations, highlighting the use of data analysis technologies to handle complex data streams.
1 out of 14
Related Documents


Your All-in-One AI-Powered Toolkit for Academic Success.
+13062052269
info@desklib.com
Available 24*7 on WhatsApp / Email
![[object Object]](/_next/static/media/star-bottom.7253800d.svg)
Copyright © 2020–2026 A2Z Services. All Rights Reserved. Developed and managed by ZUCOL.