Managing Financial Performance
Added on 2023-01-11
24 Pages6722 Words65 Views
Managing financial
performance
performance
TABLE OF CONTENTS
Critical personal reflection.....................................................................................................3
Question 1..............................................................................................................................3
Question 2..............................................................................................................................7
Question 3..............................................................................................................................9
REFERENCES.........................................................................................................................10
APPENDIX..............................................................................................................................11
Question 1............................................................................................................................11
Critical personal reflection
Earlier I was not able to clear this assessment and now I am prepared to reappear for
the assessment. I was not able to clear it before as it was not prepared with respect to the
subject and the concept. I though it to be really very tough and just by seeing the numerical I
got scared even though it was very easy. This fear of mine made me to think negative about
the subject because of which I was not able to focus on the subject that caused the problem
for me. Slowly and slowly I completely neglected this subject, thinking I won’t be able to do
it. I lost interest which affected my thinking process and caused a problem for me. All these
negative thoughts worked against me which is the reason I was not able to pass the
assessment first time and I really felt bad about it and even felt depressed. Then I got help
and assistance from the friends to overcome this problem. Then I took the advice and help
from my friends so that I can prepare myself to appear for the retest. At this point I was clear
in mind that I have to do something and pass this assessment any how this time. I have
gathered all the notes that will be useful for my study from my friends and faculty. My
neglecting behaviour causes failure which I always regret and I have learned from my
mistake.
This time I have really worked hard and had tried to understand each and every
concept along with its real life corporate application. I have referred to different books which
has helped me in better understanding the concepts. I even took help and guidance from the
faculty which has helped me in building more confidence and encouraged me to pursue
further and also provided me direction so that I can achieve my goals easily. I have even
made a study schedule with all the topic which are required to be covered so that I didn’t skip
any important topic and follow the schedule to complete my study on time which has
provided me ample time revision and more practice. This time I feel I am well prepared and
will be able to clear the assessment. I have undergone thorough revision and numerical
practice which has helped me in getting more confidence, better understanding and clearing
the concepts with more clarity. Thus, based on the time, efforts and dedication that I have put
on preparing on for this assessment makes me feel secure that this time I will pass the
assessment. I am no longer in fear of the subject and long numerical questions. I have cleared
my mind and thoughts and started a fresh and I think I will be able to do it. This make me feel
sure that the thing which I was not able to do last time, this time I will do it and will succeed.
Question 1
Vertical analysis
Income statement: The percentage change in the cost of goods sold with respect to sales has
increase over the period 5 year in Sainsbury from 94.07% in 2016 to 102.28% in 2020 as
compared to the Tesco which has declined from 94.79% in 2016 to 92.57% (Rengel and
Palacios, 2020). But the gross income of Sainsbury has increased in comparison to Tesco
which is good sign but the net income has declined of Sainsbury as compared to Tesco which
has increased.
Balance sheet: It can be seen that the current assets of Sainsbury is 26.13% of total assets
which has increased to 27.15% in 2020 in contrast to 33.12% in Tesco which ahs declined to
24.62% in 2020. The current liability of Sainsbury constitutes 43.12% in 2020 an increase
from 2016 and in Tesco, it has declined from 40.69% in 2016 to 34.28% in 2020.
Horizontal analysis
Income statement: In Sainsbury, the sales has shown an increasing trend over the past 5 year
taking 2016 as the base year. Also, the gross incomes have increased from 8.32% in 2017 to
55.16% in 2020. But the net income as shown downward trend as it has decreased to -71.49%
in 2020 from -21.79% in 2017. On the other hand, in Tesco, revenue has shown an increasing
trend but the gross income has shown a downward trend as it falls to -41.60% in 2020. The
net income is in upward trend as the percentage change has increased from -72.83% to
252.08% in 2020.
Balance sheet: In Sainsbury, there is a positive change in the current asset and the total assets
along with the current and total liabilities (Vaca-Tapia and et.al, 2018). Increase in assets is
good but increase in liability is a concern. In Tesco, there is decline in the change in current
and total assets but the current liabilities have declined from 7.66% in 2017 to 0.34% in 2020
which is good for it but the overall liabilities have increased.
Profitability: It is the financial metrics which is used in evaluating and measuring the ability
of the business to generate income in relation to sales, operating cost, assets and so forth
(Goldmann, 2017).
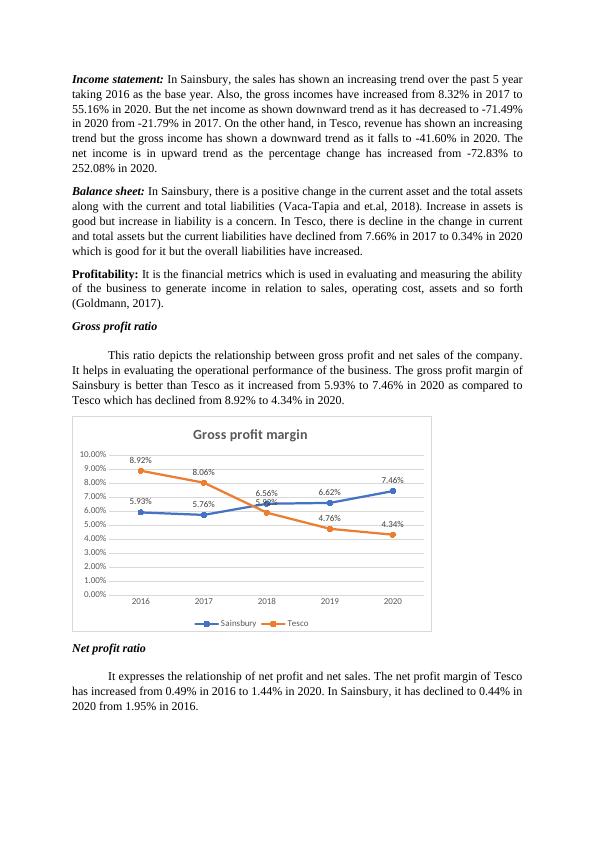
Gross profit ratio
This ratio depicts the relationship between gross profit and net sales of the company.
It helps in evaluating the operational performance of the business. The gross profit margin of
Sainsbury is better than Tesco as it increased from 5.93% to 7.46% in 2020 as compared to
Tesco which has declined from 8.92% to 4.34% in 2020.
2016 2017 2018 2019 2020
0.00%
1.00%
2.00%
3.00%
4.00%
5.00%
6.00%
7.00%
8.00%
9.00%
10.00%
5.93% 5.76%
6.56% 6.62%
7.46%
8.92%
8.06%
5.92%
4.76% 4.34%
Gross profit margin
Sainsbury Tesco
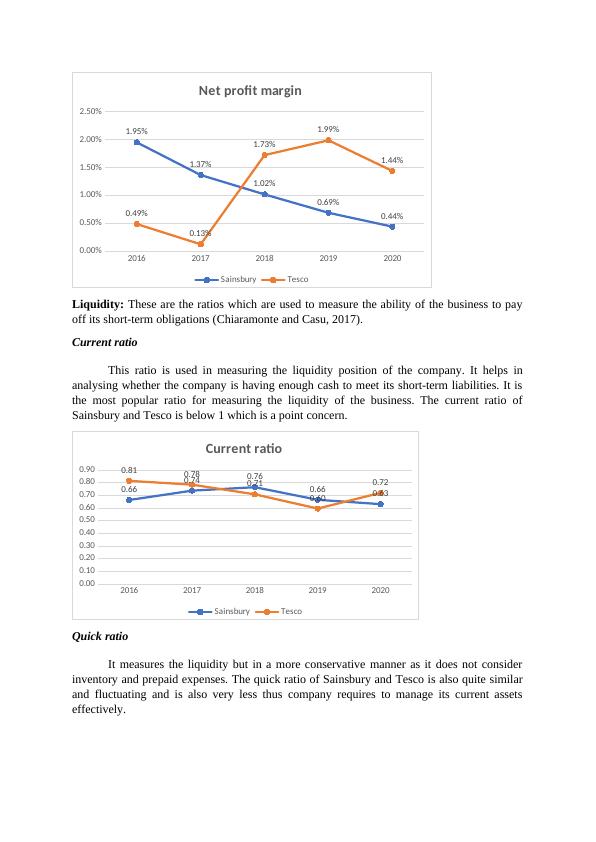
Net profit ratio
It expresses the relationship of net profit and net sales. The net profit margin of Tesco
has increased from 0.49% in 2016 to 1.44% in 2020. In Sainsbury, it has declined to 0.44% in
2020 from 1.95% in 2016.
taking 2016 as the base year. Also, the gross incomes have increased from 8.32% in 2017 to
55.16% in 2020. But the net income as shown downward trend as it has decreased to -71.49%
in 2020 from -21.79% in 2017. On the other hand, in Tesco, revenue has shown an increasing
trend but the gross income has shown a downward trend as it falls to -41.60% in 2020. The
net income is in upward trend as the percentage change has increased from -72.83% to
252.08% in 2020.
Balance sheet: In Sainsbury, there is a positive change in the current asset and the total assets
along with the current and total liabilities (Vaca-Tapia and et.al, 2018). Increase in assets is
good but increase in liability is a concern. In Tesco, there is decline in the change in current
and total assets but the current liabilities have declined from 7.66% in 2017 to 0.34% in 2020
which is good for it but the overall liabilities have increased.
Profitability: It is the financial metrics which is used in evaluating and measuring the ability
of the business to generate income in relation to sales, operating cost, assets and so forth
(Goldmann, 2017).
Gross profit ratio
This ratio depicts the relationship between gross profit and net sales of the company.
It helps in evaluating the operational performance of the business. The gross profit margin of
Sainsbury is better than Tesco as it increased from 5.93% to 7.46% in 2020 as compared to
Tesco which has declined from 8.92% to 4.34% in 2020.
2016 2017 2018 2019 2020
0.00%
1.00%
2.00%
3.00%
4.00%
5.00%
6.00%
7.00%
8.00%
9.00%
10.00%
5.93% 5.76%
6.56% 6.62%
7.46%
8.92%
8.06%
5.92%
4.76% 4.34%
Gross profit margin
Sainsbury Tesco
Net profit ratio
It expresses the relationship of net profit and net sales. The net profit margin of Tesco
has increased from 0.49% in 2016 to 1.44% in 2020. In Sainsbury, it has declined to 0.44% in
2020 from 1.95% in 2016.
2016 2017 2018 2019 2020
0.00%
0.50%
1.00%
1.50%
2.00%
2.50%
1.95%
1.37%
1.02%
0.69%
0.44%0.49%
0.13%
1.73%
1.99%
1.44%
Net profit margin
Sainsbury Tesco
Liquidity: These are the ratios which are used to measure the ability of the business to pay
off its short-term obligations (Chiaramonte and Casu, 2017).
Current ratio
This ratio is used in measuring the liquidity position of the company. It helps in
analysing whether the company is having enough cash to meet its short-term liabilities. It is
the most popular ratio for measuring the liquidity of the business. The current ratio of
Sainsbury and Tesco is below 1 which is a point concern.
2016 2017 2018 2019 2020
0.00
0.10
0.20
0.30
0.40
0.50
0.60
0.70
0.80
0.90
0.66
0.74 0.76
0.66 0.63
0.81 0.78
0.71
0.60
0.72
Current ratio
Sainsbury Tesco
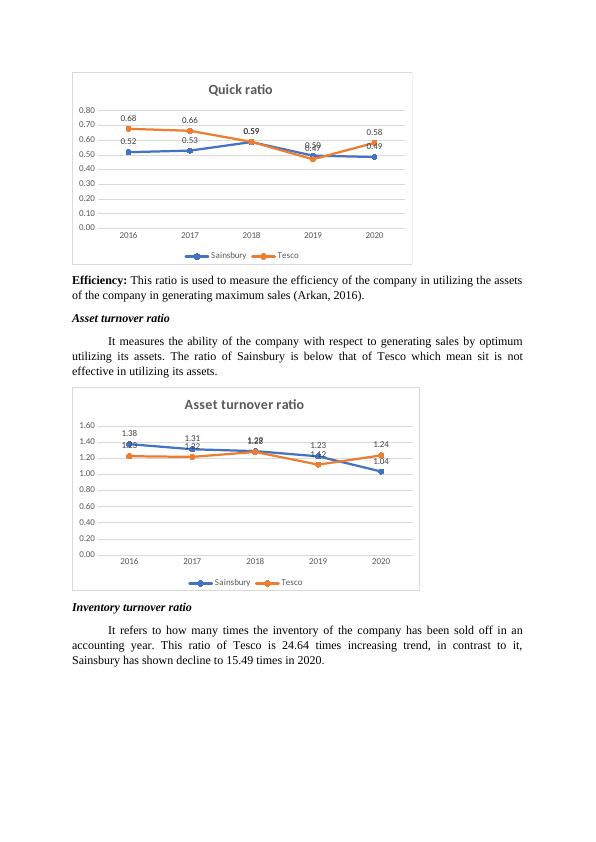
Quick ratio
It measures the liquidity but in a more conservative manner as it does not consider
inventory and prepaid expenses. The quick ratio of Sainsbury and Tesco is also quite similar
and fluctuating and is also very less thus company requires to manage its current assets
effectively.
0.00%
0.50%
1.00%
1.50%
2.00%
2.50%
1.95%
1.37%
1.02%
0.69%
0.44%0.49%
0.13%
1.73%
1.99%
1.44%
Net profit margin
Sainsbury Tesco
Liquidity: These are the ratios which are used to measure the ability of the business to pay
off its short-term obligations (Chiaramonte and Casu, 2017).
Current ratio
This ratio is used in measuring the liquidity position of the company. It helps in
analysing whether the company is having enough cash to meet its short-term liabilities. It is
the most popular ratio for measuring the liquidity of the business. The current ratio of
Sainsbury and Tesco is below 1 which is a point concern.
2016 2017 2018 2019 2020
0.00
0.10
0.20
0.30
0.40
0.50
0.60
0.70
0.80
0.90
0.66
0.74 0.76
0.66 0.63
0.81 0.78
0.71
0.60
0.72
Current ratio
Sainsbury Tesco
Quick ratio
It measures the liquidity but in a more conservative manner as it does not consider
inventory and prepaid expenses. The quick ratio of Sainsbury and Tesco is also quite similar
and fluctuating and is also very less thus company requires to manage its current assets
effectively.
2016 2017 2018 2019 2020
0.00
0.10
0.20
0.30
0.40
0.50
0.60
0.70
0.80
0.52 0.53 0.59
0.50 0.49
0.68 0.66
0.59
0.47
0.58
Quick ratio
Sainsbury Tesco
Efficiency: This ratio is used to measure the efficiency of the company in utilizing the assets
of the company in generating maximum sales (Arkan, 2016).
Asset turnover ratio
It measures the ability of the company with respect to generating sales by optimum
utilizing its assets. The ratio of Sainsbury is below that of Tesco which mean sit is not
effective in utilizing its assets.
2016 2017 2018 2019 2020
0.00
0.20
0.40
0.60
0.80
1.00
1.20
1.40
1.60 1.38 1.31 1.29 1.23
1.04
1.23 1.22 1.28
1.12
1.24
Asset turnover ratio
Sainsbury Tesco
Inventory turnover ratio
It refers to how many times the inventory of the company has been sold off in an
accounting year. This ratio of Tesco is 24.64 times increasing trend, in contrast to it,
Sainsbury has shown decline to 15.49 times in 2020.
0.00
0.10
0.20
0.30
0.40
0.50
0.60
0.70
0.80
0.52 0.53 0.59
0.50 0.49
0.68 0.66
0.59
0.47
0.58
Quick ratio
Sainsbury Tesco
Efficiency: This ratio is used to measure the efficiency of the company in utilizing the assets
of the company in generating maximum sales (Arkan, 2016).
Asset turnover ratio
It measures the ability of the company with respect to generating sales by optimum
utilizing its assets. The ratio of Sainsbury is below that of Tesco which mean sit is not
effective in utilizing its assets.
2016 2017 2018 2019 2020
0.00
0.20
0.40
0.60
0.80
1.00
1.20
1.40
1.60 1.38 1.31 1.29 1.23
1.04
1.23 1.22 1.28
1.12
1.24
Asset turnover ratio
Sainsbury Tesco
Inventory turnover ratio
It refers to how many times the inventory of the company has been sold off in an
accounting year. This ratio of Tesco is 24.64 times increasing trend, in contrast to it,
Sainsbury has shown decline to 15.49 times in 2020.
End of preview
Want to access all the pages? Upload your documents or become a member.
Related Documents
MANAGEMENT Paradigm Shift in Life Name of the student Name of the university Authorlg...
|3
|474
|192
Self-Reflection and Workplace Behavior in Marketing: A Personal SWOT Analysislg...
|10
|1864
|186
E-Portfolio for Reflective Learning and Career Growth | Deskliblg...
|9
|1772
|463
Reflective Statement on Personal and Professional Developmentlg...
|4
|826
|69
Improving Group Working Skillslg...
|20
|4868
|83
Self Reflection Writing Assignmentlg...
|5
|1337
|130