MANAGING FINANCIAL RESOURCES AND DECISON MAKING TABLE OF CONTENTS Task 13
20 Pages3797 Words267 Views
Added on 2019-12-03
About This Document
• Issue of debentures: Every business unit has an option to raise debentures for acquisition of funds.The debt fund helpsin acquisition of large amount of funds so as to meet its capital requirements for long-term.
MANAGING FINANCIAL RESOURCES AND DECISON MAKING TABLE OF CONTENTS Task 13
Added on 2019-12-03
ShareRelated Documents
MANAGING FINANCIAL
RESOURCES AND DECISON
MAKING
RESOURCES AND DECISON
MAKING
TABLE OF CONTENTS
Introduction ...............................................................................................................................3
Task 1.........................................................................................................................................3
1.1 Sources of finance available to Sweet Menu Restaurant Ltd. ........................................3
1.2 Implications of sources of finance ..................................................................................4
1.3 Appropriate sources of finance........................................................................................5
TASK 2 ....................................................................................................................................5
2.1 Cost of different sources of finance.................................................................................5
2.2 Importance of financial planning.....................................................................................5
2.3 Information needs of different decisions makers............................................................6
2.4 Impact of sources of finance on the firm financial statements........................................6
TASK 3......................................................................................................................................7
3.1 Analysis of budget...........................................................................................................7
3.2 Calculation of meal cost..................................................................................................8
3.3 Project evaluation techniques..........................................................................................8
TASK 4......................................................................................................................................9
4.1 Main financial statements................................................................................................9
4.2 Financial statements of different business.....................................................................10
4.3 Ratio analysis.................................................................................................................16
CONCLUSION........................................................................................................................18
REFERENCES.........................................................................................................................19
INDEX OF TABLES
Table 1: Implications of sources of finance...............................................................................4
Table 2: Income statement.........................................................................................................6
Table 3: Balance sheet as at 31 December, 2014.......................................................................7
Table 4: Analysis of budget........................................................................................................7
Table 5: Calculation of unit cost................................................................................................8
Table 6: Calculation of payback period.....................................................................................8
Table 7: Calculation of NPV......................................................................................................9
Table 8: Ratio analysis of Sweet menu and Blue Island restaurant.........................................16
INTRODUCTION
An efficient management of financial resources is considered to be highly important
for determining the success of an organization. It is essential for the business unit to
efficiently manage and administer the financial resources. The organization should conduct
an in-depth evaluation of various sources of finance so as to select the most suitable one.
Moreover, it is essential for the organization to judge the viability of various projects before
making investments into the same. The report proposed herewith emphasizes on identifying
ways through which financial resources are managed in an efficient manner within the
organization. It is through analysis of various cases that the monetary decisions within the
business unit are evaluated.
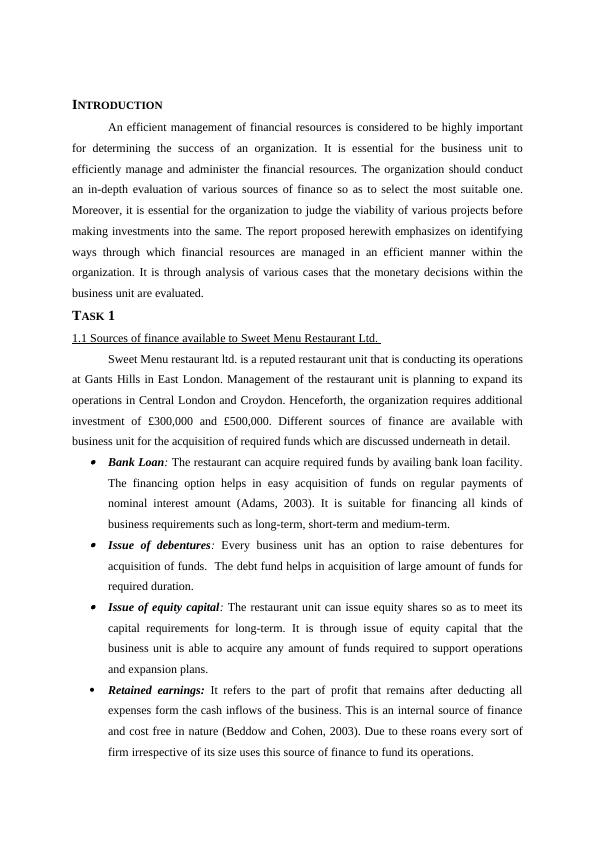
TASK 1
1.1 Sources of finance available to Sweet Menu Restaurant Ltd.
Sweet Menu restaurant ltd. is a reputed restaurant unit that is conducting its operations
at Gants Hills in East London. Management of the restaurant unit is planning to expand its
operations in Central London and Croydon. Henceforth, the organization requires additional
investment of £300,000 and £500,000. Different sources of finance are available with
business unit for the acquisition of required funds which are discussed underneath in detail.
Bank Loan: The restaurant can acquire required funds by availing bank loan facility.
The financing option helps in easy acquisition of funds on regular payments of
nominal interest amount (Adams, 2003). It is suitable for financing all kinds of
business requirements such as long-term, short-term and medium-term.
Issue of debentures: Every business unit has an option to raise debentures for
acquisition of funds. The debt fund helps in acquisition of large amount of funds for
required duration.
Issue of equity capital: The restaurant unit can issue equity shares so as to meet its
capital requirements for long-term. It is through issue of equity capital that the
business unit is able to acquire any amount of funds required to support operations
and expansion plans.
Retained earnings: It refers to the part of profit that remains after deducting all
expenses form the cash inflows of the business. This is an internal source of finance
and cost free in nature (Beddow and Cohen, 2003). Due to these roans every sort of
firm irrespective of its size uses this source of finance to fund its operations.
An efficient management of financial resources is considered to be highly important
for determining the success of an organization. It is essential for the business unit to
efficiently manage and administer the financial resources. The organization should conduct
an in-depth evaluation of various sources of finance so as to select the most suitable one.
Moreover, it is essential for the organization to judge the viability of various projects before
making investments into the same. The report proposed herewith emphasizes on identifying
ways through which financial resources are managed in an efficient manner within the
organization. It is through analysis of various cases that the monetary decisions within the
business unit are evaluated.
TASK 1
1.1 Sources of finance available to Sweet Menu Restaurant Ltd.
Sweet Menu restaurant ltd. is a reputed restaurant unit that is conducting its operations
at Gants Hills in East London. Management of the restaurant unit is planning to expand its
operations in Central London and Croydon. Henceforth, the organization requires additional
investment of £300,000 and £500,000. Different sources of finance are available with
business unit for the acquisition of required funds which are discussed underneath in detail.
Bank Loan: The restaurant can acquire required funds by availing bank loan facility.
The financing option helps in easy acquisition of funds on regular payments of
nominal interest amount (Adams, 2003). It is suitable for financing all kinds of
business requirements such as long-term, short-term and medium-term.
Issue of debentures: Every business unit has an option to raise debentures for
acquisition of funds. The debt fund helps in acquisition of large amount of funds for
required duration.
Issue of equity capital: The restaurant unit can issue equity shares so as to meet its
capital requirements for long-term. It is through issue of equity capital that the
business unit is able to acquire any amount of funds required to support operations
and expansion plans.
Retained earnings: It refers to the part of profit that remains after deducting all
expenses form the cash inflows of the business. This is an internal source of finance
and cost free in nature (Beddow and Cohen, 2003). Due to these roans every sort of
firm irrespective of its size uses this source of finance to fund its operations.
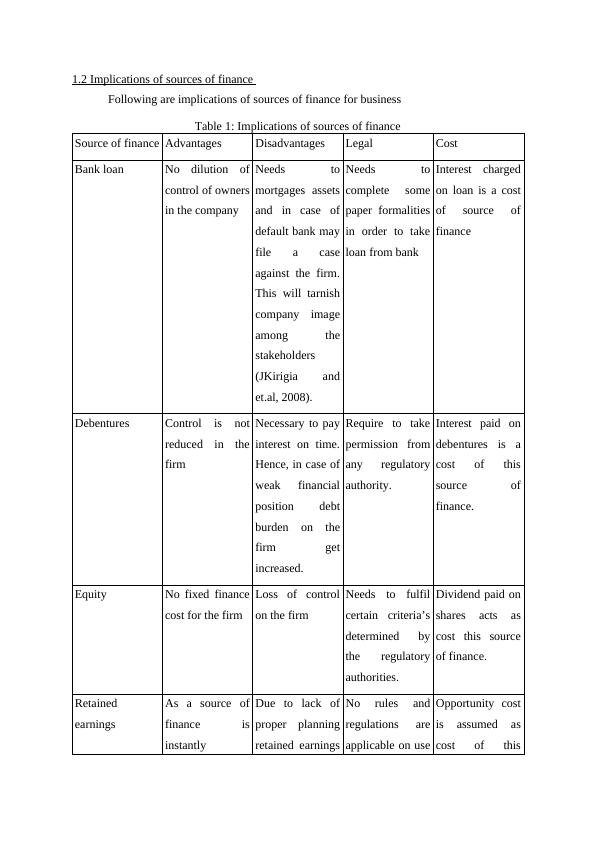
1.2 Implications of sources of finance
Following are implications of sources of finance for business
Table 1: Implications of sources of finance
Source of finance Advantages Disadvantages Legal Cost
Bank loan No dilution of
control of owners
in the company
Needs to
mortgages assets
and in case of
default bank may
file a case
against the firm.
This will tarnish
company image
among the
stakeholders
(JKirigia and
et.al, 2008).
Needs to
complete some
paper formalities
in order to take
loan from bank
Interest charged
on loan is a cost
of source of
finance
Debentures Control is not
reduced in the
firm
Necessary to pay
interest on time.
Hence, in case of
weak financial
position debt
burden on the
firm get
increased.
Require to take
permission from
any regulatory
authority.
Interest paid on
debentures is a
cost of this
source of
finance.
Equity No fixed finance
cost for the firm
Loss of control
on the firm
Needs to fulfil
certain criteria’s
determined by
the regulatory
authorities.
Dividend paid on
shares acts as
cost this source
of finance.
Retained
earnings
As a source of
finance is
instantly
Due to lack of
proper planning
retained earnings
No rules and
regulations are
applicable on use
Opportunity cost
is assumed as
cost of this
End of preview
Want to access all the pages? Upload your documents or become a member.
Related Documents
Financial Planning in Sweet Menu Restaurant Ltd | Reportlg...
|15
|4460
|438
MANAGING FINANCIAL RESORCES AND DECISION INTRODUCTIONlg...
|23
|5627
|386
(solved) Assignment Managing Financial resources and decisionslg...
|19
|5342
|33
Project Of Sweet Menu Restaurant - Sources Of Finance & Implicationslg...
|20
|6727
|96
Managing Financial Resources and Decisions | Projectlg...
|18
|5575
|47
(solved) Managing Financial Resources and Decisionslg...
|17
|5116
|74