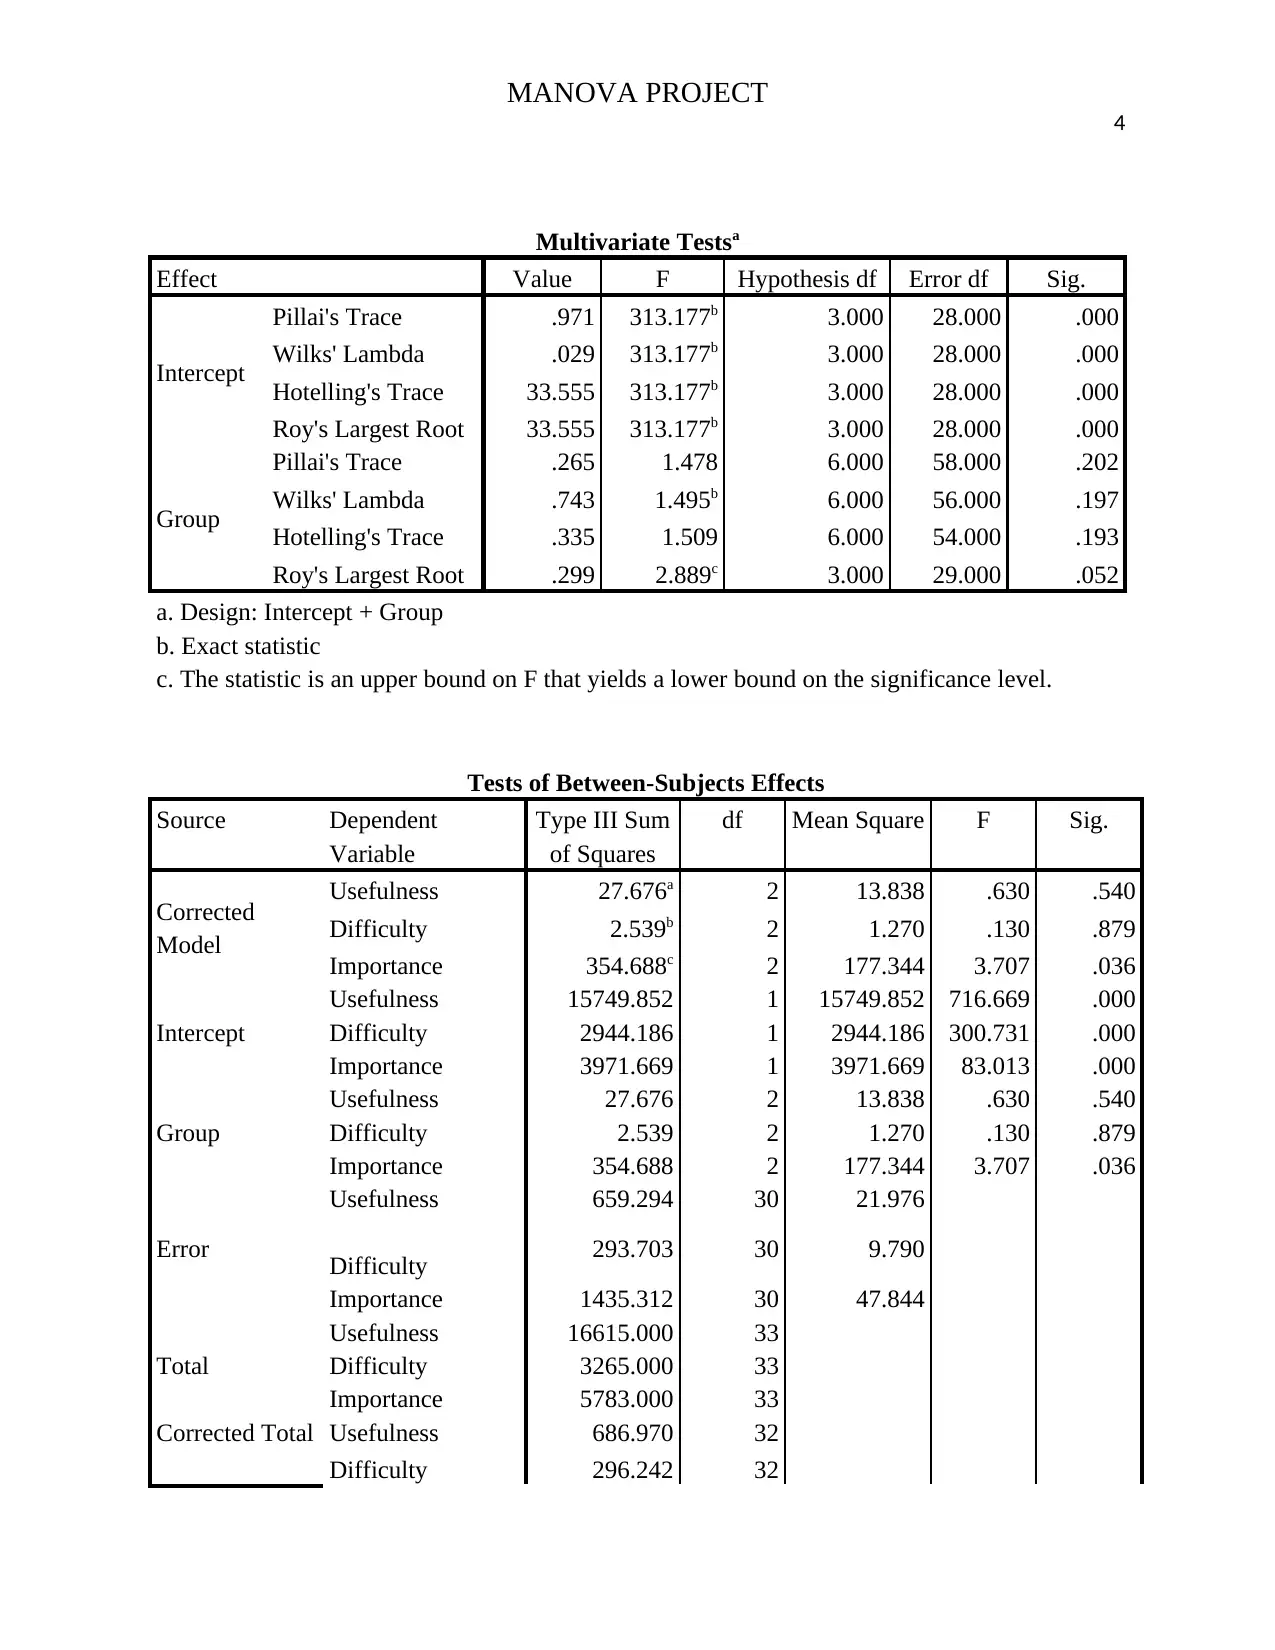
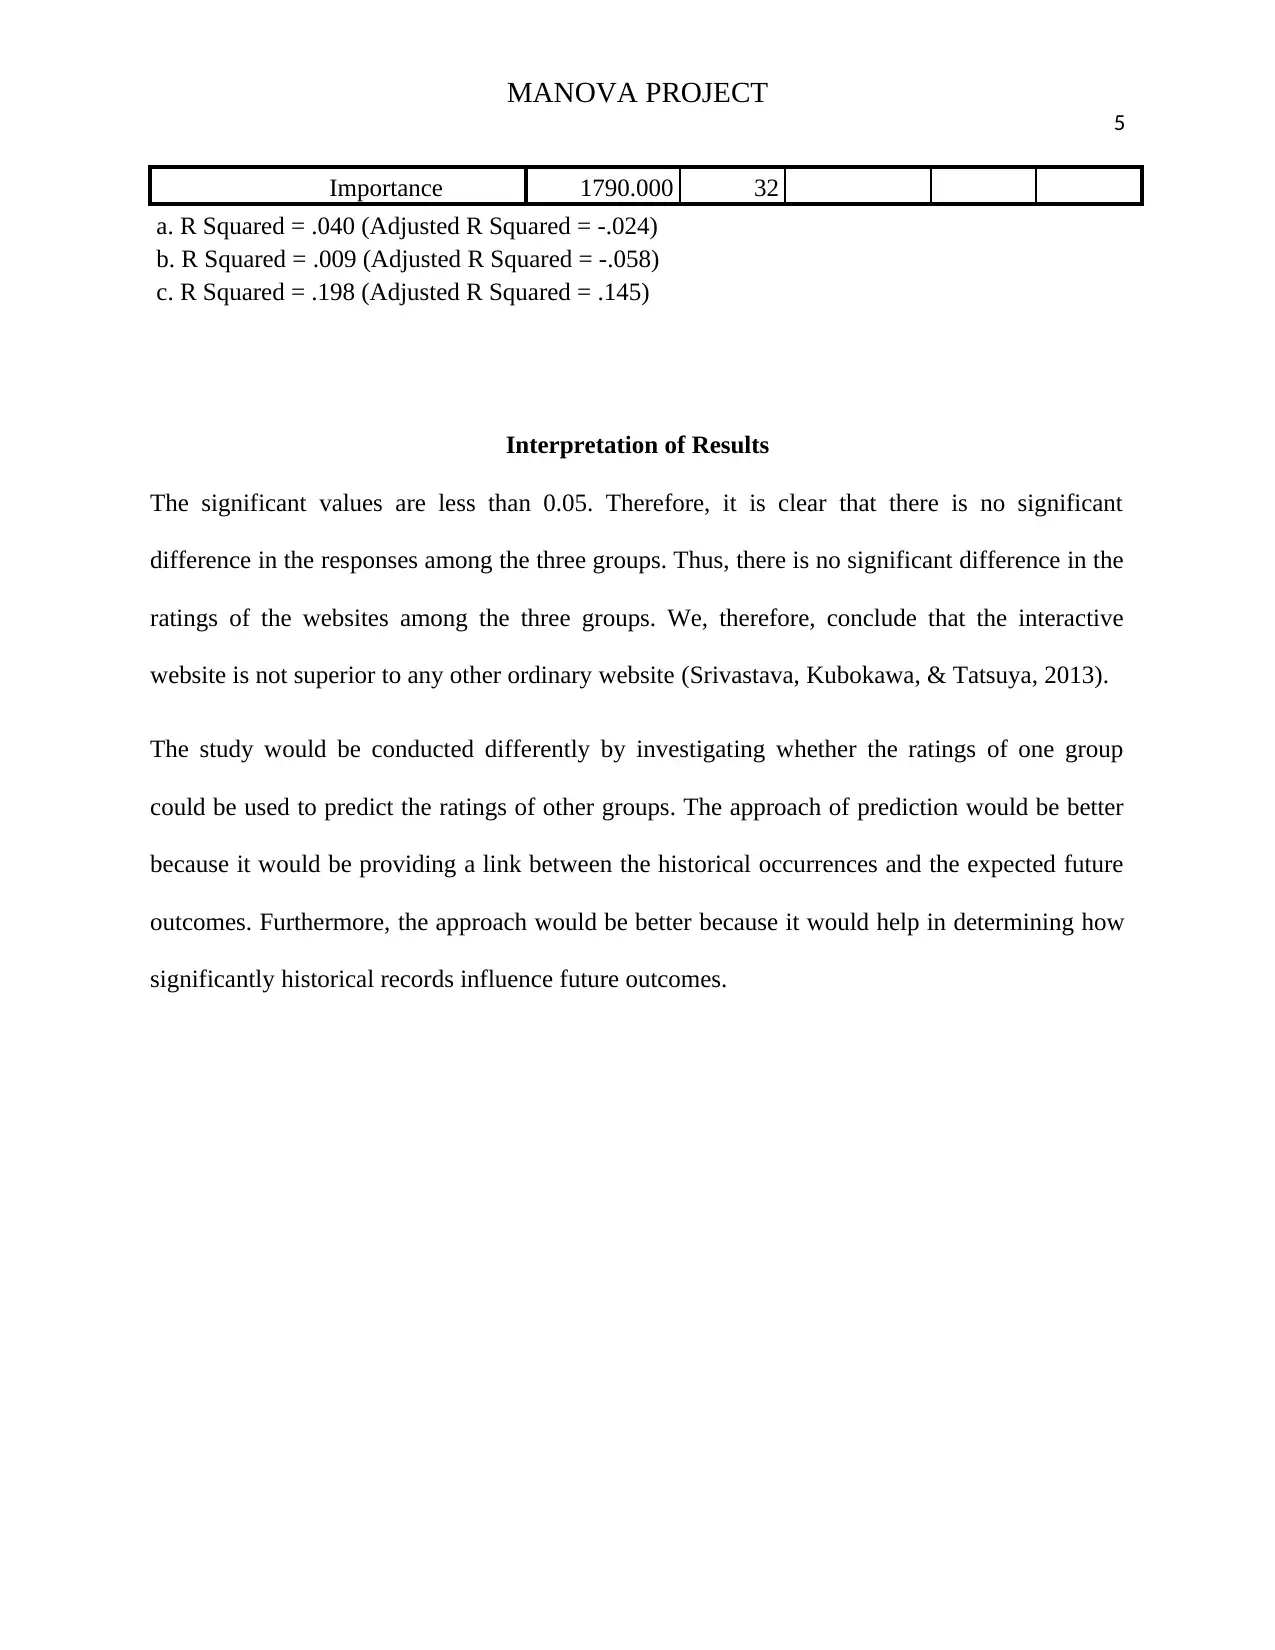
The study looks at three different ratings of the presentation; difficulty, usefulness, and importance to determine if there is a difference in the modes of presentation. The major aim of this study is to investigate whether the interactive website is superior because that is the most cost-effective way of delivering the information. The study has applied the use of multivariate analysis of variance to meet the objective. A multivariate analysis of variance (MANOVA) is a technique that applied to comparing multivariate means. Multivariate analysis of variance is suitable for use in this study because the variables are from different samples. Moreover, the study seeks to establish whether there is any significant difference in the means of the groups. The data set consists of three groups (group 1, group 2 and group 3). The data sets meets the assumptions that are necessary for conducting a multivariate analysis of variance. For example, the data set consists of three independent variables which are measured in intervals. The three groups consist of categorical variables. There are no outliers and the sample size is adequate to conduct a multivariate analysis of variance. The significant values are less than 0.05. Therefore, it is clear that there is no significant difference in the responses among the three groups. Thus, there is no significant difference in the ratings of the websites among the three groups. We, therefore, conclude that the interactive website is not superior to any other ordinary website. The study would be conducted differently by investigating whether the ratings of one group could be used to predict the ratings of other groups. The approach of prediction would be better because it would be providing a link between the historical occurrences and the expected future outcomes. Furthermore, the approach would be better because it would help in determining how significantly historical records influence future outcomes.
![[object Object]](/_next/static/media/star-bottom.7253800d.svg)