Manu 1398 – Assignment 1 | International Engineering Management
VerifiedAdded on 2022/09/09
|21
|3603
|15
AI Summary
Contribute Materials
Your contribution can guide someone’s learning journey. Share your
documents today.
Running Head: INTERNATIONAL ENGINEERING MANAGEMENT
MANU 1398 – Assignment 1
Name of the Student
Name of the University
MANU 1398 – Assignment 1
Name of the Student
Name of the University
Secure Best Marks with AI Grader
Need help grading? Try our AI Grader for instant feedback on your assignments.
1INTERNATIONAL ENGINEERING MANAGEMENT
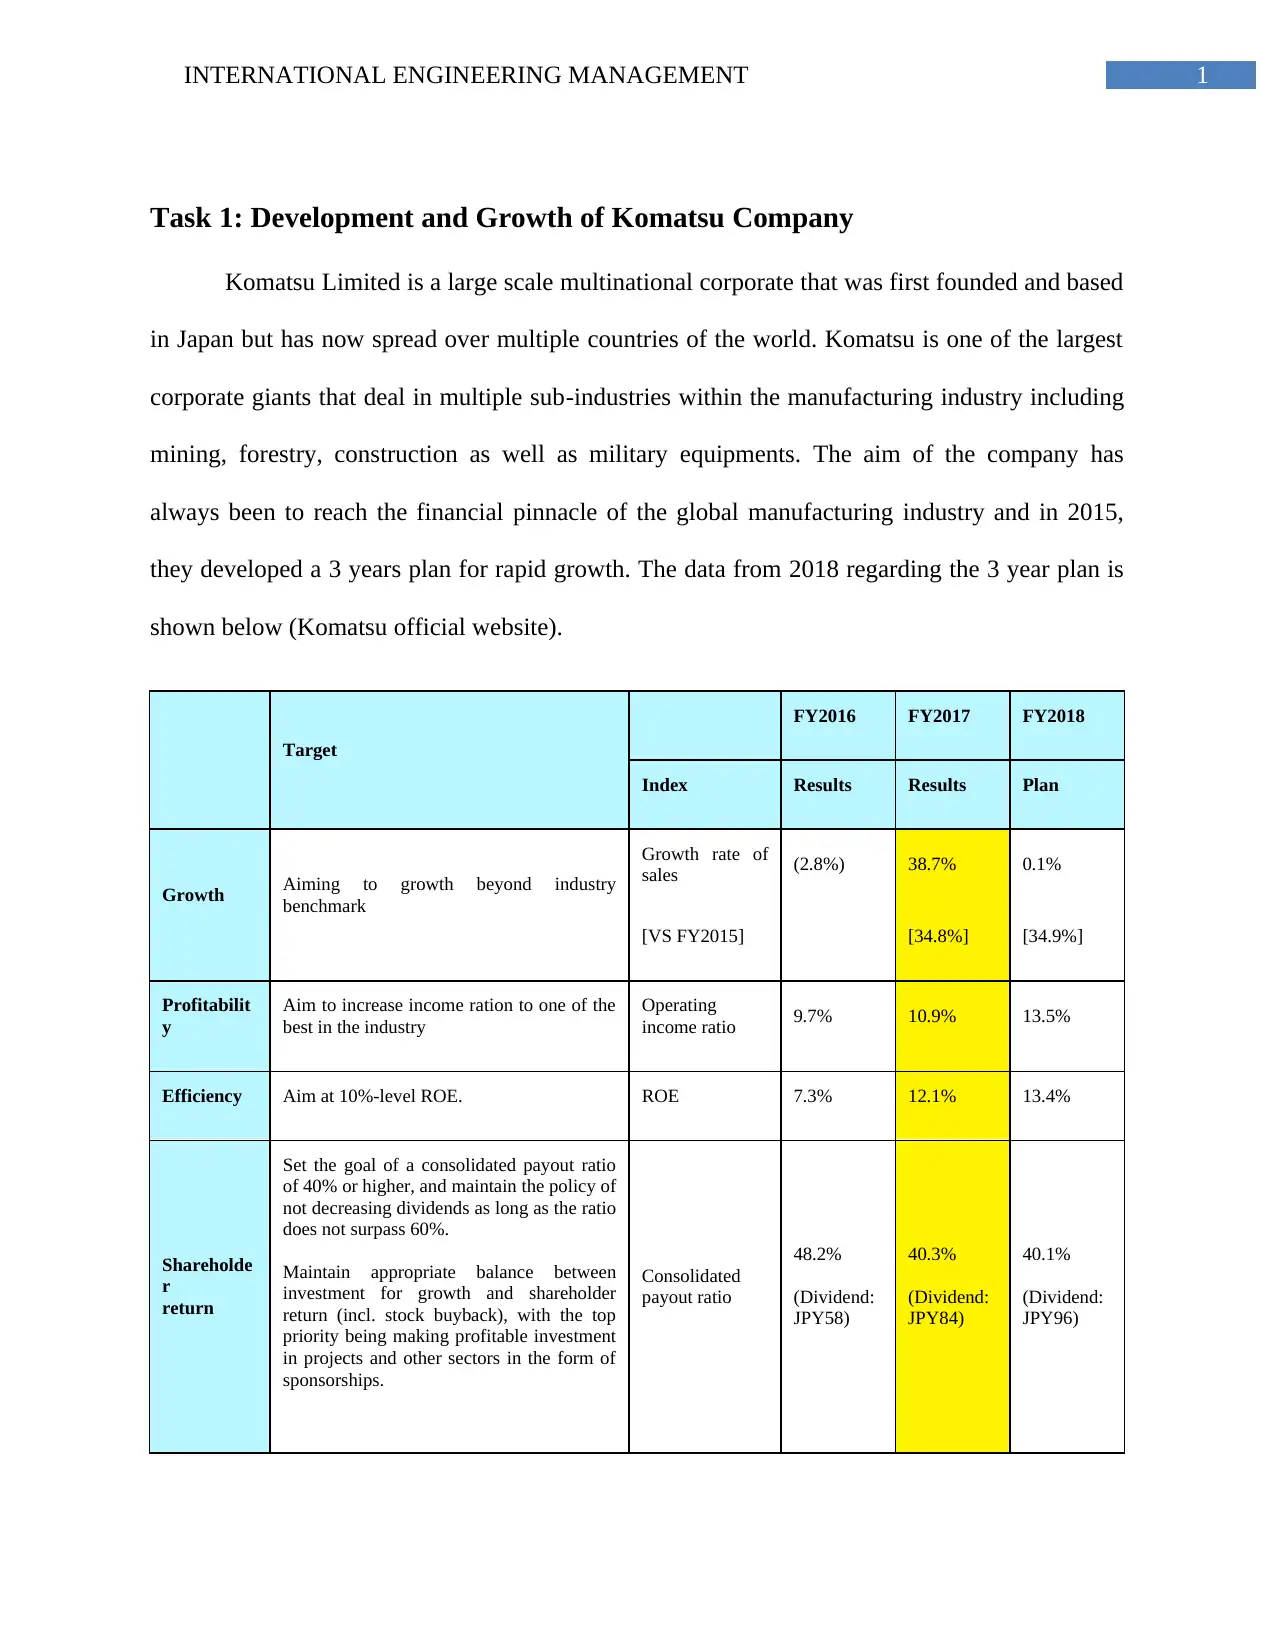
Task 1: Development and Growth of Komatsu Company
Komatsu Limited is a large scale multinational corporate that was first founded and based
in Japan but has now spread over multiple countries of the world. Komatsu is one of the largest
corporate giants that deal in multiple sub-industries within the manufacturing industry including
mining, forestry, construction as well as military equipments. The aim of the company has
always been to reach the financial pinnacle of the global manufacturing industry and in 2015,
they developed a 3 years plan for rapid growth. The data from 2018 regarding the 3 year plan is
shown below (Komatsu official website).
Target
FY2016 FY2017 FY2018
Index Results Results Plan
Growth Aiming to growth beyond industry
benchmark
Growth rate of
sales (2.8%) 38.7% 0.1%
[VS FY2015] [34.8%] [34.9%]
Profitabilit
y
Aim to increase income ration to one of the
best in the industry
Operating
income ratio 9.7% 10.9% 13.5%
Efficiency Aim at 10%-level ROE. ROE 7.3% 12.1% 13.4%
Shareholde
r
return
Set the goal of a consolidated payout ratio
of 40% or higher, and maintain the policy of
not decreasing dividends as long as the ratio
does not surpass 60%.
Maintain appropriate balance between
investment for growth and shareholder
return (incl. stock buyback), with the top
priority being making profitable investment
in projects and other sectors in the form of
sponsorships.
Consolidated
payout ratio
48.2%
(Dividend:
JPY58)
40.3%
(Dividend:
JPY84)
40.1%
(Dividend:
JPY96)
2INTERNATIONAL ENGINEERING MANAGEMENT
Financial
position
Reach top level financial position in the
industry Net D/E ratio 0.18 0.40 ー
.
Retail finance
business
ROA: 2.0% or above ROA 0.7% 1.9% ー
5.0 or under for net D/E ratio Net D/E ratio 3.65 3.50 ー
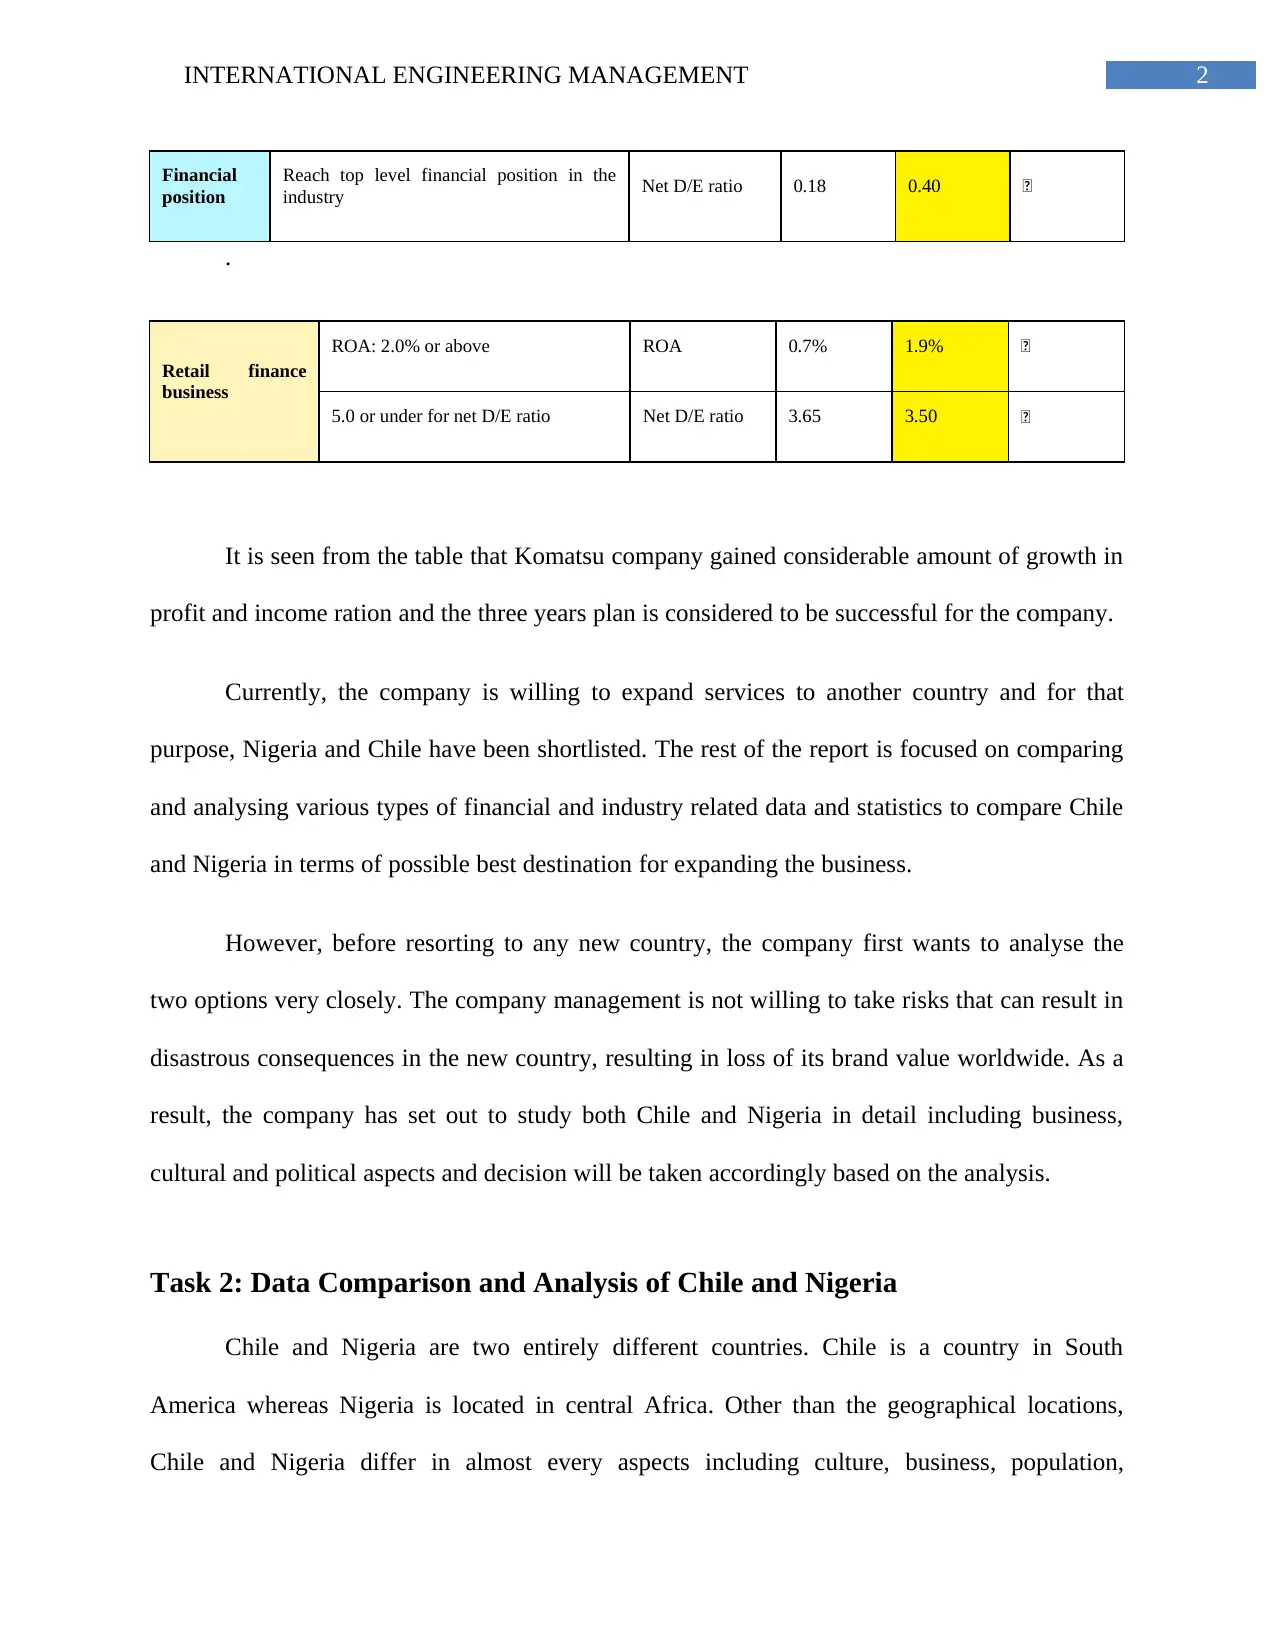
It is seen from the table that Komatsu company gained considerable amount of growth in
profit and income ration and the three years plan is considered to be successful for the company.
Currently, the company is willing to expand services to another country and for that
purpose, Nigeria and Chile have been shortlisted. The rest of the report is focused on comparing
and analysing various types of financial and industry related data and statistics to compare Chile
and Nigeria in terms of possible best destination for expanding the business.
However, before resorting to any new country, the company first wants to analyse the
two options very closely. The company management is not willing to take risks that can result in
disastrous consequences in the new country, resulting in loss of its brand value worldwide. As a
result, the company has set out to study both Chile and Nigeria in detail including business,
cultural and political aspects and decision will be taken accordingly based on the analysis.
Task 2: Data Comparison and Analysis of Chile and Nigeria
Chile and Nigeria are two entirely different countries. Chile is a country in South
America whereas Nigeria is located in central Africa. Other than the geographical locations,
Chile and Nigeria differ in almost every aspects including culture, business, population,
Financial
position
Reach top level financial position in the
industry Net D/E ratio 0.18 0.40 ー
.
Retail finance
business
ROA: 2.0% or above ROA 0.7% 1.9% ー
5.0 or under for net D/E ratio Net D/E ratio 3.65 3.50 ー
It is seen from the table that Komatsu company gained considerable amount of growth in
profit and income ration and the three years plan is considered to be successful for the company.
Currently, the company is willing to expand services to another country and for that
purpose, Nigeria and Chile have been shortlisted. The rest of the report is focused on comparing
and analysing various types of financial and industry related data and statistics to compare Chile
and Nigeria in terms of possible best destination for expanding the business.
However, before resorting to any new country, the company first wants to analyse the
two options very closely. The company management is not willing to take risks that can result in
disastrous consequences in the new country, resulting in loss of its brand value worldwide. As a
result, the company has set out to study both Chile and Nigeria in detail including business,
cultural and political aspects and decision will be taken accordingly based on the analysis.
Task 2: Data Comparison and Analysis of Chile and Nigeria
Chile and Nigeria are two entirely different countries. Chile is a country in South
America whereas Nigeria is located in central Africa. Other than the geographical locations,
Chile and Nigeria differ in almost every aspects including culture, business, population,
3INTERNATIONAL ENGINEERING MANAGEMENT
development, industry, politics and others. Chile is one of the most developed countries of the
world, on the verge of becoming a first world country whereas Nigeria belongs to the category of
developing / third world country. If a company wants to do business in a new country and have
Chile or Nigeria as the possible options, there are a lot of differences that need to be considered
before establishing the business. These factors are as follows.
Culture: There is a huge cultural difference between Chile and Nigeria. The cultural
differences include language, philosophy, outlook, ideas and many others. Both the cultures can
have positive and negative aspects and it is important for the company to select which one suits
their own business philosophy and alignment more.
Monetary Status: Monetary status is one the major factors to be considered while starting
business in a new country. While Chile’s monetary status is considerably high as compared to
Nigeria, Chile looks to be a better position if the two are considered to be candidates for new
business opening. However, low monetary status of Nigeria means availability of more cheap
labour that will significantly help the company set up and run easily without unreasonable
investments.
Business Potential: Following the monetary status, business potential is another
important factor. In business potential, a lot of sub factors come into play including availability
of cheap labour, production cost, export import cost, market demand and profitability and others.
Politics: Political factors play major roles in any business. In Nigeria, politics is unstable
and there are frequent riots and terrorist attacks. On the other hand, Chile is much more stable
politically.
Secure Best Marks with AI Grader
Need help grading? Try our AI Grader for instant feedback on your assignments.
4INTERNATIONAL ENGINEERING MANAGEMENT
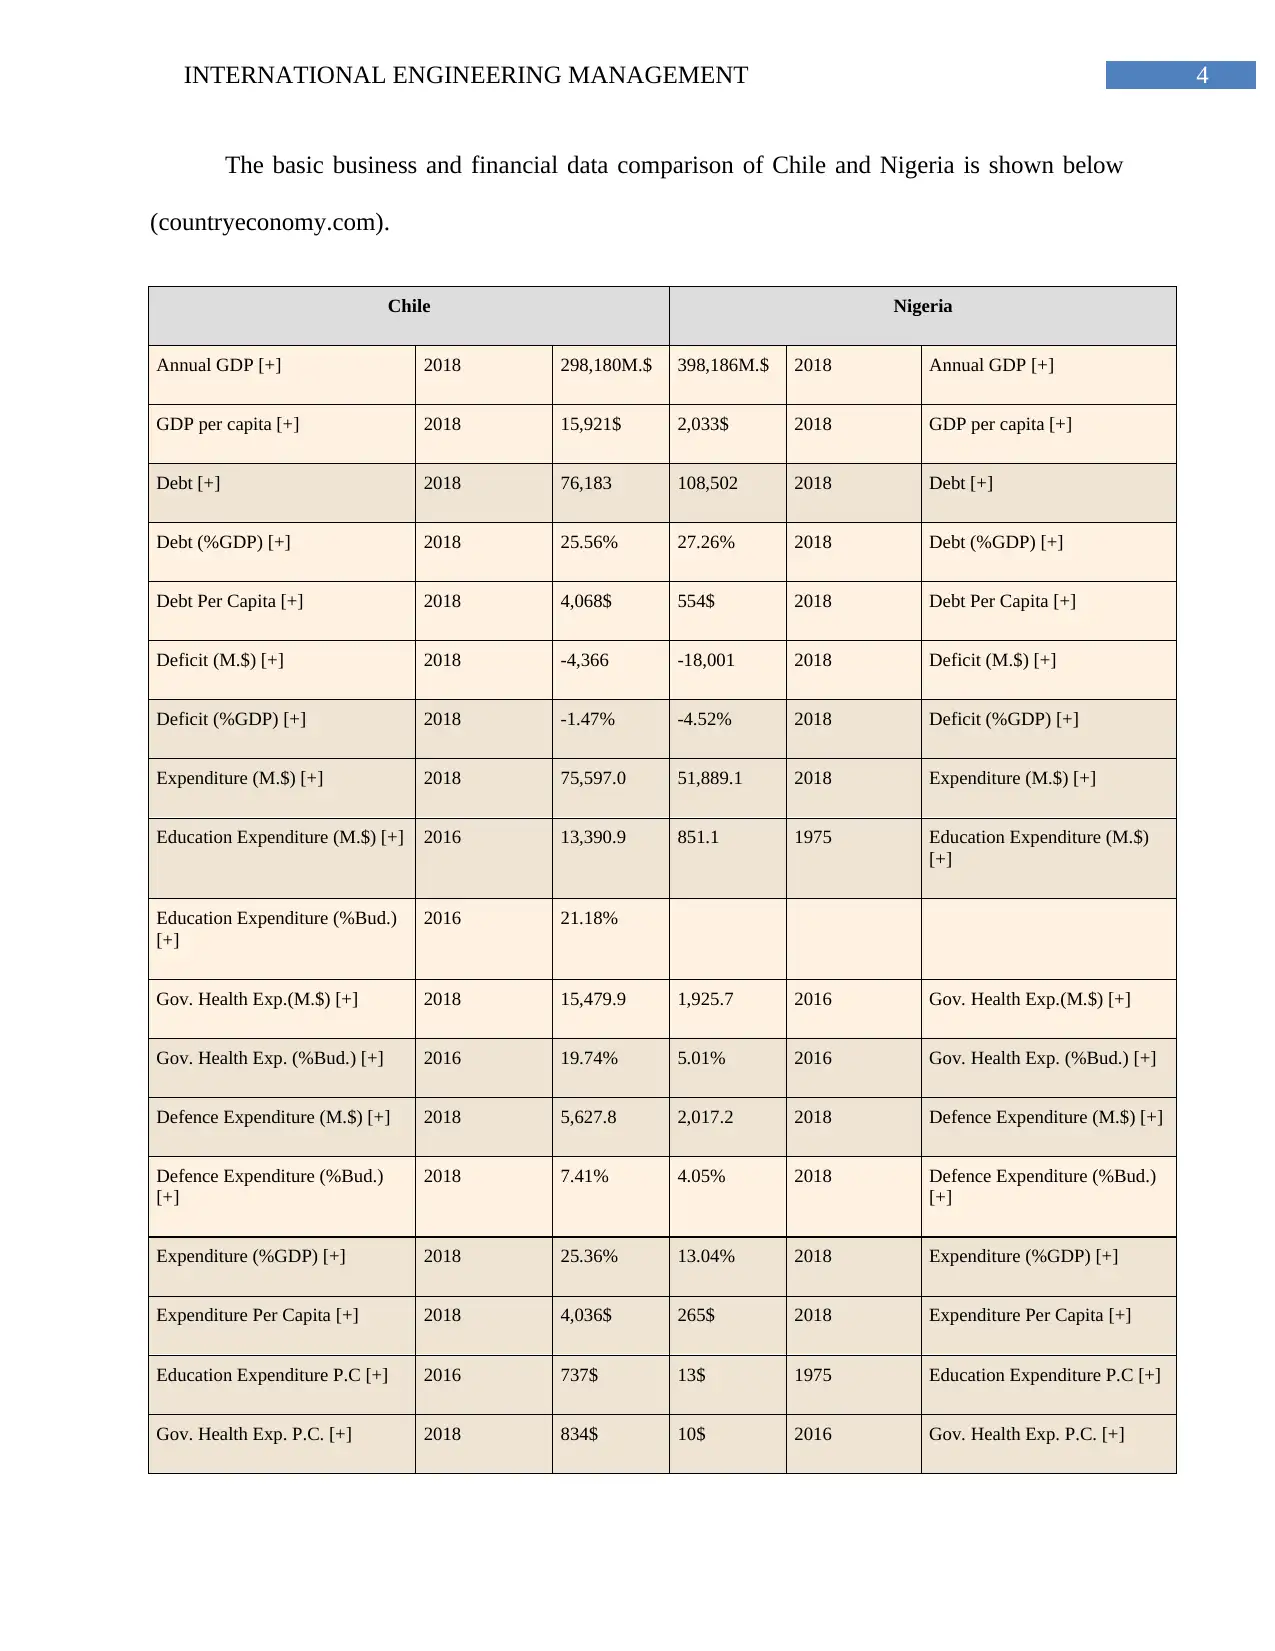
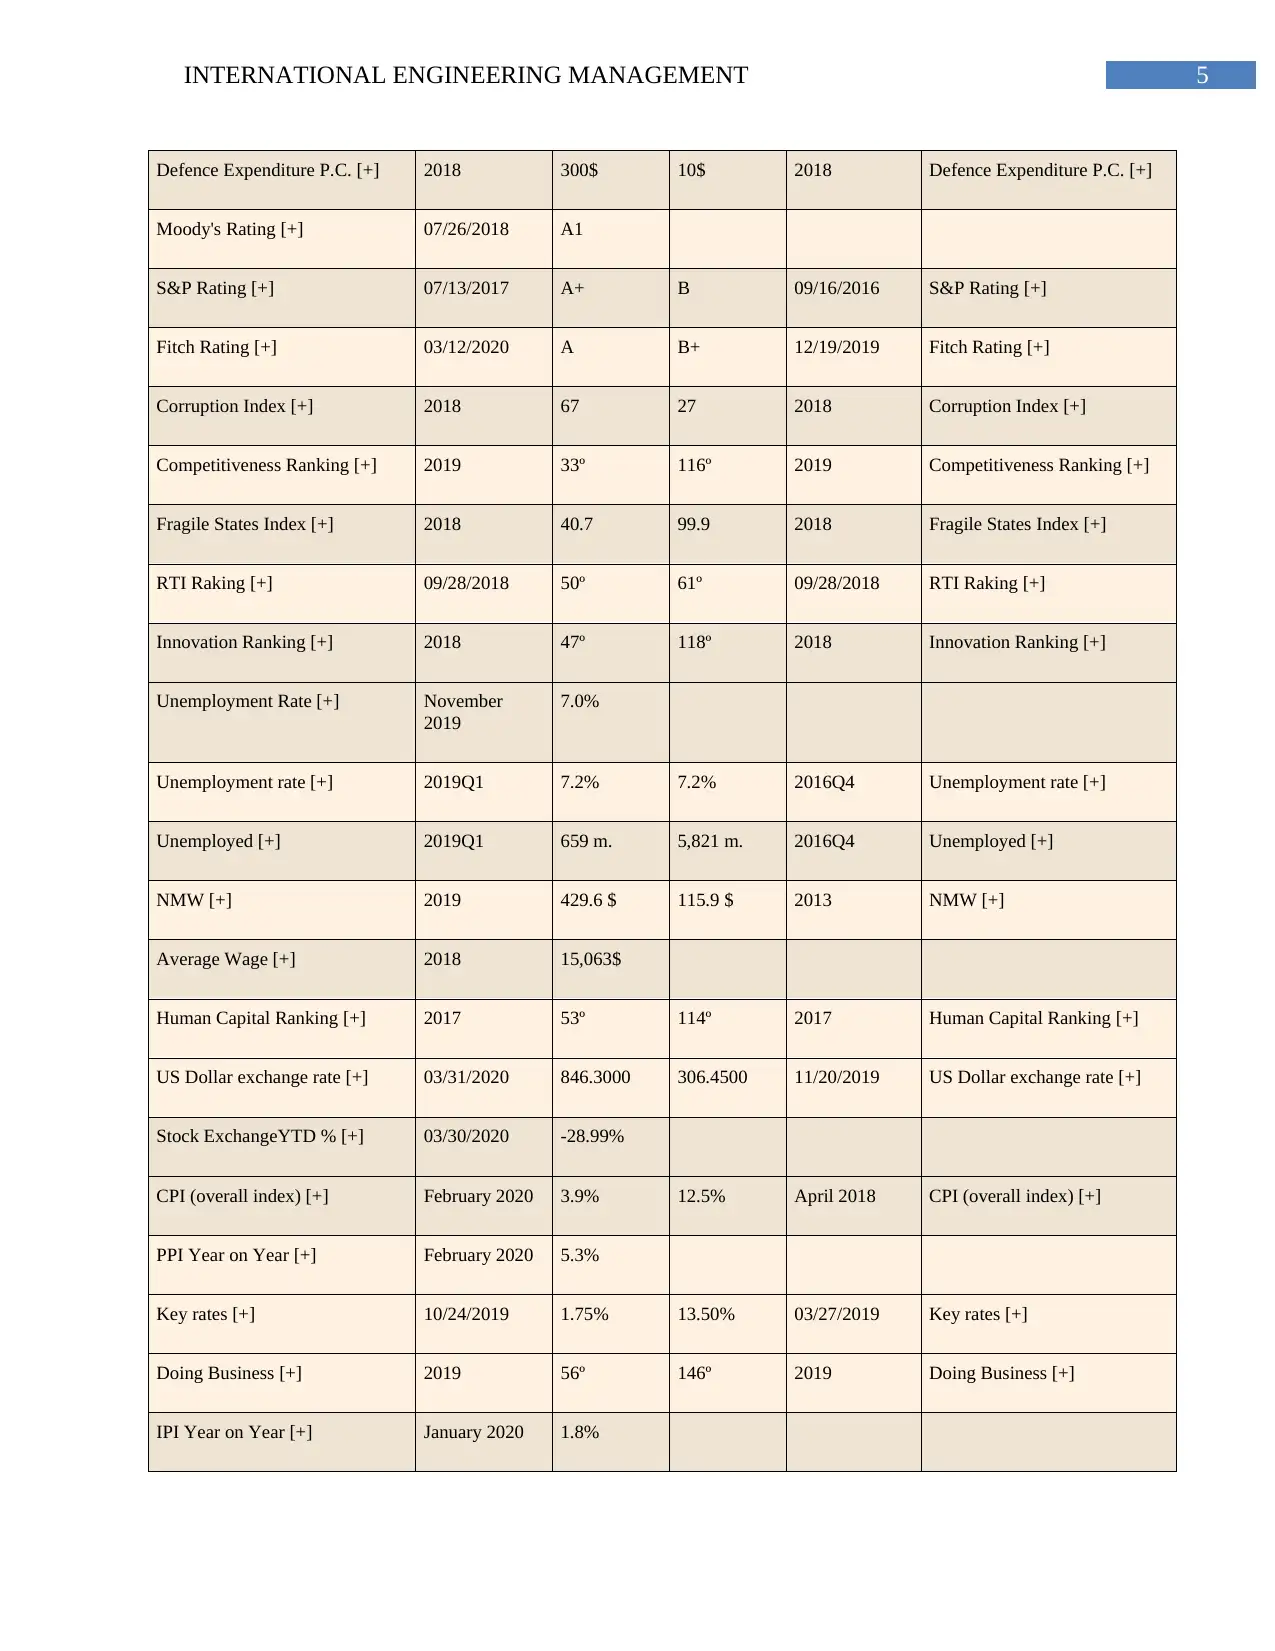
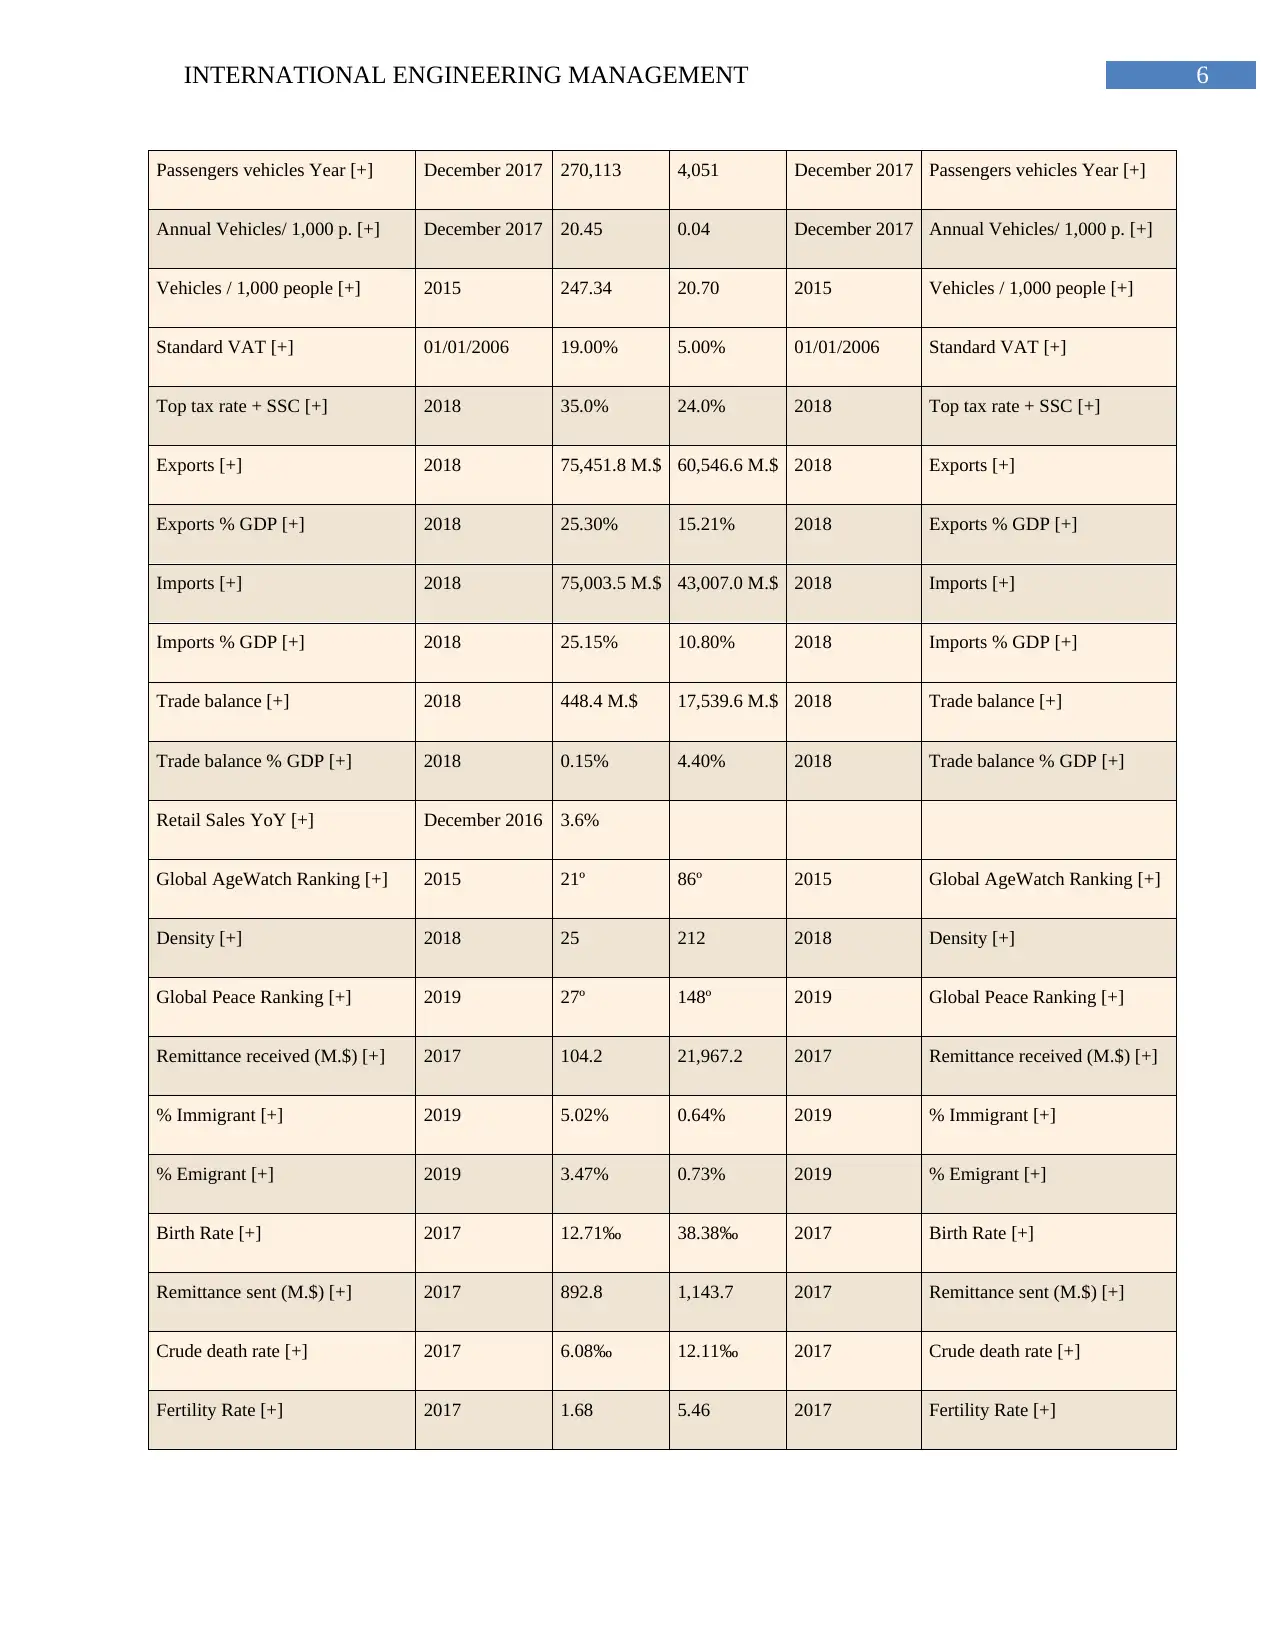
The basic business and financial data comparison of Chile and Nigeria is shown below
(countryeconomy.com).
Chile Nigeria
Annual GDP [+] 2018 298,180M.$ 398,186M.$ 2018 Annual GDP [+]
GDP per capita [+] 2018 15,921$ 2,033$ 2018 GDP per capita [+]
Debt [+] 2018 76,183 108,502 2018 Debt [+]
Debt (%GDP) [+] 2018 25.56% 27.26% 2018 Debt (%GDP) [+]
Debt Per Capita [+] 2018 4,068$ 554$ 2018 Debt Per Capita [+]
Deficit (M.$) [+] 2018 -4,366 -18,001 2018 Deficit (M.$) [+]
Deficit (%GDP) [+] 2018 -1.47% -4.52% 2018 Deficit (%GDP) [+]
Expenditure (M.$) [+] 2018 75,597.0 51,889.1 2018 Expenditure (M.$) [+]
Education Expenditure (M.$) [+] 2016 13,390.9 851.1 1975 Education Expenditure (M.$)
[+]
Education Expenditure (%Bud.)
[+]
2016 21.18%
Gov. Health Exp.(M.$) [+] 2018 15,479.9 1,925.7 2016 Gov. Health Exp.(M.$) [+]
Gov. Health Exp. (%Bud.) [+] 2016 19.74% 5.01% 2016 Gov. Health Exp. (%Bud.) [+]
Defence Expenditure (M.$) [+] 2018 5,627.8 2,017.2 2018 Defence Expenditure (M.$) [+]
Defence Expenditure (%Bud.)
[+]
2018 7.41% 4.05% 2018 Defence Expenditure (%Bud.)
[+]
Expenditure (%GDP) [+] 2018 25.36% 13.04% 2018 Expenditure (%GDP) [+]
Expenditure Per Capita [+] 2018 4,036$ 265$ 2018 Expenditure Per Capita [+]
Education Expenditure P.C [+] 2016 737$ 13$ 1975 Education Expenditure P.C [+]
Gov. Health Exp. P.C. [+] 2018 834$ 10$ 2016 Gov. Health Exp. P.C. [+]
5INTERNATIONAL ENGINEERING MANAGEMENT
Defence Expenditure P.C. [+] 2018 300$ 10$ 2018 Defence Expenditure P.C. [+]
Moody's Rating [+] 07/26/2018 A1
S&P Rating [+] 07/13/2017 A+ B 09/16/2016 S&P Rating [+]
Fitch Rating [+] 03/12/2020 A B+ 12/19/2019 Fitch Rating [+]
Corruption Index [+] 2018 67 27 2018 Corruption Index [+]
Competitiveness Ranking [+] 2019 33º 116º 2019 Competitiveness Ranking [+]
Fragile States Index [+] 2018 40.7 99.9 2018 Fragile States Index [+]
RTI Raking [+] 09/28/2018 50º 61º 09/28/2018 RTI Raking [+]
Innovation Ranking [+] 2018 47º 118º 2018 Innovation Ranking [+]
Unemployment Rate [+] November
2019
7.0%
Unemployment rate [+] 2019Q1 7.2% 7.2% 2016Q4 Unemployment rate [+]
Unemployed [+] 2019Q1 659 m. 5,821 m. 2016Q4 Unemployed [+]
NMW [+] 2019 429.6 $ 115.9 $ 2013 NMW [+]
Average Wage [+] 2018 15,063$
Human Capital Ranking [+] 2017 53º 114º 2017 Human Capital Ranking [+]
US Dollar exchange rate [+] 03/31/2020 846.3000 306.4500 11/20/2019 US Dollar exchange rate [+]
Stock ExchangeYTD % [+] 03/30/2020 -28.99%
CPI (overall index) [+] February 2020 3.9% 12.5% April 2018 CPI (overall index) [+]
PPI Year on Year [+] February 2020 5.3%
Key rates [+] 10/24/2019 1.75% 13.50% 03/27/2019 Key rates [+]
Doing Business [+] 2019 56º 146º 2019 Doing Business [+]
IPI Year on Year [+] January 2020 1.8%
6INTERNATIONAL ENGINEERING MANAGEMENT
Passengers vehicles Year [+] December 2017 270,113 4,051 December 2017 Passengers vehicles Year [+]
Annual Vehicles/ 1,000 p. [+] December 2017 20.45 0.04 December 2017 Annual Vehicles/ 1,000 p. [+]
Vehicles / 1,000 people [+] 2015 247.34 20.70 2015 Vehicles / 1,000 people [+]
Standard VAT [+] 01/01/2006 19.00% 5.00% 01/01/2006 Standard VAT [+]
Top tax rate + SSC [+] 2018 35.0% 24.0% 2018 Top tax rate + SSC [+]
Exports [+] 2018 75,451.8 M.$ 60,546.6 M.$ 2018 Exports [+]
Exports % GDP [+] 2018 25.30% 15.21% 2018 Exports % GDP [+]
Imports [+] 2018 75,003.5 M.$ 43,007.0 M.$ 2018 Imports [+]
Imports % GDP [+] 2018 25.15% 10.80% 2018 Imports % GDP [+]
Trade balance [+] 2018 448.4 M.$ 17,539.6 M.$ 2018 Trade balance [+]
Trade balance % GDP [+] 2018 0.15% 4.40% 2018 Trade balance % GDP [+]
Retail Sales YoY [+] December 2016 3.6%
Global AgeWatch Ranking [+] 2015 21º 86º 2015 Global AgeWatch Ranking [+]
Density [+] 2018 25 212 2018 Density [+]
Global Peace Ranking [+] 2019 27º 148º 2019 Global Peace Ranking [+]
Remittance received (M.$) [+] 2017 104.2 21,967.2 2017 Remittance received (M.$) [+]
% Immigrant [+] 2019 5.02% 0.64% 2019 % Immigrant [+]
% Emigrant [+] 2019 3.47% 0.73% 2019 % Emigrant [+]
Birth Rate [+] 2017 12.71‰ 38.38‰ 2017 Birth Rate [+]
Remittance sent (M.$) [+] 2017 892.8 1,143.7 2017 Remittance sent (M.$) [+]
Crude death rate [+] 2017 6.08‰ 12.11‰ 2017 Crude death rate [+]
Fertility Rate [+] 2017 1.68 5.46 2017 Fertility Rate [+]
Paraphrase This Document
Need a fresh take? Get an instant paraphrase of this document with our AI Paraphraser
7INTERNATIONAL ENGINEERING MANAGEMENT
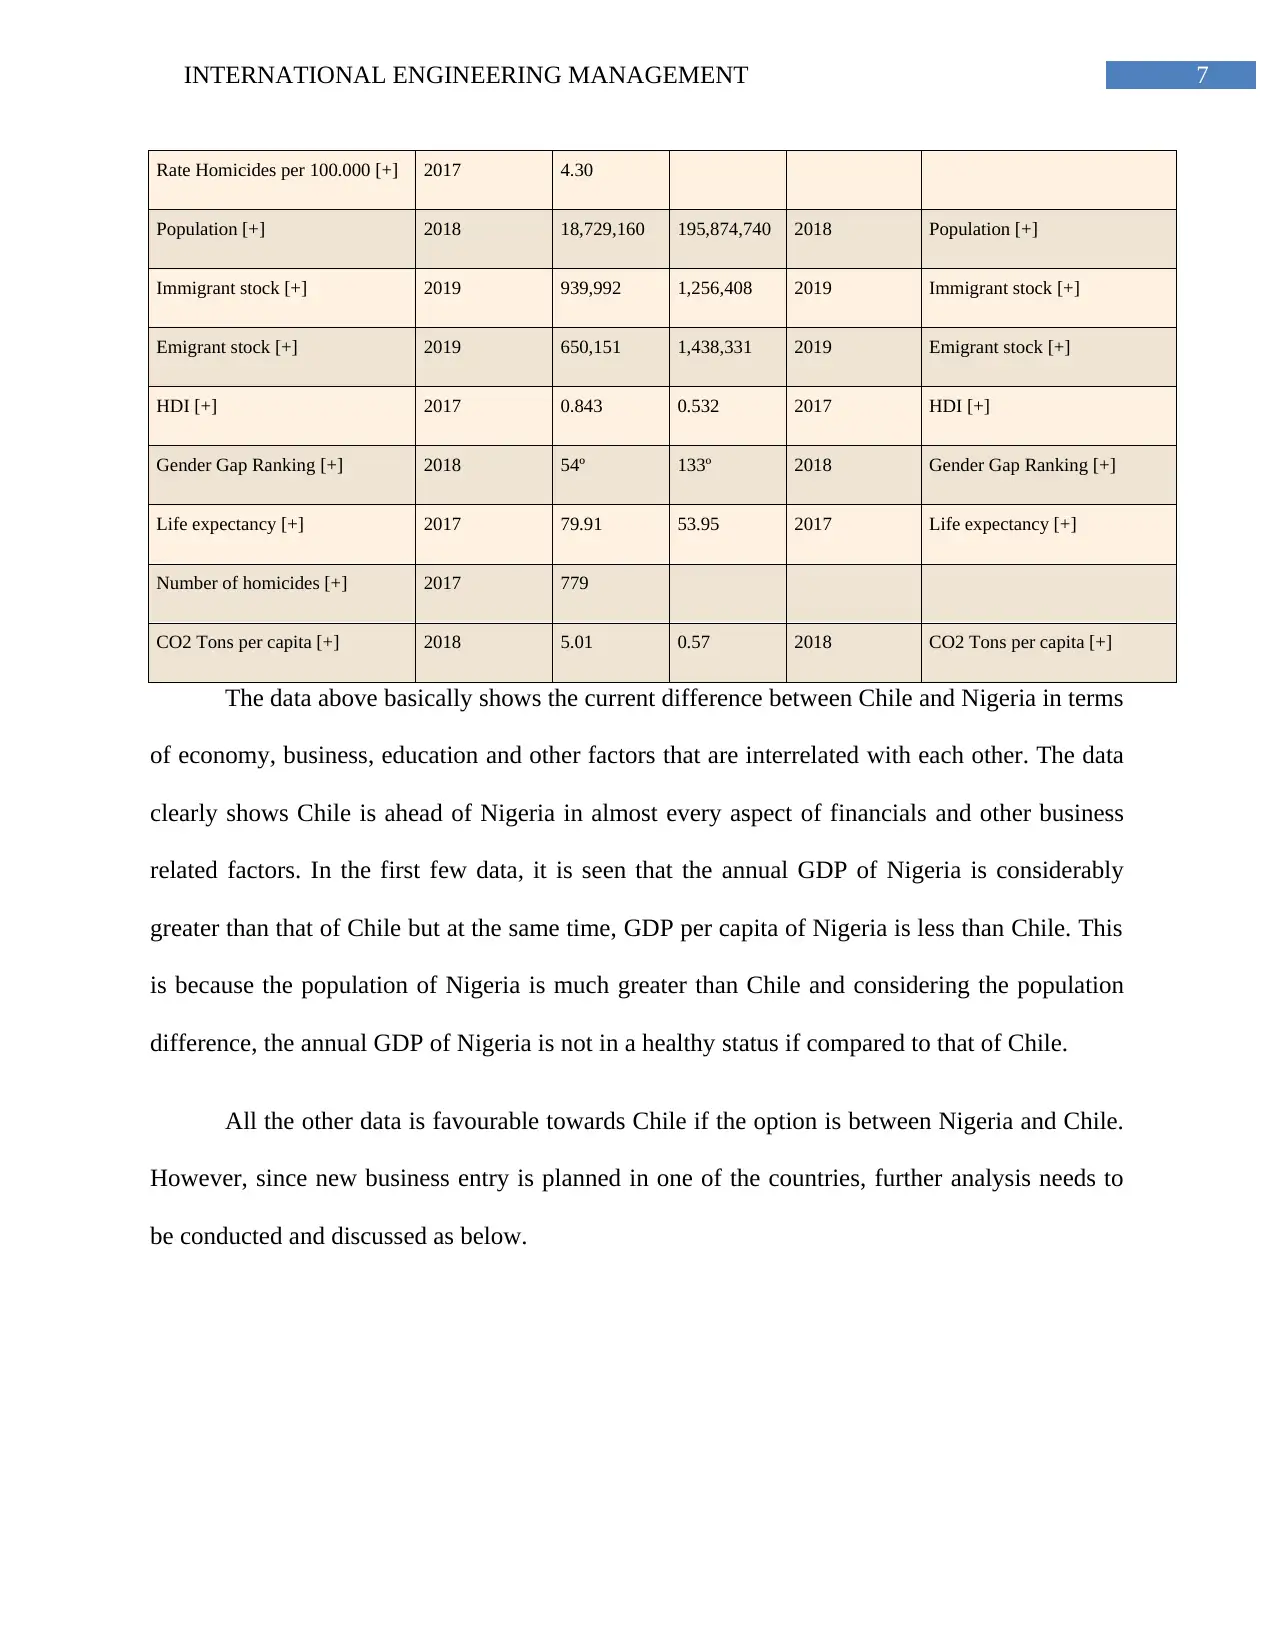
Rate Homicides per 100.000 [+] 2017 4.30
Population [+] 2018 18,729,160 195,874,740 2018 Population [+]
Immigrant stock [+] 2019 939,992 1,256,408 2019 Immigrant stock [+]
Emigrant stock [+] 2019 650,151 1,438,331 2019 Emigrant stock [+]
HDI [+] 2017 0.843 0.532 2017 HDI [+]
Gender Gap Ranking [+] 2018 54º 133º 2018 Gender Gap Ranking [+]
Life expectancy [+] 2017 79.91 53.95 2017 Life expectancy [+]
Number of homicides [+] 2017 779
CO2 Tons per capita [+] 2018 5.01 0.57 2018 CO2 Tons per capita [+]
The data above basically shows the current difference between Chile and Nigeria in terms
of economy, business, education and other factors that are interrelated with each other. The data
clearly shows Chile is ahead of Nigeria in almost every aspect of financials and other business
related factors. In the first few data, it is seen that the annual GDP of Nigeria is considerably
greater than that of Chile but at the same time, GDP per capita of Nigeria is less than Chile. This
is because the population of Nigeria is much greater than Chile and considering the population
difference, the annual GDP of Nigeria is not in a healthy status if compared to that of Chile.
All the other data is favourable towards Chile if the option is between Nigeria and Chile.
However, since new business entry is planned in one of the countries, further analysis needs to
be conducted and discussed as below.
8INTERNATIONAL ENGINEERING MANAGEMENT
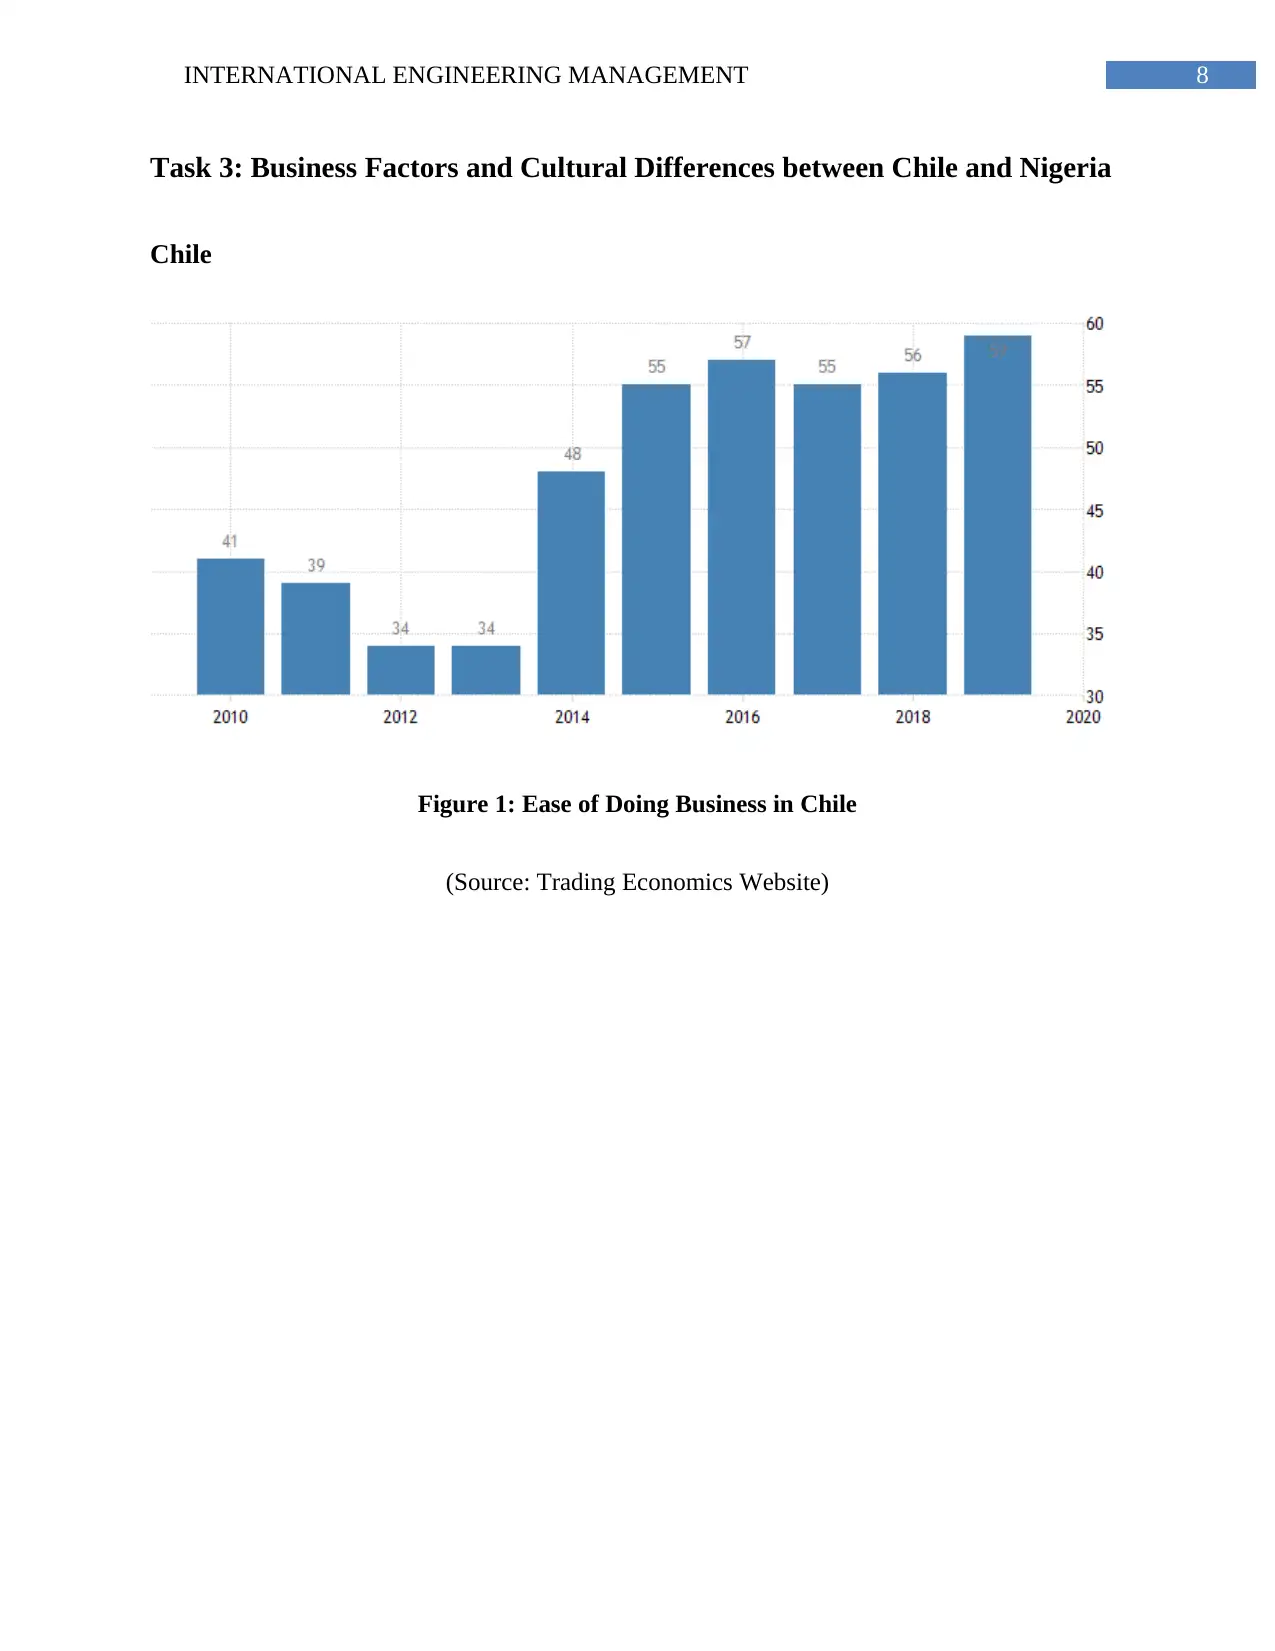
Task 3: Business Factors and Cultural Differences between Chile and Nigeria
Chile
Figure 1: Ease of Doing Business in Chile
(Source: Trading Economics Website)
Task 3: Business Factors and Cultural Differences between Chile and Nigeria
Chile
Figure 1: Ease of Doing Business in Chile
(Source: Trading Economics Website)
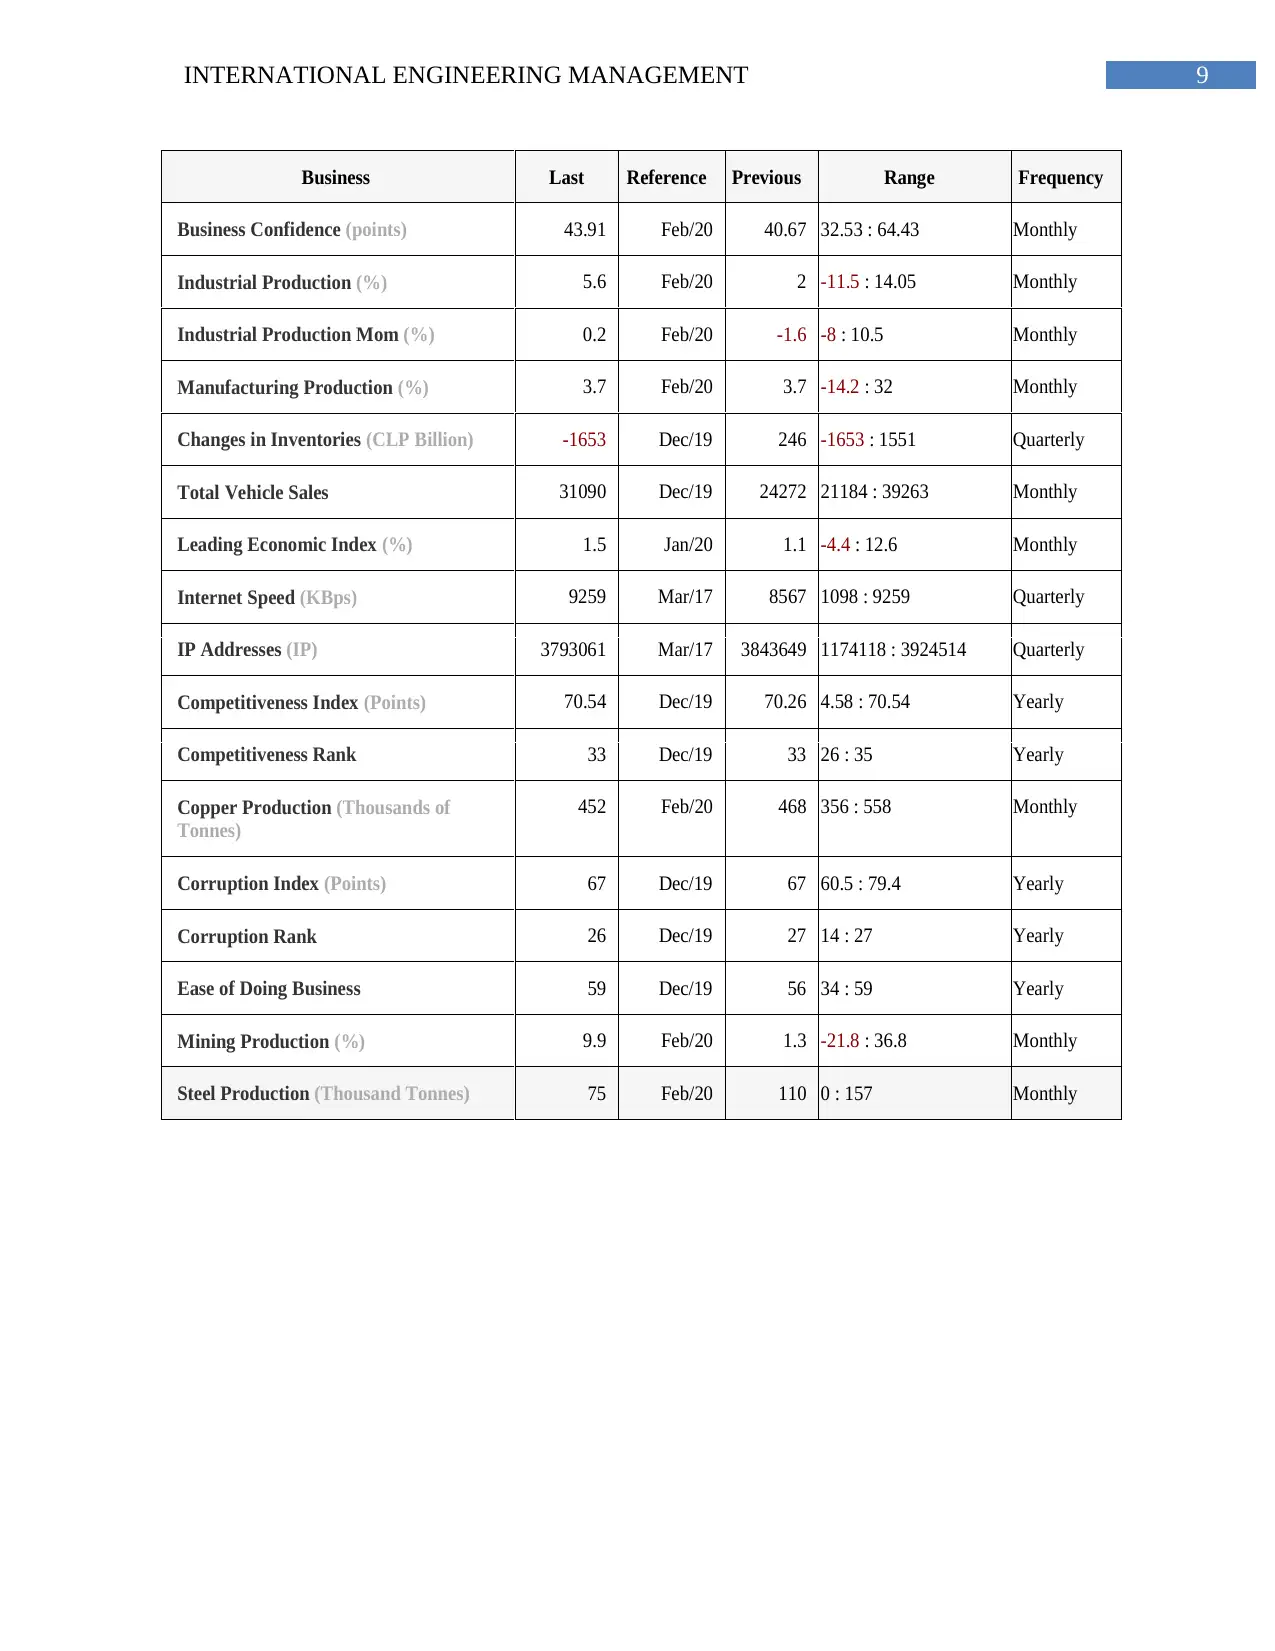
9INTERNATIONAL ENGINEERING MANAGEMENT
Business Last Reference Previous Range Frequency
Business Confidence (points) 43.91 Feb/20 40.67 32.53 : 64.43 Monthly
Industrial Production (%) 5.6 Feb/20 2 -11.5 : 14.05 Monthly
Industrial Production Mom (%) 0.2 Feb/20 -1.6 -8 : 10.5 Monthly
Manufacturing Production (%) 3.7 Feb/20 3.7 -14.2 : 32 Monthly
Changes in Inventories (CLP Billion) -1653 Dec/19 246 -1653 : 1551 Quarterly
Total Vehicle Sales 31090 Dec/19 24272 21184 : 39263 Monthly
Leading Economic Index (%) 1.5 Jan/20 1.1 -4.4 : 12.6 Monthly
Internet Speed (KBps) 9259 Mar/17 8567 1098 : 9259 Quarterly
IP Addresses (IP) 3793061 Mar/17 3843649 1174118 : 3924514 Quarterly
Competitiveness Index (Points) 70.54 Dec/19 70.26 4.58 : 70.54 Yearly
Competitiveness Rank 33 Dec/19 33 26 : 35 Yearly
Copper Production (Thousands of
Tonnes)
452 Feb/20 468 356 : 558 Monthly
Corruption Index (Points) 67 Dec/19 67 60.5 : 79.4 Yearly
Corruption Rank 26 Dec/19 27 14 : 27 Yearly
Ease of Doing Business 59 Dec/19 56 34 : 59 Yearly
Mining Production (%) 9.9 Feb/20 1.3 -21.8 : 36.8 Monthly
Steel Production (Thousand Tonnes) 75 Feb/20 110 0 : 157 Monthly
Secure Best Marks with AI Grader
Need help grading? Try our AI Grader for instant feedback on your assignments.
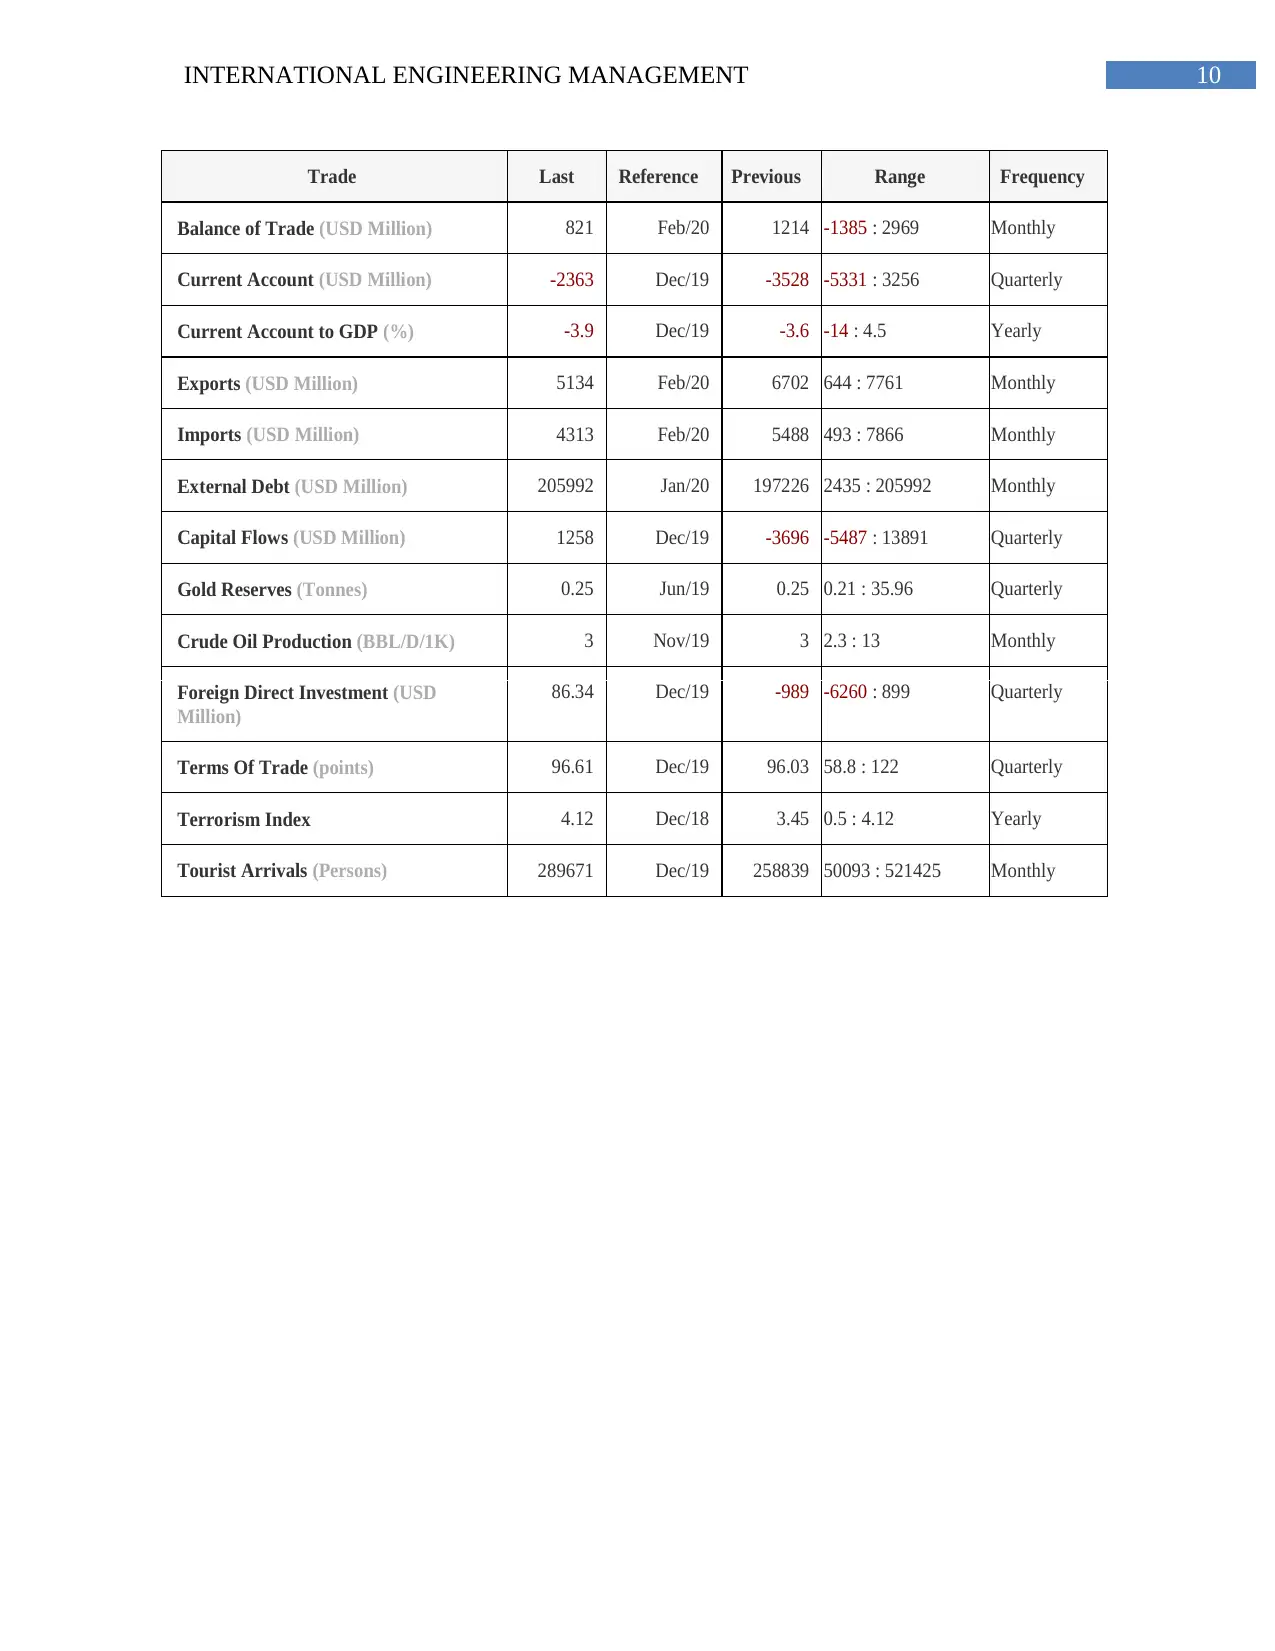
10INTERNATIONAL ENGINEERING MANAGEMENT
Trade Last Reference Previous Range Frequency
Balance of Trade (USD Million) 821 Feb/20 1214 -1385 : 2969 Monthly
Current Account (USD Million) -2363 Dec/19 -3528 -5331 : 3256 Quarterly
Current Account to GDP (%) -3.9 Dec/19 -3.6 -14 : 4.5 Yearly
Exports (USD Million) 5134 Feb/20 6702 644 : 7761 Monthly
Imports (USD Million) 4313 Feb/20 5488 493 : 7866 Monthly
External Debt (USD Million) 205992 Jan/20 197226 2435 : 205992 Monthly
Capital Flows (USD Million) 1258 Dec/19 -3696 -5487 : 13891 Quarterly
Gold Reserves (Tonnes) 0.25 Jun/19 0.25 0.21 : 35.96 Quarterly
Crude Oil Production (BBL/D/1K) 3 Nov/19 3 2.3 : 13 Monthly
Foreign Direct Investment (USD
Million)
86.34 Dec/19 -989 -6260 : 899 Quarterly
Terms Of Trade (points) 96.61 Dec/19 96.03 58.8 : 122 Quarterly
Terrorism Index 4.12 Dec/18 3.45 0.5 : 4.12 Yearly
Tourist Arrivals (Persons) 289671 Dec/19 258839 50093 : 521425 Monthly
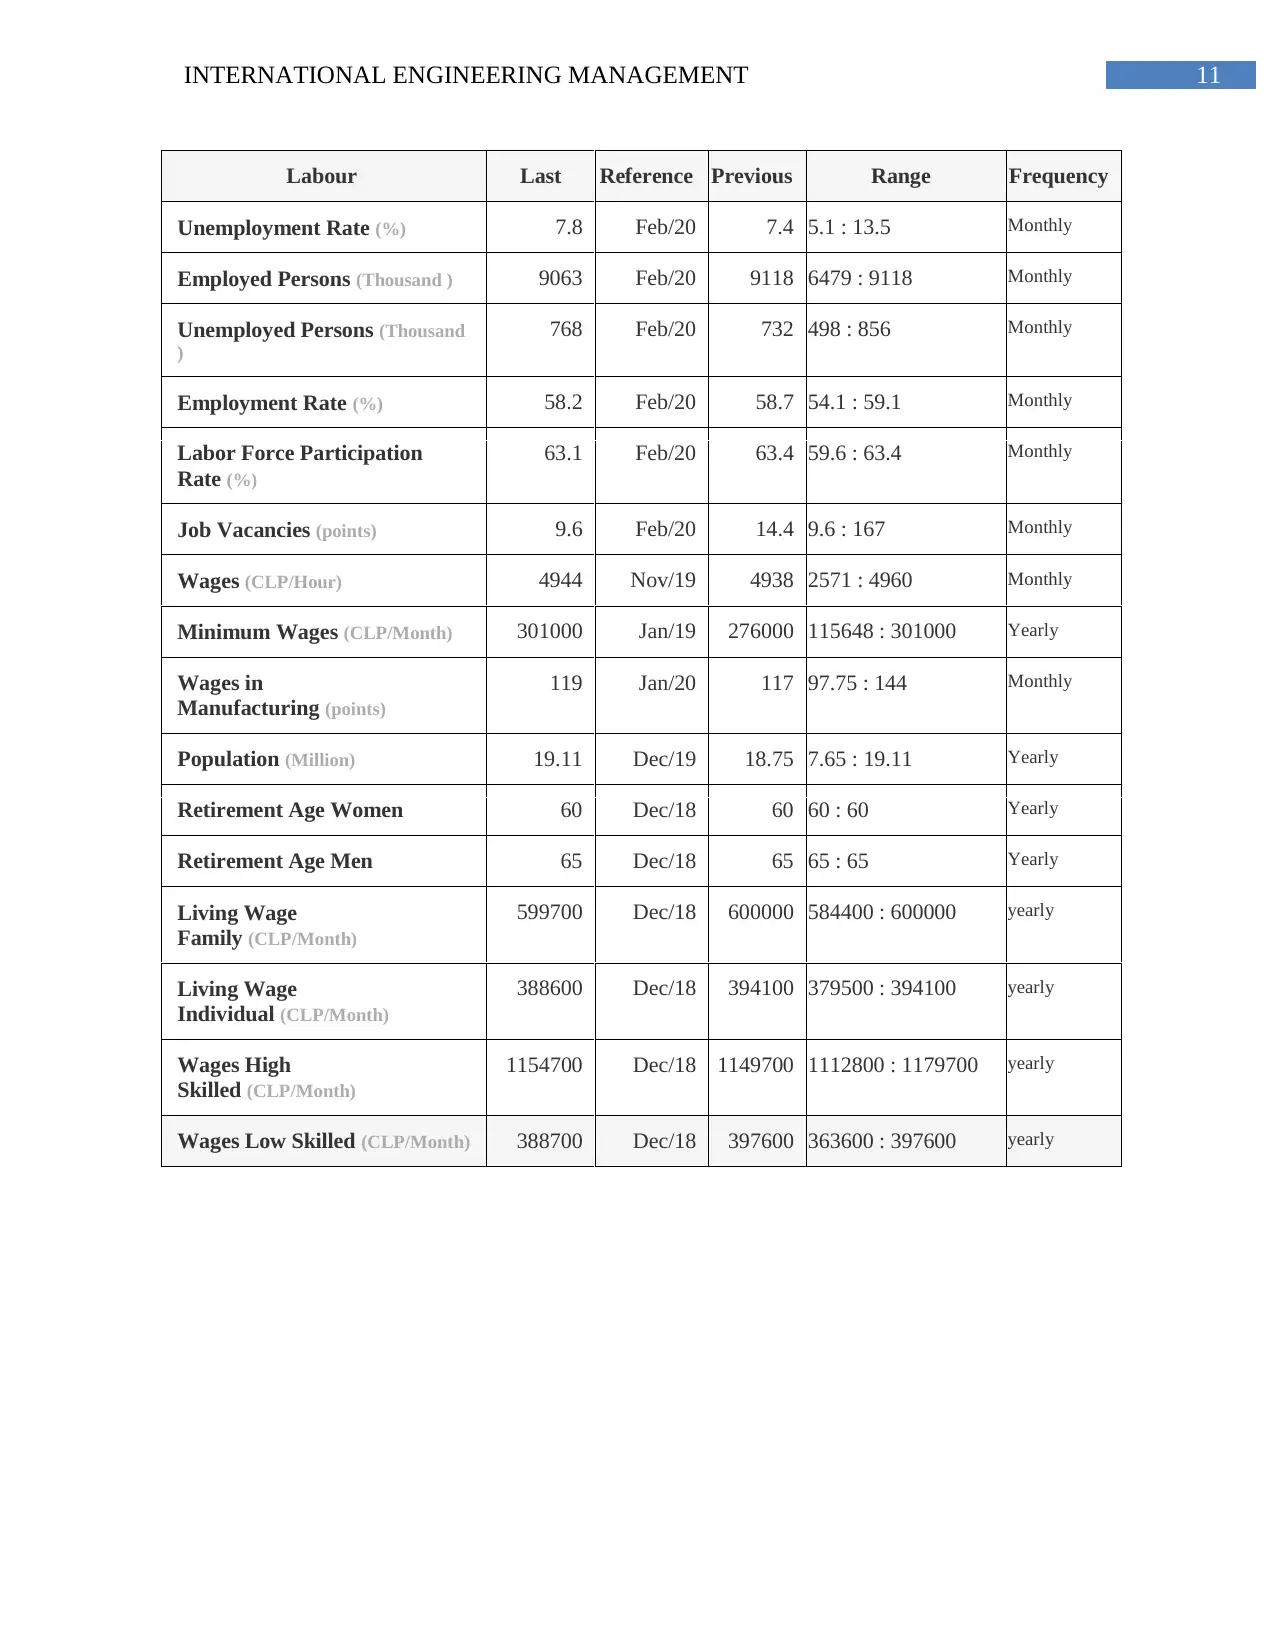
11INTERNATIONAL ENGINEERING MANAGEMENT
Labour Last Reference Previous Range Frequency
Unemployment Rate (%) 7.8 Feb/20 7.4 5.1 : 13.5 Monthly
Employed Persons (Thousand ) 9063 Feb/20 9118 6479 : 9118 Monthly
Unemployed Persons (Thousand
)
768 Feb/20 732 498 : 856 Monthly
Employment Rate (%) 58.2 Feb/20 58.7 54.1 : 59.1 Monthly
Labor Force Participation
Rate (%)
63.1 Feb/20 63.4 59.6 : 63.4 Monthly
Job Vacancies (points) 9.6 Feb/20 14.4 9.6 : 167 Monthly
Wages (CLP/Hour) 4944 Nov/19 4938 2571 : 4960 Monthly
Minimum Wages (CLP/Month) 301000 Jan/19 276000 115648 : 301000 Yearly
Wages in
Manufacturing (points)
119 Jan/20 117 97.75 : 144 Monthly
Population (Million) 19.11 Dec/19 18.75 7.65 : 19.11 Yearly
Retirement Age Women 60 Dec/18 60 60 : 60 Yearly
Retirement Age Men 65 Dec/18 65 65 : 65 Yearly
Living Wage
Family (CLP/Month)
599700 Dec/18 600000 584400 : 600000 yearly
Living Wage
Individual (CLP/Month)
388600 Dec/18 394100 379500 : 394100 yearly
Wages High
Skilled (CLP/Month)
1154700 Dec/18 1149700 1112800 : 1179700 yearly
Wages Low Skilled (CLP/Month) 388700 Dec/18 397600 363600 : 397600 yearly
12INTERNATIONAL ENGINEERING MANAGEMENT
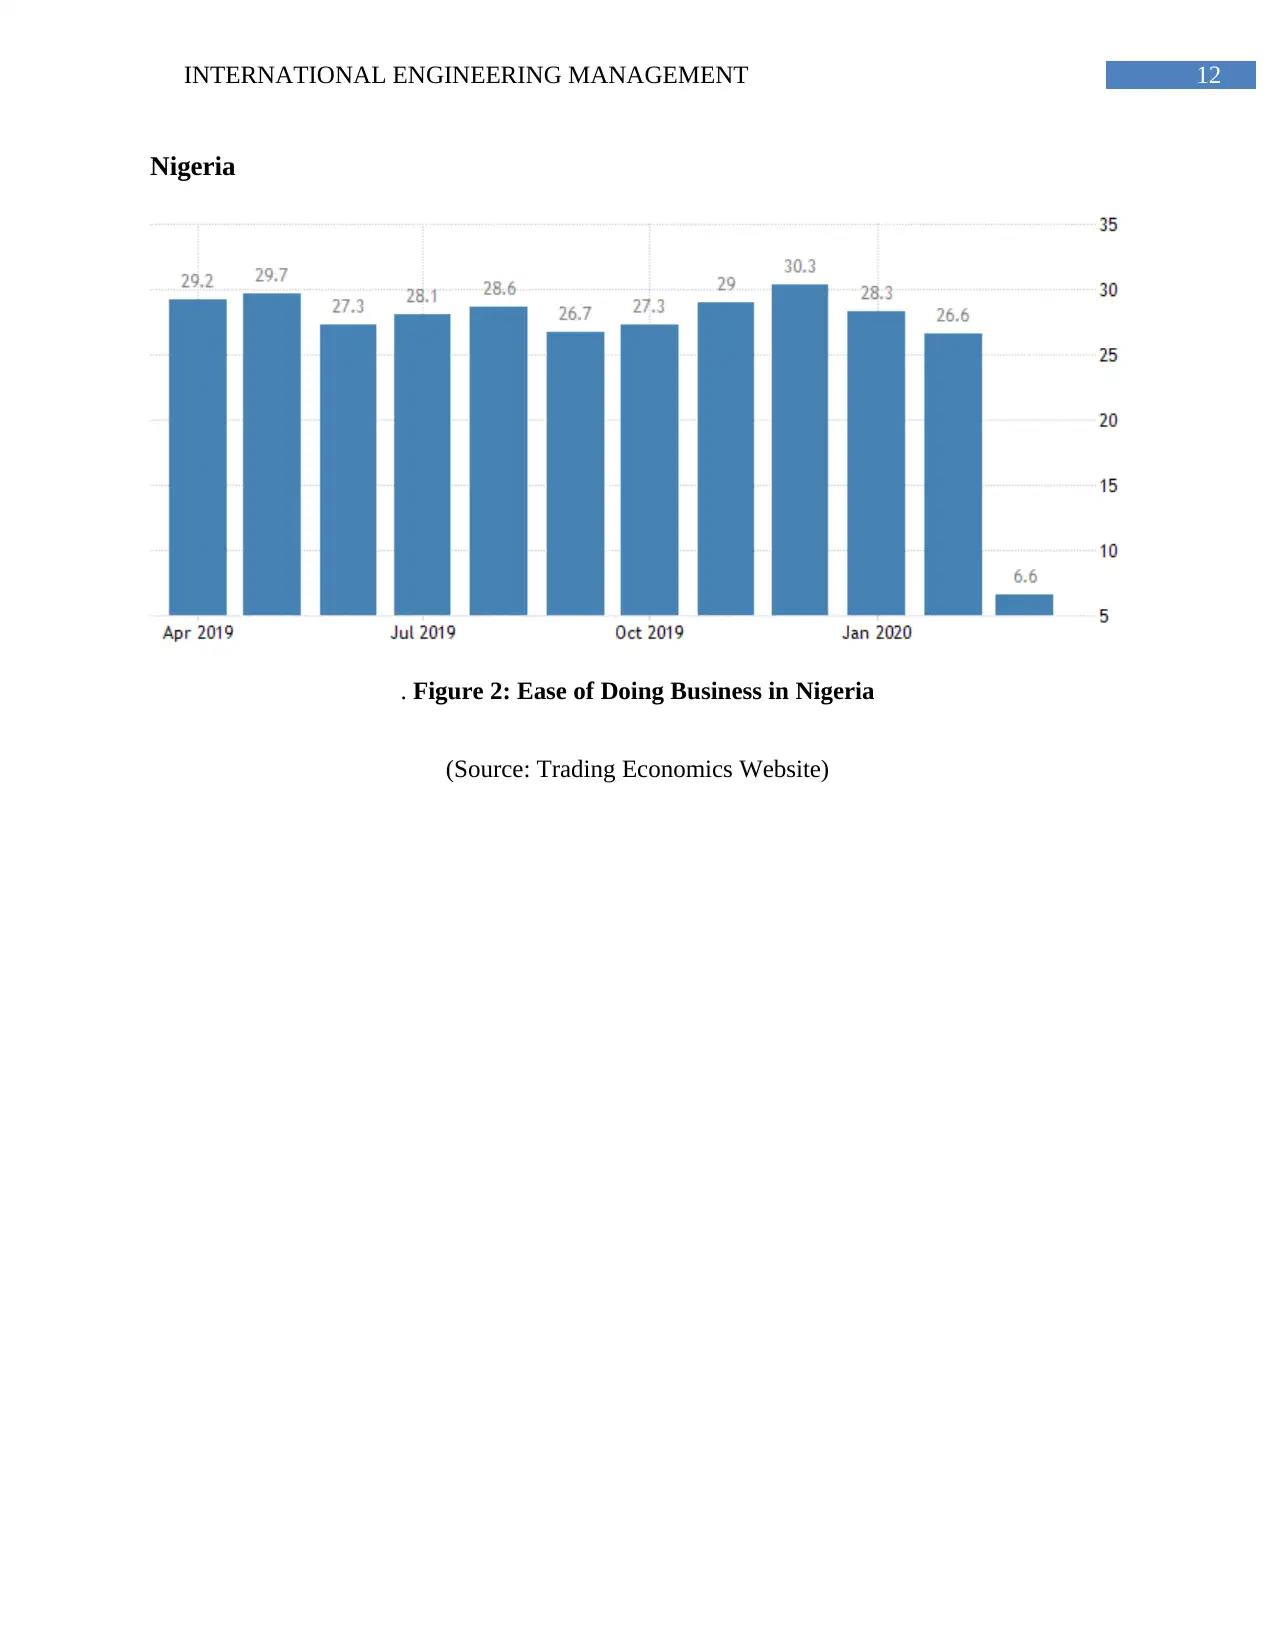
Nigeria
. Figure 2: Ease of Doing Business in Nigeria
(Source: Trading Economics Website)
Nigeria
. Figure 2: Ease of Doing Business in Nigeria
(Source: Trading Economics Website)
Paraphrase This Document
Need a fresh take? Get an instant paraphrase of this document with our AI Paraphraser
13INTERNATIONAL ENGINEERING MANAGEMENT
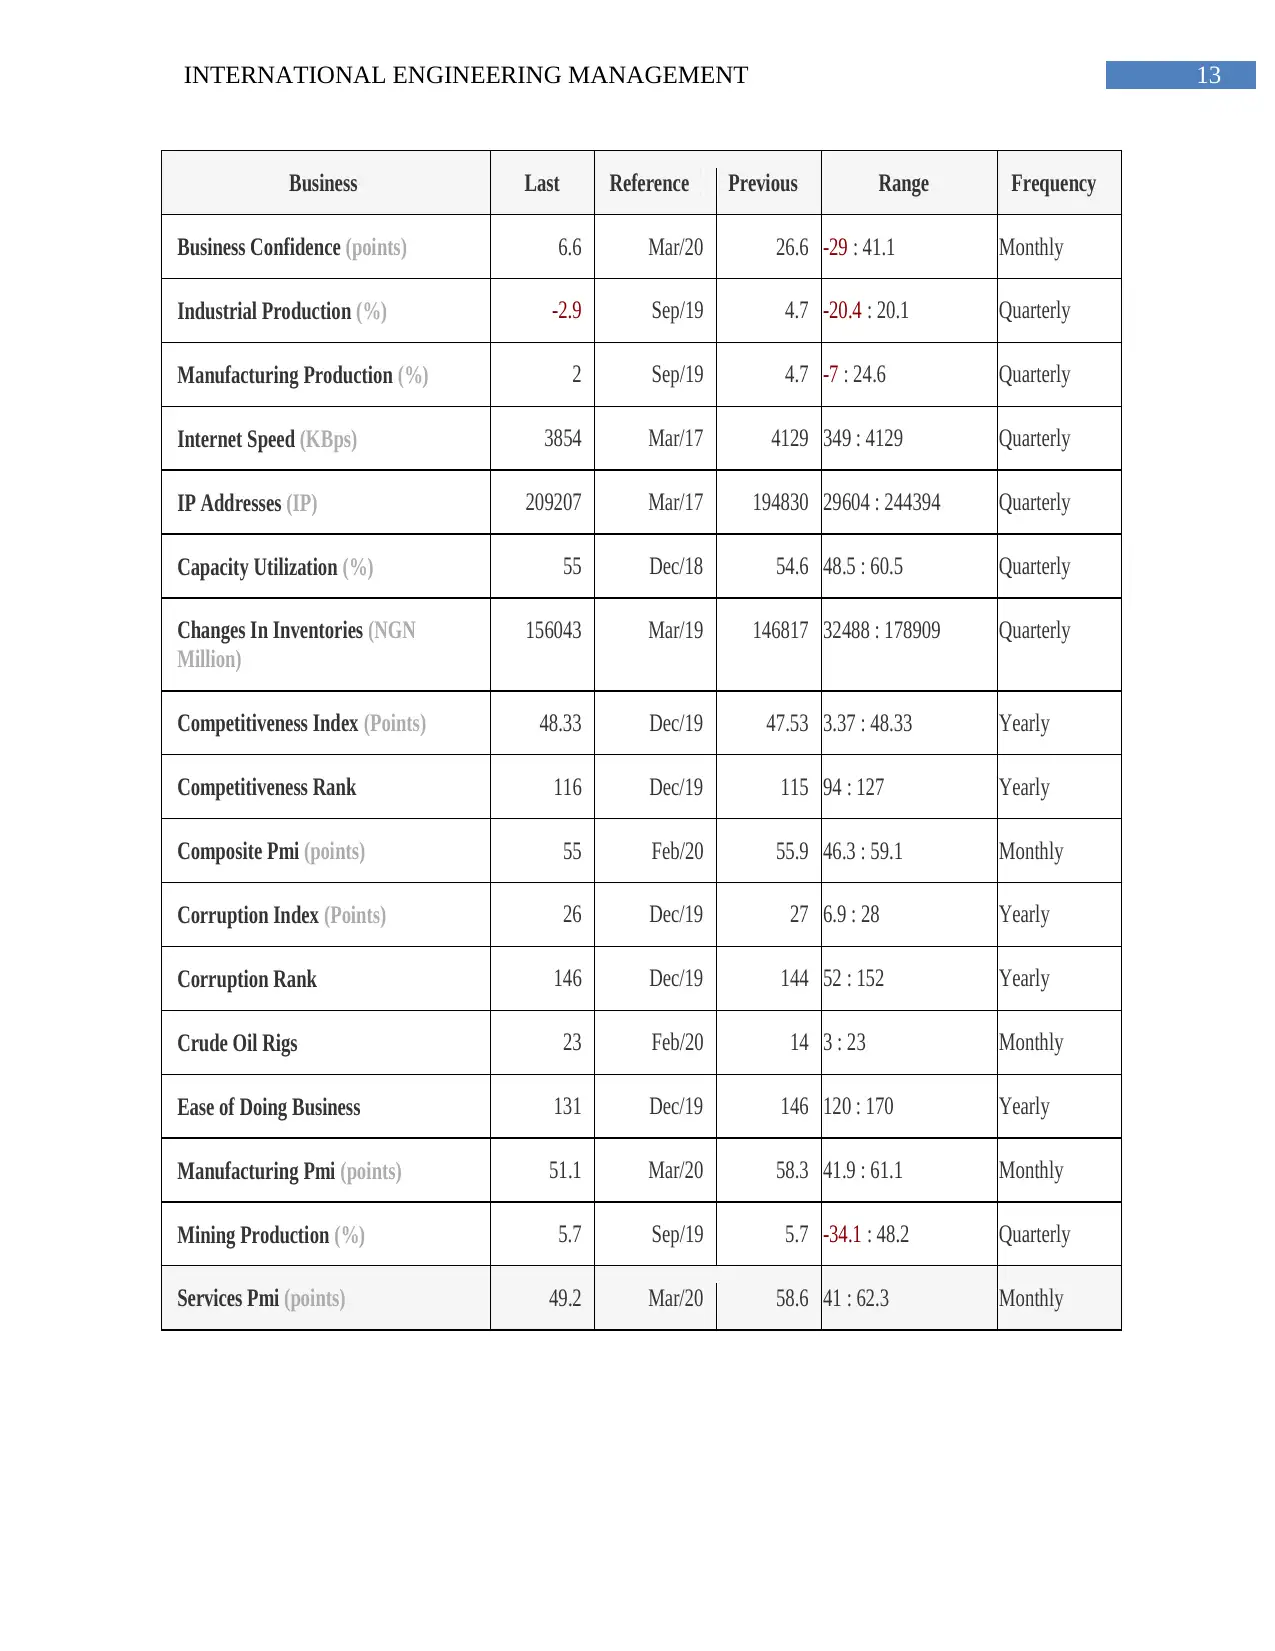
Business Last Reference Previous Range Frequency
Business Confidence (points) 6.6 Mar/20 26.6 -29 : 41.1 Monthly
Industrial Production (%) -2.9 Sep/19 4.7 -20.4 : 20.1 Quarterly
Manufacturing Production (%) 2 Sep/19 4.7 -7 : 24.6 Quarterly
Internet Speed (KBps) 3854 Mar/17 4129 349 : 4129 Quarterly
IP Addresses (IP) 209207 Mar/17 194830 29604 : 244394 Quarterly
Capacity Utilization (%) 55 Dec/18 54.6 48.5 : 60.5 Quarterly
Changes In Inventories (NGN
Million)
156043 Mar/19 146817 32488 : 178909 Quarterly
Competitiveness Index (Points) 48.33 Dec/19 47.53 3.37 : 48.33 Yearly
Competitiveness Rank 116 Dec/19 115 94 : 127 Yearly
Composite Pmi (points) 55 Feb/20 55.9 46.3 : 59.1 Monthly
Corruption Index (Points) 26 Dec/19 27 6.9 : 28 Yearly
Corruption Rank 146 Dec/19 144 52 : 152 Yearly
Crude Oil Rigs 23 Feb/20 14 3 : 23 Monthly
Ease of Doing Business 131 Dec/19 146 120 : 170 Yearly
Manufacturing Pmi (points) 51.1 Mar/20 58.3 41.9 : 61.1 Monthly
Mining Production (%) 5.7 Sep/19 5.7 -34.1 : 48.2 Quarterly
Services Pmi (points) 49.2 Mar/20 58.6 41 : 62.3 Monthly
14INTERNATIONAL ENGINEERING MANAGEMENT
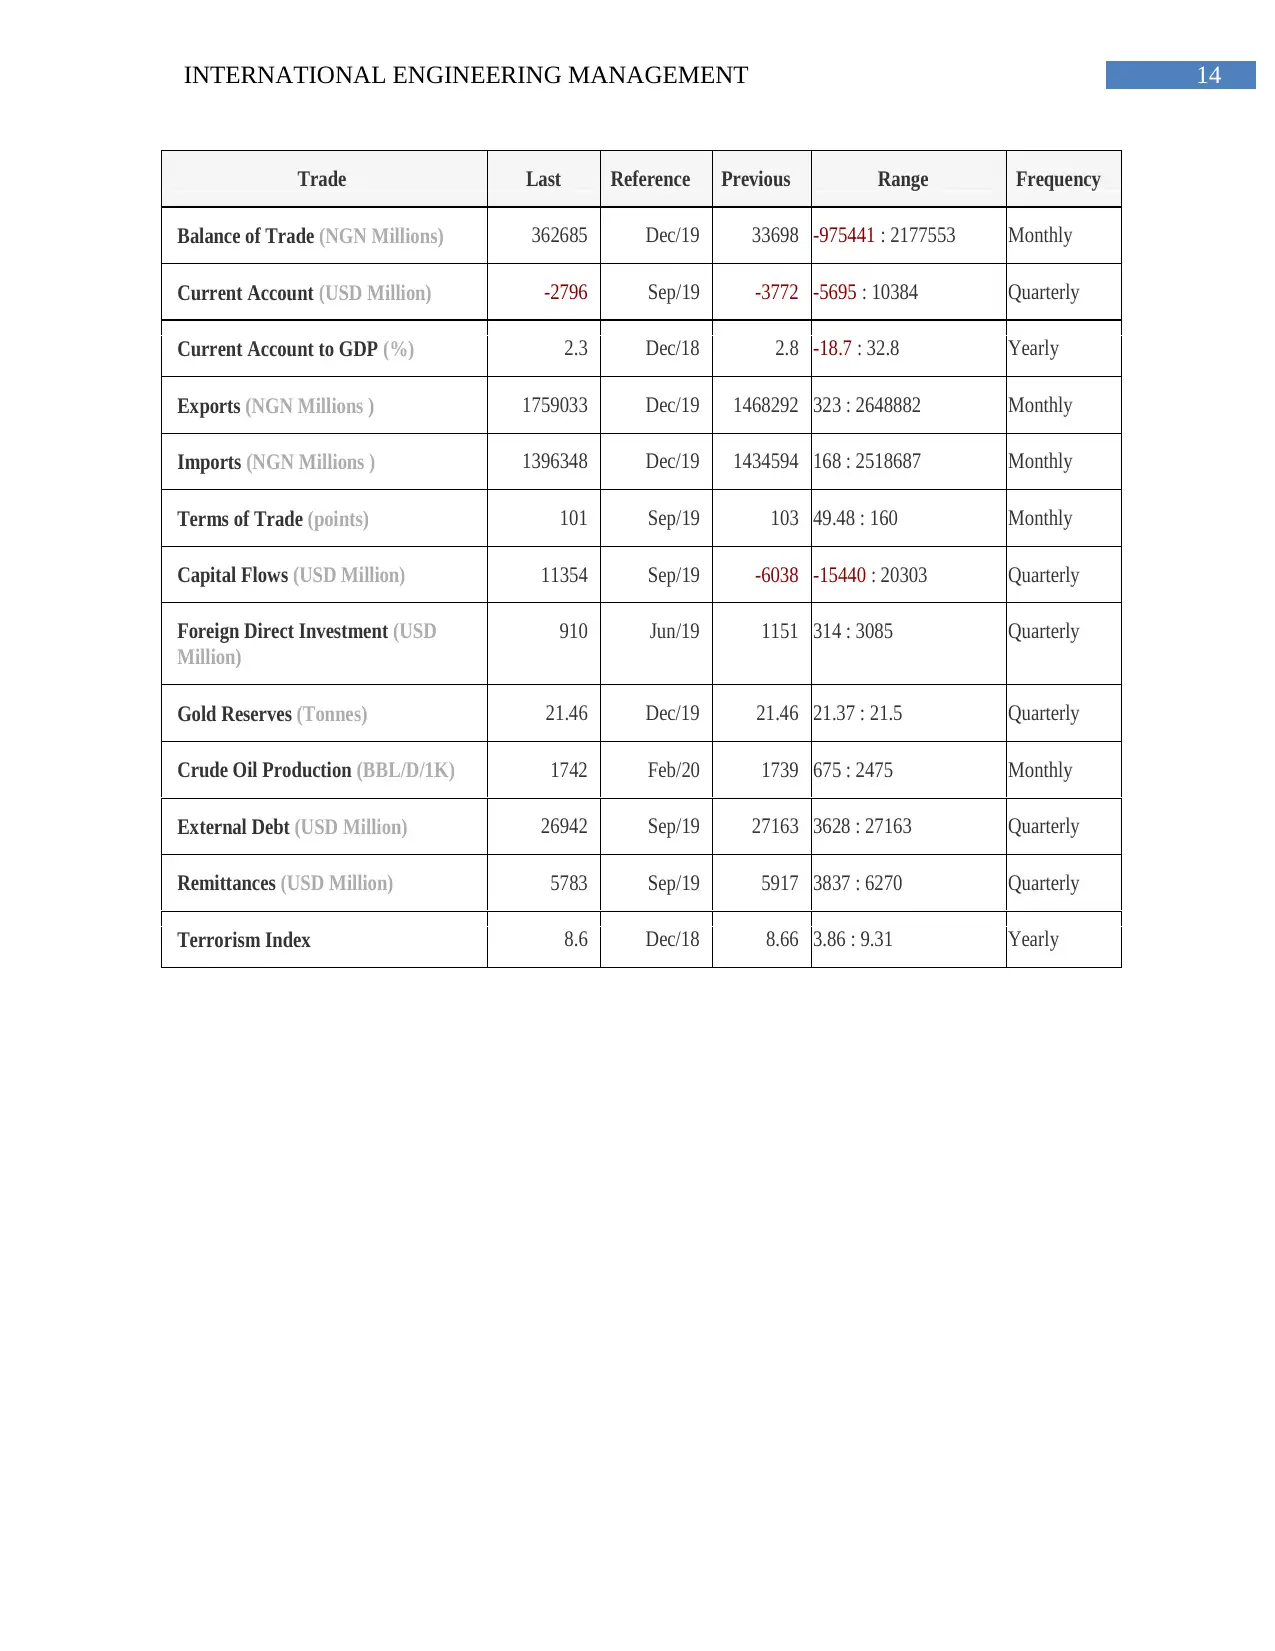
Trade Last Reference Previous Range Frequency
Balance of Trade (NGN Millions) 362685 Dec/19 33698 -975441 : 2177553 Monthly
Current Account (USD Million) -2796 Sep/19 -3772 -5695 : 10384 Quarterly
Current Account to GDP (%) 2.3 Dec/18 2.8 -18.7 : 32.8 Yearly
Exports (NGN Millions ) 1759033 Dec/19 1468292 323 : 2648882 Monthly
Imports (NGN Millions ) 1396348 Dec/19 1434594 168 : 2518687 Monthly
Terms of Trade (points) 101 Sep/19 103 49.48 : 160 Monthly
Capital Flows (USD Million) 11354 Sep/19 -6038 -15440 : 20303 Quarterly
Foreign Direct Investment (USD
Million)
910 Jun/19 1151 314 : 3085 Quarterly
Gold Reserves (Tonnes) 21.46 Dec/19 21.46 21.37 : 21.5 Quarterly
Crude Oil Production (BBL/D/1K) 1742 Feb/20 1739 675 : 2475 Monthly
External Debt (USD Million) 26942 Sep/19 27163 3628 : 27163 Quarterly
Remittances (USD Million) 5783 Sep/19 5917 3837 : 6270 Quarterly
Terrorism Index 8.6 Dec/18 8.66 3.86 : 9.31 Yearly
15INTERNATIONAL ENGINEERING MANAGEMENT
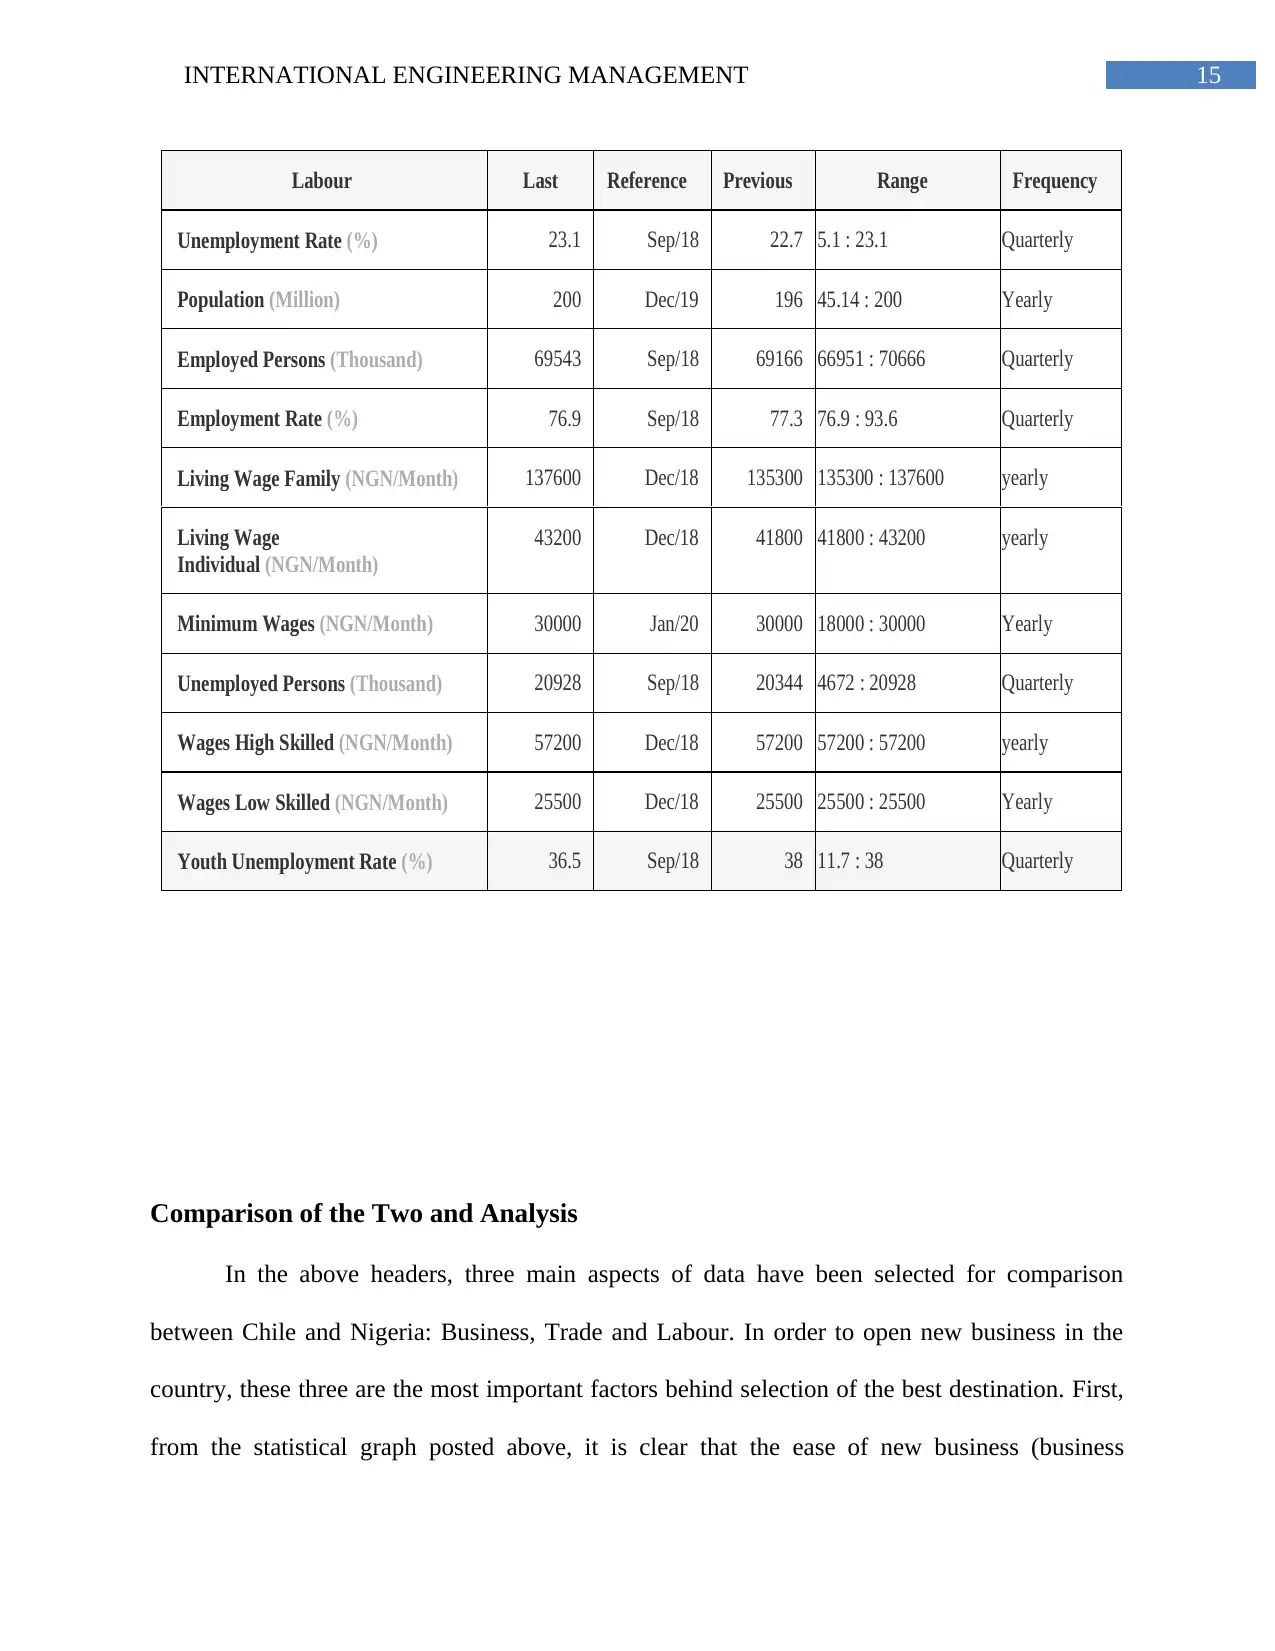
Labour Last Reference Previous Range Frequency
Unemployment Rate (%) 23.1 Sep/18 22.7 5.1 : 23.1 Quarterly
Population (Million) 200 Dec/19 196 45.14 : 200 Yearly
Employed Persons (Thousand) 69543 Sep/18 69166 66951 : 70666 Quarterly
Employment Rate (%) 76.9 Sep/18 77.3 76.9 : 93.6 Quarterly
Living Wage Family (NGN/Month) 137600 Dec/18 135300 135300 : 137600 yearly
Living Wage
Individual (NGN/Month)
43200 Dec/18 41800 41800 : 43200 yearly
Minimum Wages (NGN/Month) 30000 Jan/20 30000 18000 : 30000 Yearly
Unemployed Persons (Thousand) 20928 Sep/18 20344 4672 : 20928 Quarterly
Wages High Skilled (NGN/Month) 57200 Dec/18 57200 57200 : 57200 yearly
Wages Low Skilled (NGN/Month) 25500 Dec/18 25500 25500 : 25500 Yearly
Youth Unemployment Rate (%) 36.5 Sep/18 38 11.7 : 38 Quarterly
Comparison of the Two and Analysis
In the above headers, three main aspects of data have been selected for comparison
between Chile and Nigeria: Business, Trade and Labour. In order to open new business in the
country, these three are the most important factors behind selection of the best destination. First,
from the statistical graph posted above, it is clear that the ease of new business (business
Secure Best Marks with AI Grader
Need help grading? Try our AI Grader for instant feedback on your assignments.
16INTERNATIONAL ENGINEERING MANAGEMENT
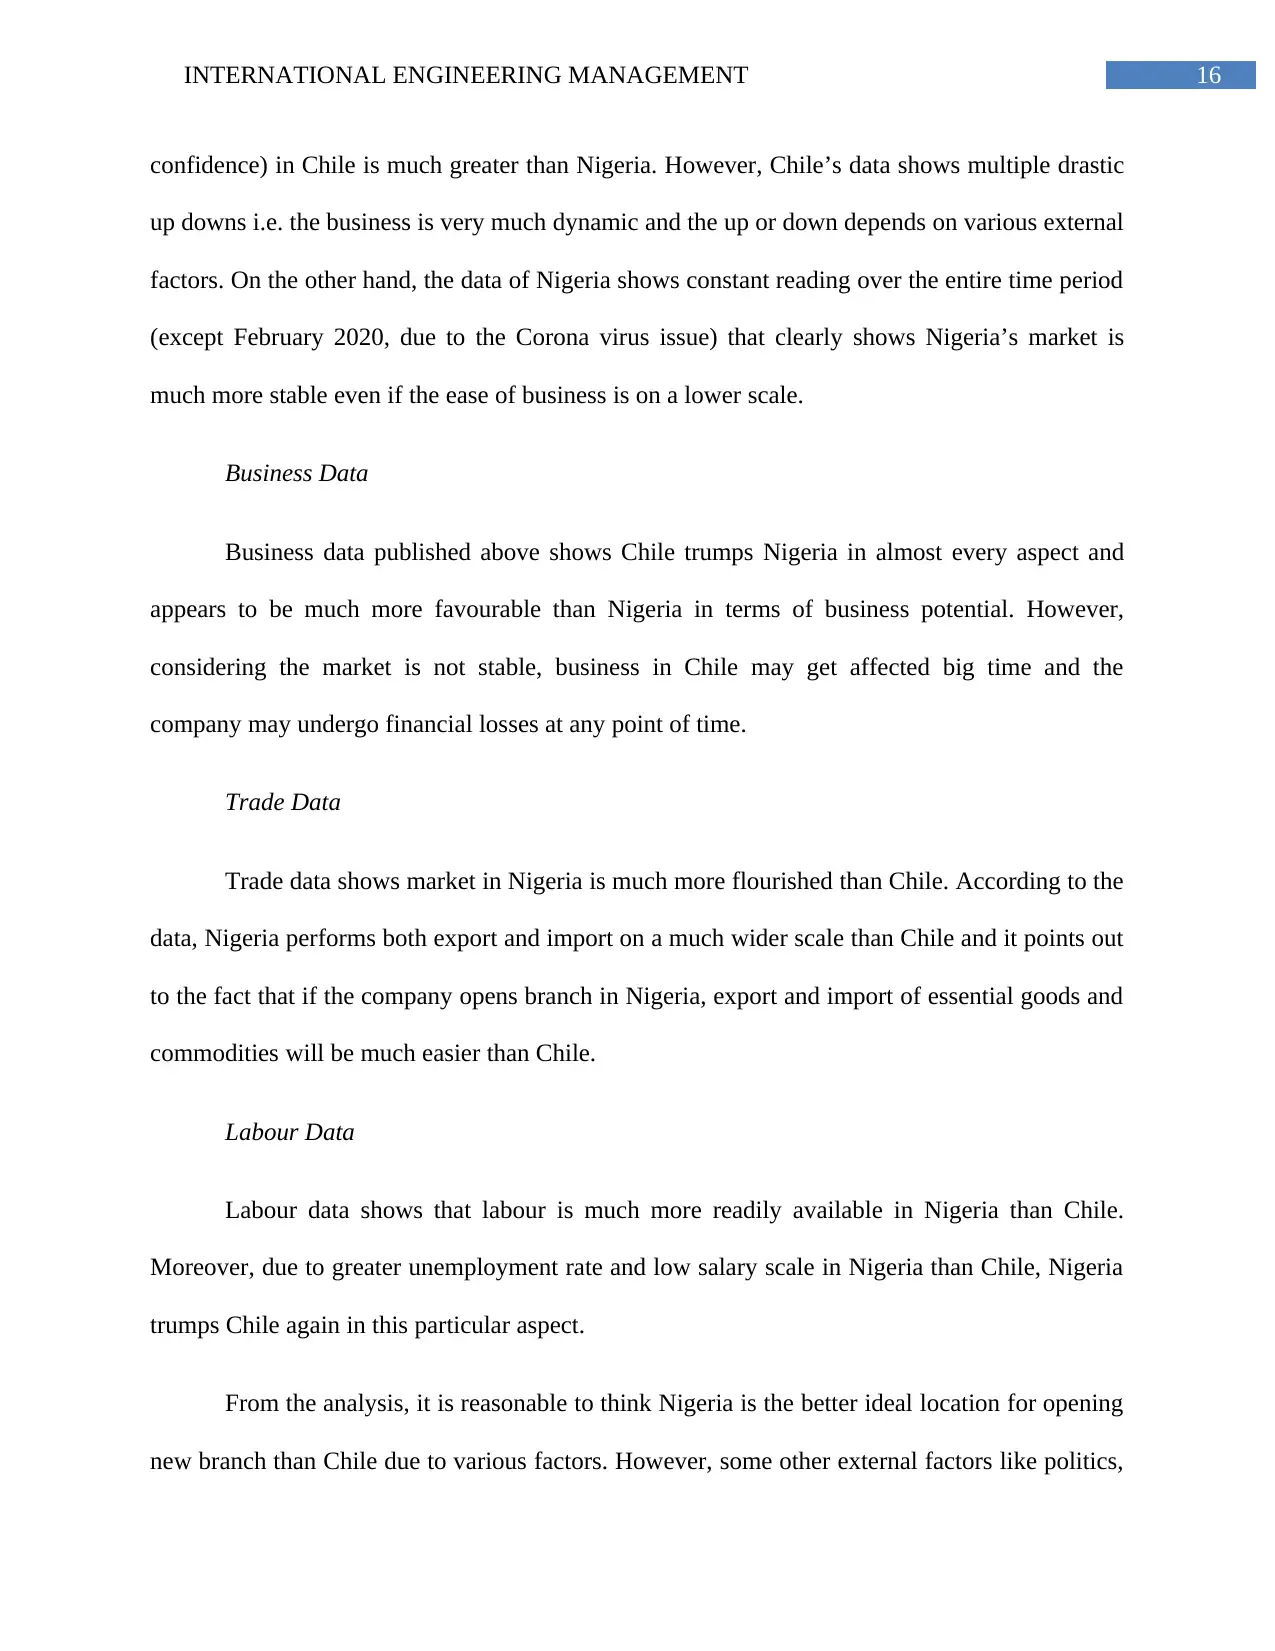
confidence) in Chile is much greater than Nigeria. However, Chile’s data shows multiple drastic
up downs i.e. the business is very much dynamic and the up or down depends on various external
factors. On the other hand, the data of Nigeria shows constant reading over the entire time period
(except February 2020, due to the Corona virus issue) that clearly shows Nigeria’s market is
much more stable even if the ease of business is on a lower scale.
Business Data
Business data published above shows Chile trumps Nigeria in almost every aspect and
appears to be much more favourable than Nigeria in terms of business potential. However,
considering the market is not stable, business in Chile may get affected big time and the
company may undergo financial losses at any point of time.
Trade Data
Trade data shows market in Nigeria is much more flourished than Chile. According to the
data, Nigeria performs both export and import on a much wider scale than Chile and it points out
to the fact that if the company opens branch in Nigeria, export and import of essential goods and
commodities will be much easier than Chile.
Labour Data
Labour data shows that labour is much more readily available in Nigeria than Chile.
Moreover, due to greater unemployment rate and low salary scale in Nigeria than Chile, Nigeria
trumps Chile again in this particular aspect.
From the analysis, it is reasonable to think Nigeria is the better ideal location for opening
new branch than Chile due to various factors. However, some other external factors like politics,
17INTERNATIONAL ENGINEERING MANAGEMENT
corruption, terrorism and others make Nigeria the worse country to open business than Chile.
Hence, if Komatsu can deal with rapid market changes in Chile, Chile should be chosen as the
ideal destination for expanding business.
Task 4: Conclusion
Komatsu Limited is a Japan based multinational organisation that operates in the
manufacturing industry. Komatsu has plans in place to grow and reach financial pinnacle in the
industry in the global context. The company is willing to expand services to another country and
for that purpose, Nigeria and Chile have been shortlisted. Chile is a country in South America
whereas Nigeria is located in central Africa. Other than the geographical locations, Chile and
Nigeria differ in almost every aspects including culture, business, population, development,
industry, politics and others. Chile is one of the most developed countries of the world, on the
verge of becoming a first world country whereas Nigeria belongs to the category of developing /
third world country. If a company wants to do business in a new country and have Chile or
Nigeria as the possible options, there are a lot of differences that need to be considered before
establishing the business. Monetary status is one the major factors to be considered while starting
business in a new country. While Chile’s monetary status is considerably high as compared to
Nigeria, Chile looks to be a better position if the two are considered to be candidates for new
business opening. However, low monetary status of Nigeria means availability of more cheap
labour that will significantly help the company set up and run easily without unreasonable
investments. Following the monetary status, business potential is another important factor. In
business potential, a lot of sub factors come into play including availability of cheap labour,
production cost, export import cost, market demand and profitability and others. There is a huge
18INTERNATIONAL ENGINEERING MANAGEMENT
cultural difference between Chile and Nigeria. The cultural differences include language,
philosophy, outlook, ideas and many others. Both the cultures can have positive and negative
aspects and it is important for the company to select which one suits their own business
philosophy and alignment more. Political factors play major roles in any business. In Nigeria,
politics is unstable and there are frequent riots and terrorist attacks. On the other hand, Chile is
much more stable politically. Business data published in the report shows Chile trumps Nigeria
in almost every aspect and appears to be much more favourable than Nigeria in terms of business
potential. The data clearly shows Chile is ahead of Nigeria in almost every aspect of financials
and other business related factors. In the first few data, it is seen that the annual GDP of Nigeria
is considerably greater than that of Chile but at the same time, GDP per capita of Nigeria is less
than Chile. This is because the population of Nigeria is much greater than Chile and considering
the population difference, the annual GDP of Nigeria is not in a healthy status if compared to that
of Chile. Trade data shows market in Nigeria is much more flourished than Chile. Labour data
shows that labour is much more readily available in Nigeria than Chile. Some other external
factors like politics, corruption, terrorism and others make Nigeria the worse country to open
business than Chile. If Komatsu can deal with rapid market changes in Chile, Chile should be
chosen as the ideal destination for expanding business.
Paraphrase This Document
Need a fresh take? Get an instant paraphrase of this document with our AI Paraphraser
19INTERNATIONAL ENGINEERING MANAGEMENT
Bibliography
Adigbole, E. and Osemene, O., 2019. Strategic Cost Management And Accuracy Of Cost
Information In Selected Manufacturing Firms In Lagos And Ogun States, Nigeria. International
Journal of Accounting and Finance (IJAF), 8(1), pp.129-151.
Barros, J.G., 2019. Deindustrialization in Chile. Routledge.
Micco, A., Repetto, A. and Toro, P., 2019. Market Power, Ownership Concentration and Income
Inequality in Chile Research Proposal for Labor Share and Inequality in Latin America and the
Caribbean.
Nwonyuku, K., 2019. The Ease of Doing Manufacturing Business in Nigeria: The Role of Tax
Authority (an Enlightenment of the Functions, Scope and Mode of Operations of
FIRS). Available at SSRN 3396978.
Oaya, Z.C.T., Ogbu, J. and Remilekun, G., 2017. Impact of recruitment and selection strategy on
employees’ performance: a study of three selected manufacturing companies in
Nigeria. International Journal of Innovation and Economic Development, 3(3), pp.32-42.
Pérez, J.A.H., Geldes, C., Kunc, M.H. and Flores, A., 2019. New approach to the innovation
process in emerging economies: The manufacturing sector case in Chile and
Peru. Technovation, 79, pp.35-55.
Spillan, J.E. and Rahman, M.N., 2020. Historical Perspective on Doing Business in Chile and
Peru. In Doing Business in Chile and Peru (pp. 31-45). Palgrave Macmillan, Cham.

20INTERNATIONAL ENGINEERING MANAGEMENT
Sun, I.Y., 2017. The World's Next Great Manufacturing Center. Harvard Business Review, 95,
pp.122-129.
Sun, I.Y., 2017. The World's Next Great Manufacturing Center. Harvard Business Review, 95,
pp.122-129.
1 out of 21
Related Documents


Your All-in-One AI-Powered Toolkit for Academic Success.
+13062052269
info@desklib.com
Available 24*7 on WhatsApp / Email
![[object Object]](/_next/static/media/star-bottom.7253800d.svg)
Unlock your academic potential
© 2024 | Zucol Services PVT LTD | All rights reserved.