Billing Boats AS: Detailed Financial Analysis and Profit Projections

Verified

Added on  2020/02/03

|5
|617
|176
Report
AI Summary
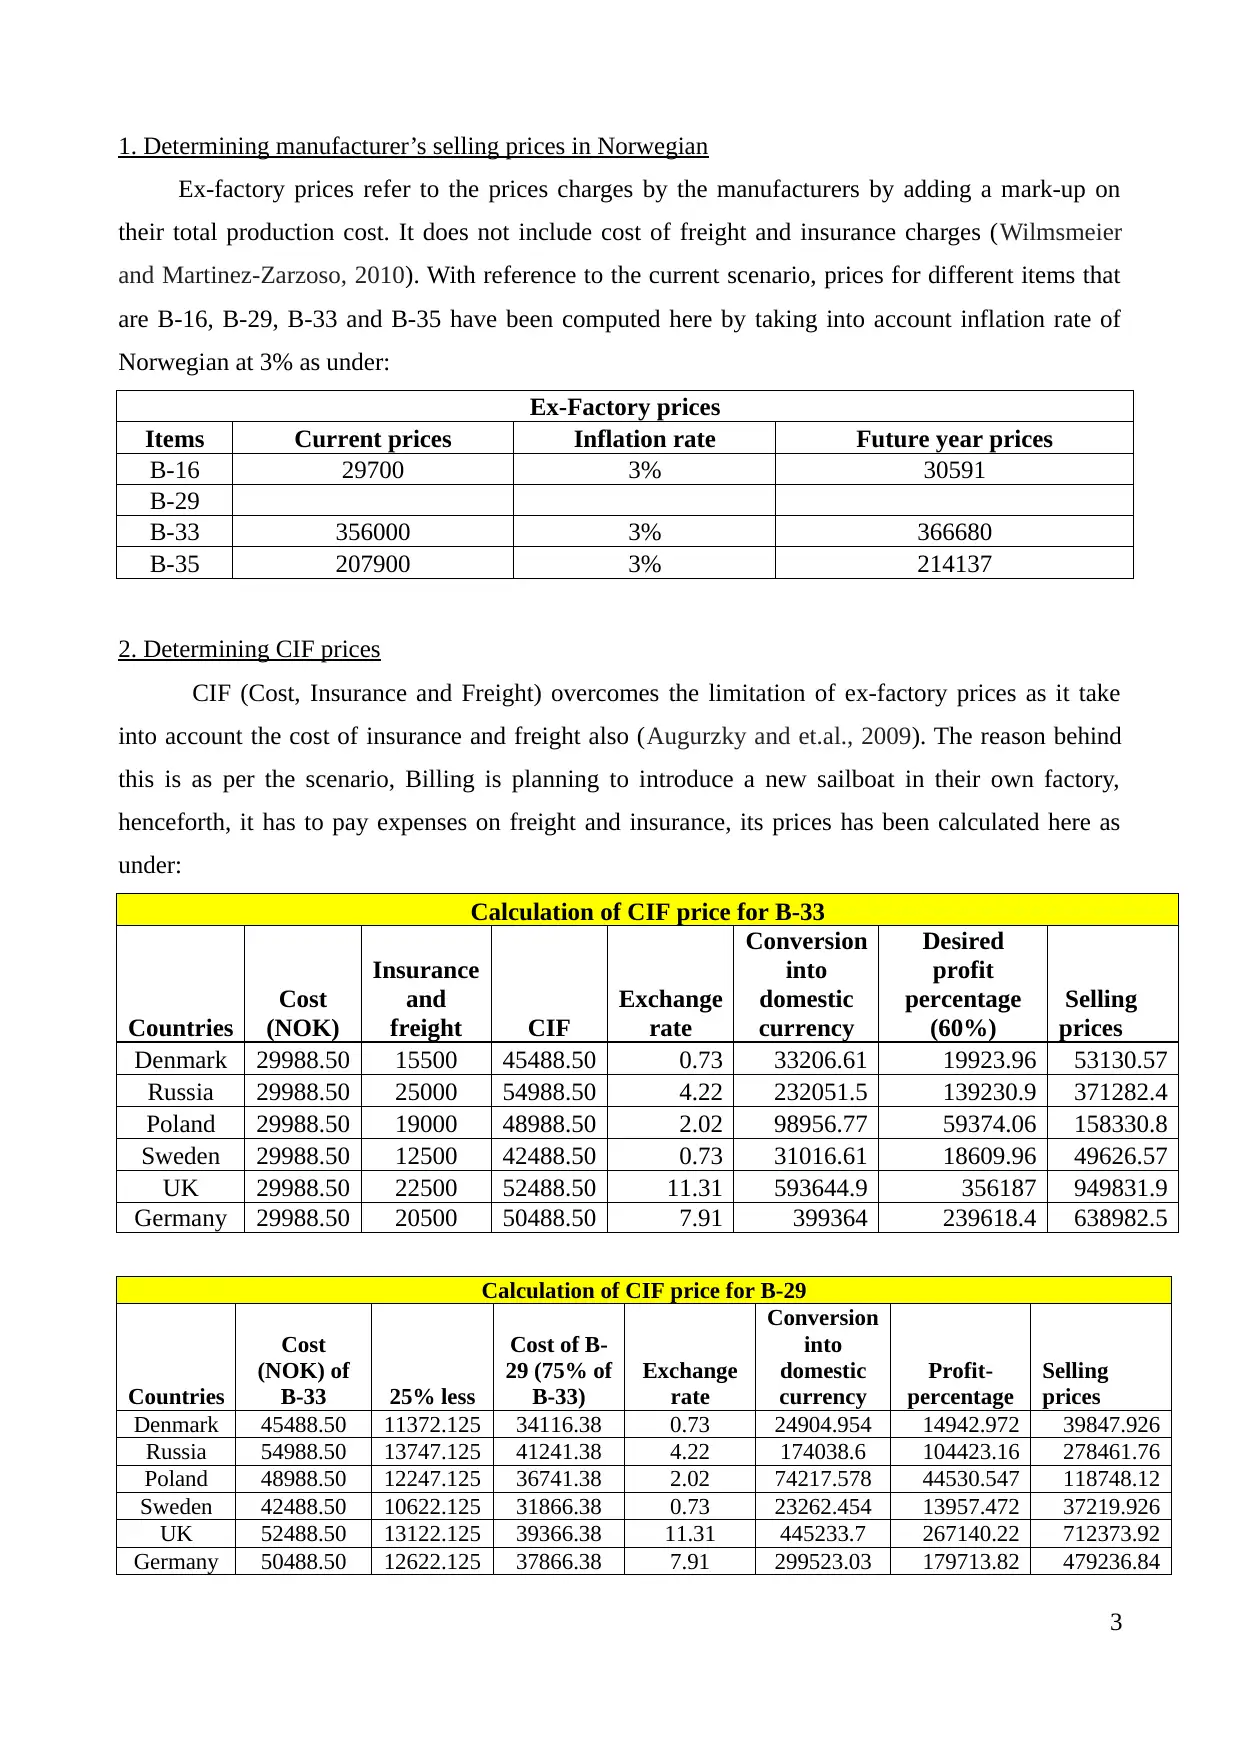
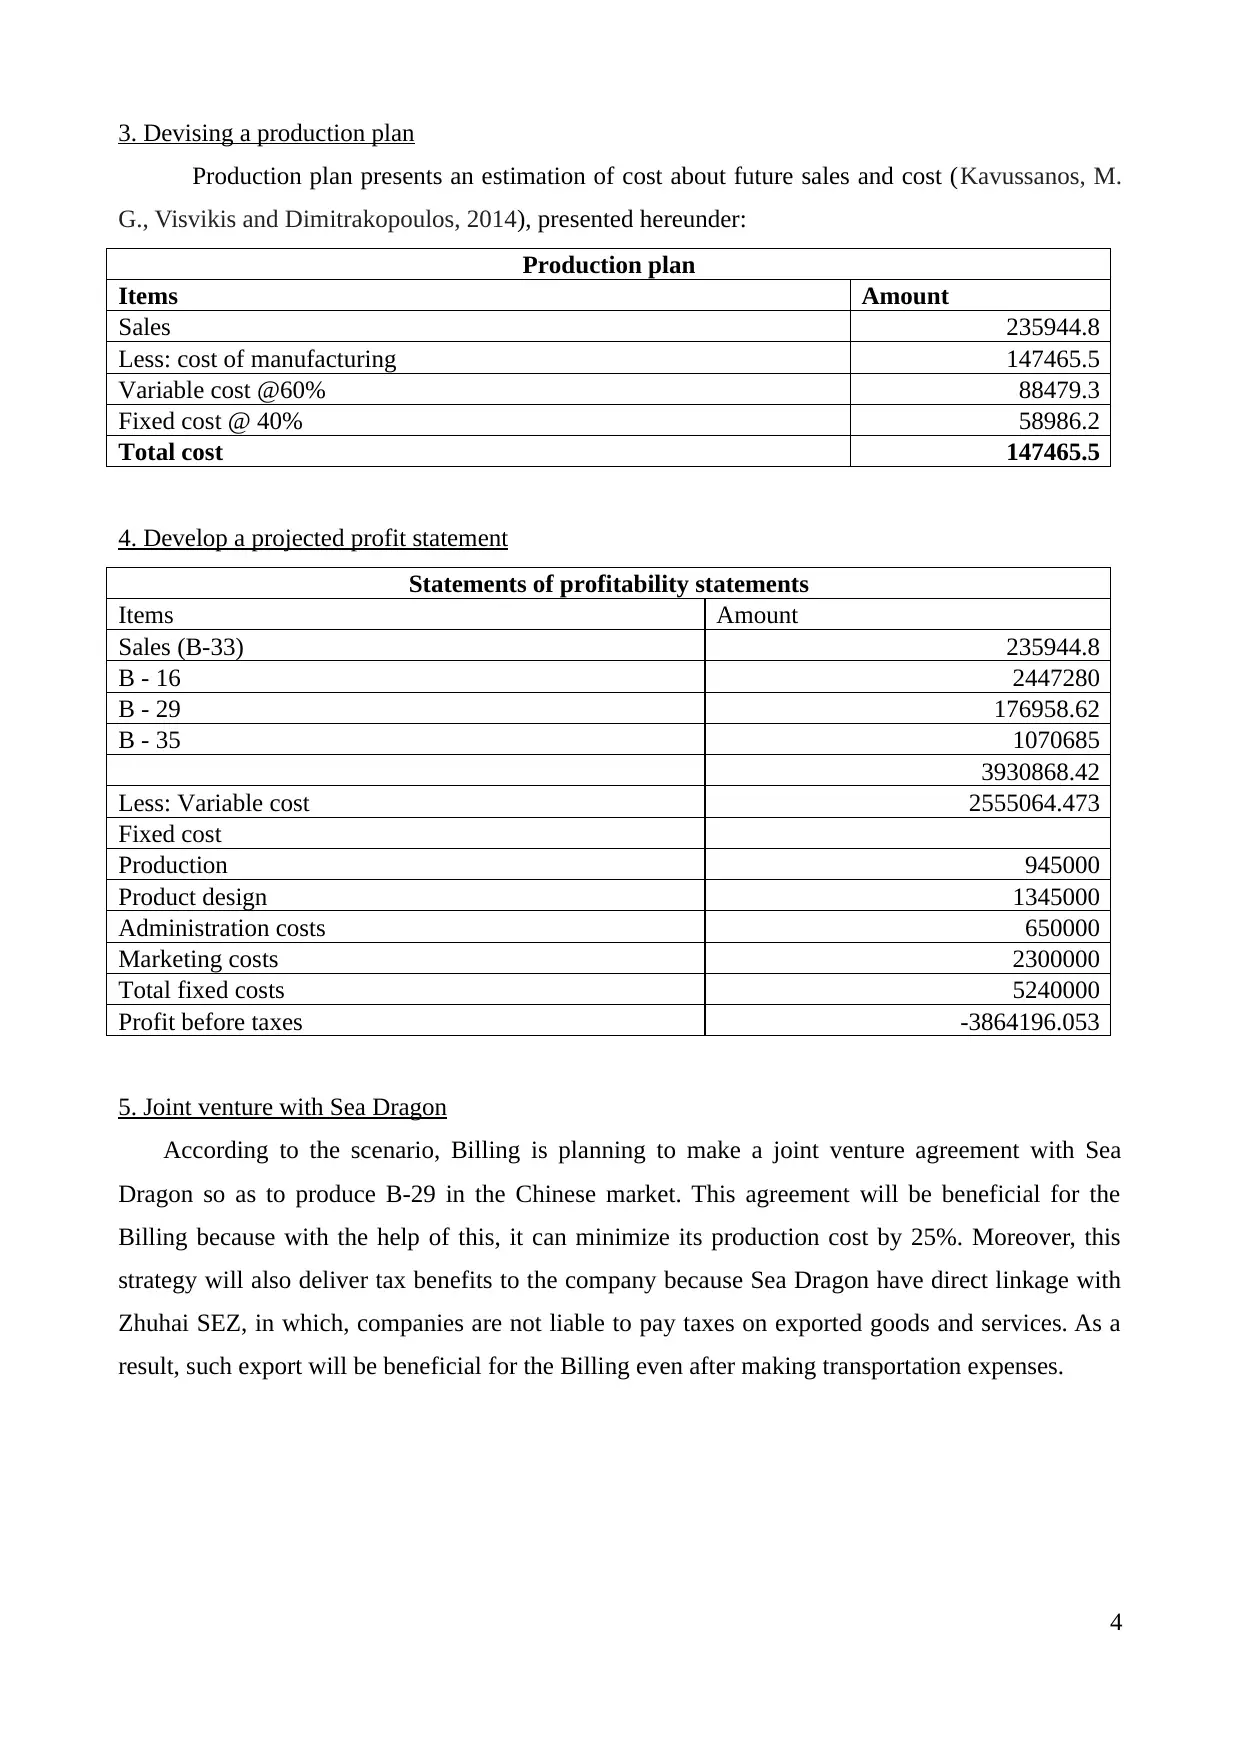
This report provides a financial analysis of Billing Boats AS, focusing on key aspects such as determining manufacturer's selling prices (ex-factory prices) in Norwegian currency, calculating CIF (Cost, Insurance, and Freight) prices, and devising a production plan. The analysis includes calculations of future year prices considering an inflation rate, along with the components of CIF prices. A projected profit statement is developed, outlining sales, variable and fixed costs, and resulting profit or loss before taxes. Furthermore, the report explores a potential joint venture with Sea Dragon, highlighting the benefits of reduced production costs and tax advantages through access to the Zhuhai SEZ. The report uses cited references to support the financial analyses and strategic recommendations.
Document Page
Billing Boats AS
1
tabler-icon-diamond-filled.svg

Paraphrase This Document

Need a fresh take? Get an instant paraphrase of this document with our AI Paraphraser
Document Page
Table of Contents
1. Determining manufacturer’s selling prices in Norwegian...........................................................3
2. Determining CIF prices...............................................................................................................3
3. Devising a production plan..........................................................................................................4
4. Develop a projected profit statement...........................................................................................4
5. Joint venture with Sea Dragon.....................................................................................................4
REFERENCES.....................................................................................................................................5
2
Document Page
1. Determining manufacturer’s selling prices in Norwegian
Ex-factory prices refer to the prices charges by the manufacturers by adding a mark-up on
their total production cost. It does not include cost of freight and insurance charges (Wilmsmeier
and Martinez-Zarzoso, 2010). With reference to the current scenario, prices for different items that
are B-16, B-29, B-33 and B-35 have been computed here by taking into account inflation rate of
Norwegian at 3% as under:
Ex-Factory prices
Items Current prices Inflation rate Future year prices
B-16 29700 3% 30591
B-29
B-33 356000 3% 366680
B-35 207900 3% 214137
2. Determining CIF prices
CIF (Cost, Insurance and Freight) overcomes the limitation of ex-factory prices as it take
into account the cost of insurance and freight also (Augurzky and et.al., 2009). The reason behind
this is as per the scenario, Billing is planning to introduce a new sailboat in their own factory,
henceforth, it has to pay expenses on freight and insurance, its prices has been calculated here as
under:
Calculation of CIF price for B-33
Countries
Cost
(NOK)
Insurance
and
freight CIF
Exchange
rate
Conversion
into
domestic
currency
Desired
profit
percentage
(60%)
Selling
prices
Denmark 29988.50 15500 45488.50 0.73 33206.61 19923.96 53130.57
Russia 29988.50 25000 54988.50 4.22 232051.5 139230.9 371282.4
Poland 29988.50 19000 48988.50 2.02 98956.77 59374.06 158330.8
Sweden 29988.50 12500 42488.50 0.73 31016.61 18609.96 49626.57
UK 29988.50 22500 52488.50 11.31 593644.9 356187 949831.9
Germany 29988.50 20500 50488.50 7.91 399364 239618.4 638982.5
Calculation of CIF price for B-29
Countries
Cost
(NOK) of
B-33 25% less
Cost of B-
29 (75% of
B-33)
Exchange
rate
Conversion
into
domestic
currency
Profit-
percentage
Selling
prices
Denmark 45488.50 11372.125 34116.38 0.73 24904.954 14942.972 39847.926
Russia 54988.50 13747.125 41241.38 4.22 174038.6 104423.16 278461.76
Poland 48988.50 12247.125 36741.38 2.02 74217.578 44530.547 118748.12
Sweden 42488.50 10622.125 31866.38 0.73 23262.454 13957.472 37219.926
UK 52488.50 13122.125 39366.38 11.31 445233.7 267140.22 712373.92
Germany 50488.50 12622.125 37866.38 7.91 299523.03 179713.82 479236.84
3
Document Page
3. Devising a production plan
Production plan presents an estimation of cost about future sales and cost (Kavussanos, M.
G., Visvikis and Dimitrakopoulos, 2014), presented hereunder:
Production plan
Items Amount
Sales 235944.8
Less: cost of manufacturing 147465.5
Variable cost @60% 88479.3
Fixed cost @ 40% 58986.2
Total cost 147465.5
4. Develop a projected profit statement
Statements of profitability statements
Items Amount
Sales (B-33) 235944.8
B - 16 2447280
B - 29 176958.62
B - 35 1070685
3930868.42
Less: Variable cost 2555064.473
Fixed cost
Production 945000
Product design 1345000
Administration costs 650000
Marketing costs 2300000
Total fixed costs 5240000
Profit before taxes -3864196.053
5. Joint venture with Sea Dragon
According to the scenario, Billing is planning to make a joint venture agreement with Sea
Dragon so as to produce B-29 in the Chinese market. This agreement will be beneficial for the
Billing because with the help of this, it can minimize its production cost by 25%. Moreover, this
strategy will also deliver tax benefits to the company because Sea Dragon have direct linkage with
Zhuhai SEZ, in which, companies are not liable to pay taxes on exported goods and services. As a
result, such export will be beneficial for the Billing even after making transportation expenses.
4
tabler-icon-diamond-filled.svg

Paraphrase This Document

Need a fresh take? Get an instant paraphrase of this document with our AI Paraphraser
Document Page
REFERENCES
Books and Journals
Augurzky, B. and et.al., 2009. Effects of the German reference drug program on exfactory prices of
prescription drugs: a panel data approach. Health Economics. 18(4). pp. 421-436.
Kavussanos, M. G., Visvikis, I. D. and Dimitrakopoulos, D. N., 2014. Economic spillovers between
related derivatives markets: The case of commodity and freight markets. Transportation
Research Part E: Logistics and Transportation Review. 68(12). pp. 79-102.
Wilmsmeier, G. and Martinez-Zarzoso, I., 2010. Determinants of maritime transport costs–a panel
data analysis for Latin American trade.Transportation Planning and Technology. 33(1). pp.
105-121.
5
chevron_up_icon
1 out of 5
circle_padding
hide_on_mobile
zoom_out_icon
[object Object]