ESM504 System Dynamics for Business Policy: Stock & Flow Mapping
VerifiedAdded on 2023/06/15
|23
|4010
|302
Report
AI Summary
This report focuses on mapping the stock and flow structure of systems, providing a detailed analysis of various models. It begins with mapping stock and flow networks for the UAE water system and the student lifecycle at Masdar Institute. The report describes the components and dynamics of each system, including water sources, storage, distribution, and student progression. It further explores the dynamics of accumulation, presenting graphs of net flow and stock value over time, analyzing slope and maximum/minimum values. Additionally, the report models goal-seeking processes, specifically focusing on defect elimination in a system, including a model of the improvement process and sensitivity analysis. The analysis includes dimensional consistency testing and model documentation, providing a comprehensive understanding of system dynamics principles. Desklib offers a range of similar solved assignments and study resources for students.
Running head: MAPPING THE STOCK AND FLOW STRUCTURE OF SYSTEMS
Assignment 3 - Mapping the Stock and Flow structure of Systems
Name of the Student:
Name of the University:
Assignment 3 - Mapping the Stock and Flow structure of Systems
Name of the Student:
Name of the University:
Paraphrase This Document
Need a fresh take? Get an instant paraphrase of this document with our AI Paraphraser
1MAPPING THE STOCK AND FLOW STRUCTURE OF SYSTEMS
Table of Contents
A. Mapping Stock and Flow Network.............................................................................................2
A 1. UAE Water System..............................................................................................................2
A 2. Student Lifecycle of Masdar Institute..................................................................................5
B. Dynamics of Accumulation........................................................................................................6
C. Modeling Goal-seeking Processes............................................................................................10
C 1. Model of the improvement process....................................................................................10
C 2. Model with the Base Case Parameters...............................................................................13
C 3. Different Values for the Average Defect Elimination Time..............................................15
C 4. Equilibrium Defect Rate in Terms of the Other Parameters..............................................17
C 5. Sensitivity of the model’s results to the choice of the time step or “dt”............................18
References......................................................................................................................................21
2MAPPING THE STOCK AND FLOW STRUCTURE OF SYSTEMS
A. Mapping Stock and Flow Network
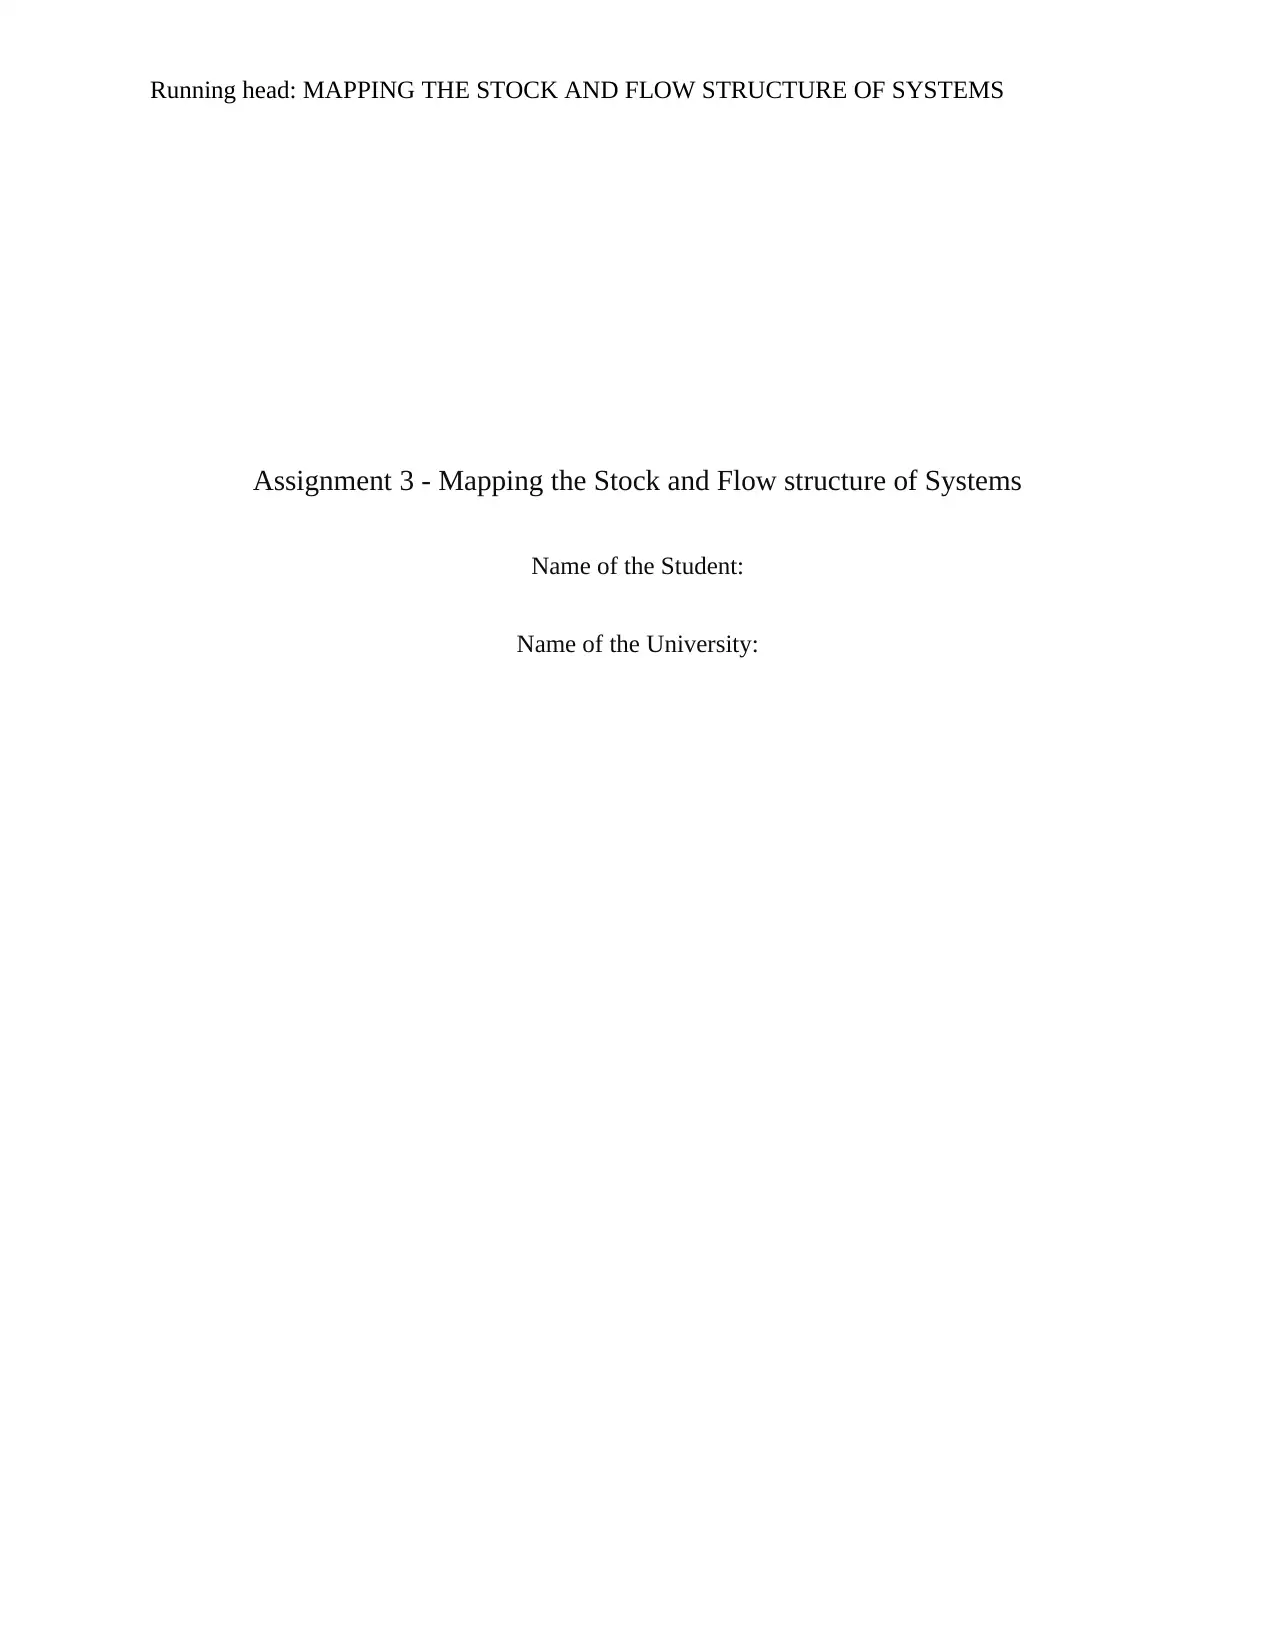
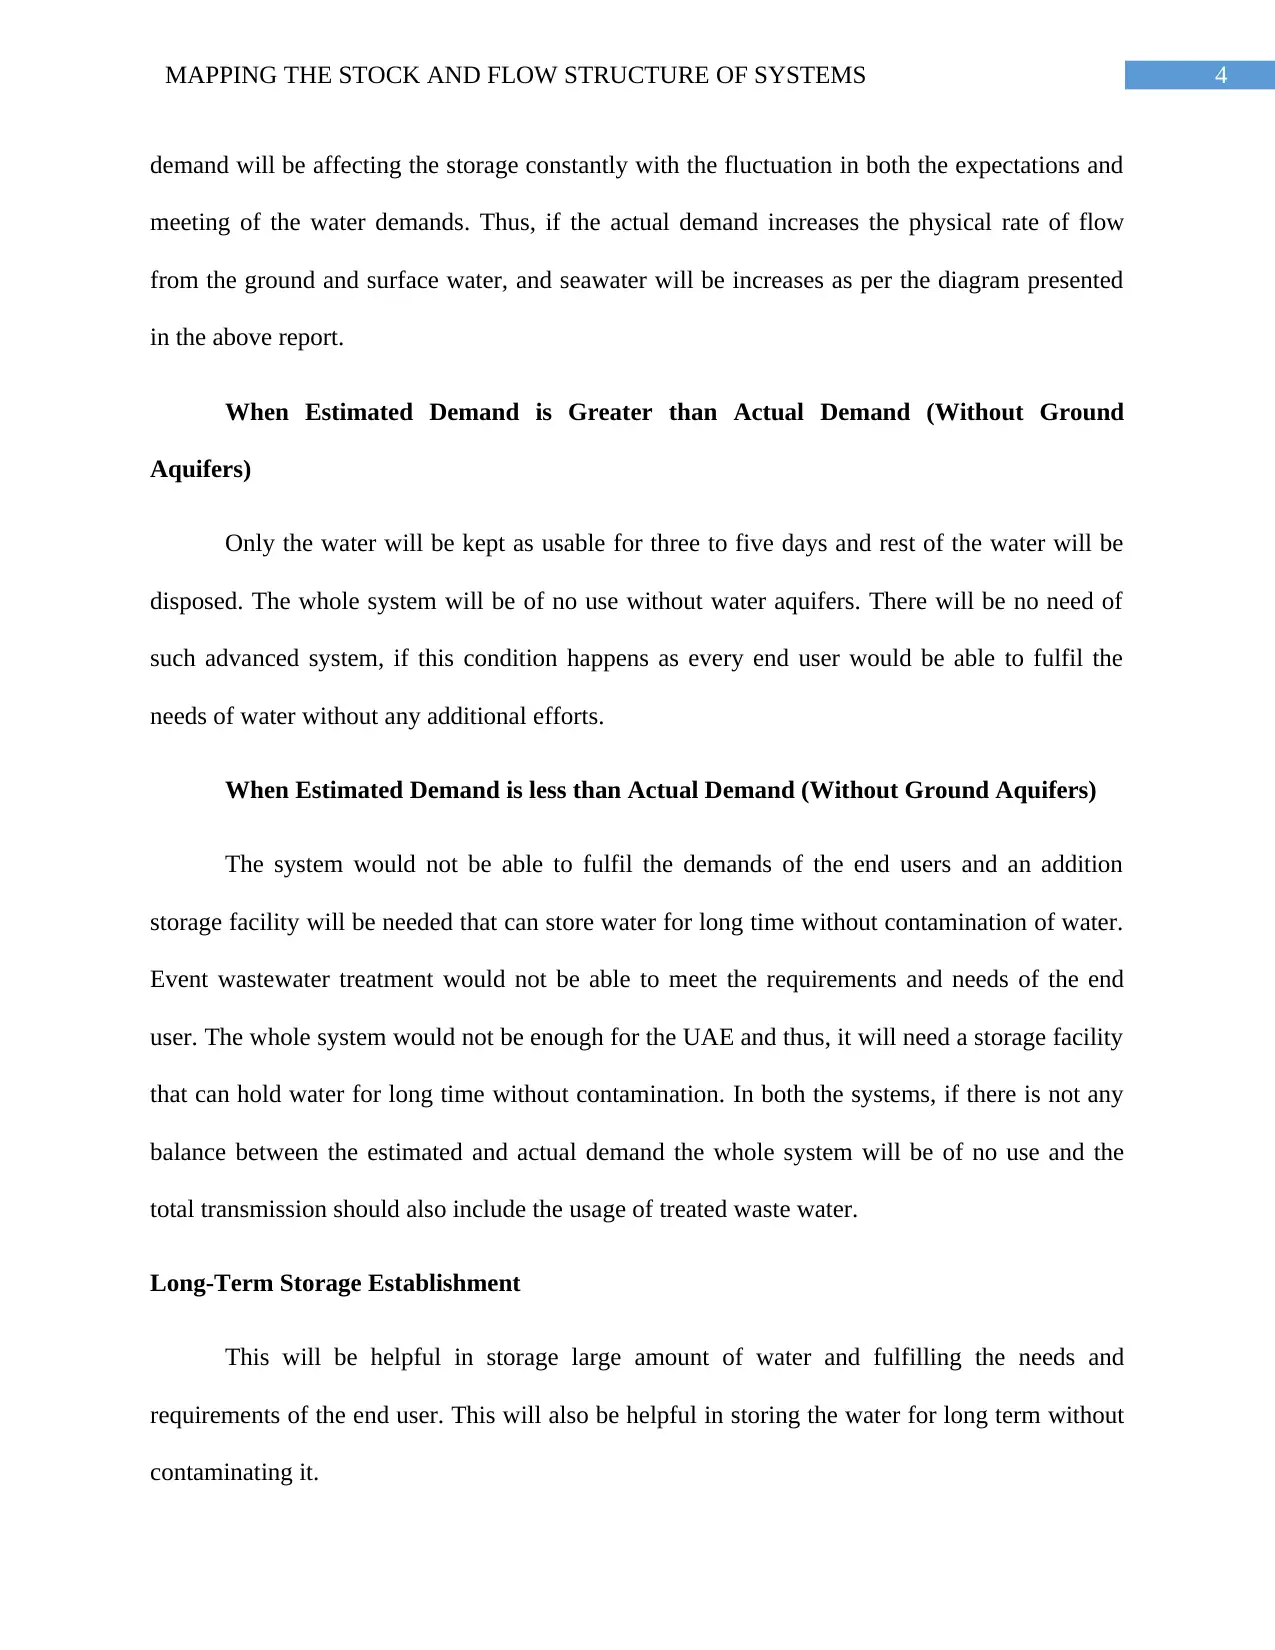
A 1. UAE Water System
Figure 1: UAE Water System
(Source: Created by Author)
Description of the Model
1) Sea Water
Sea Water is collected through pumping with a rate of volume / time and being transferred to the
desalination and after desalinating the water is being transferred to storage system. The water is
stored in either the tanks (for 3-5 days storage) or in ground aquifers for long-term usage. That is
A. Mapping Stock and Flow Network
A 1. UAE Water System
Figure 1: UAE Water System
(Source: Created by Author)
Description of the Model
1) Sea Water
Sea Water is collected through pumping with a rate of volume / time and being transferred to the
desalination and after desalinating the water is being transferred to storage system. The water is
stored in either the tanks (for 3-5 days storage) or in ground aquifers for long-term usage. That is
⊘ This is a preview!⊘
Do you want full access?
Subscribe today to unlock all pages.
Trusted by 1+ million students worldwide
3MAPPING THE STOCK AND FLOW STRUCTURE OF SYSTEMS
further being transferred to the dispatch centre, from where the water is being supplied to all the
sectors (Industrial, Agricultural, and Domestic Use).
2) Surface and Ground Water (Rain, spring, Pond)
The water is being collected from the ground and surface route and is being stored to the storage.
The same process followed after the water reaches to the dispatch centre and further it is
transferred to each sectors. The water is stored in either the tanks (for 3-5 days storage) or in
ground aquifers for long-term usage.
3) Storage
The expected demand cannot be fulfilled without storage system and thus, it includes tanks for
the storage of water for 3 – 5 days and for long-term Ground Aquifers have been installed.
Thereafter, the water s supplied to the dispatch centre from where, all the sectors are supplied to
meet the expected demand.
4) Waste Water
Waste Water is collected from each sector and thereafter, it is treated to make it better and germs
free and then usable water is transferred to the landscaping sector and rest are dumped.
Expected and Actual Demand
Sum of transmission rate of surface and ground water, and transmission rate of seawater
is the expected demand of the UAE population and sum of Distribution ‘A’, ‘I’ and ‘D’, is the
Actual Demand of the community. Both the demands are positively correlated with the
production and transmission rate and increase in the actual demand will increase the physical
flow of the water from the distribution of the seawater, and ground and surface water. Estimated
Paraphrase This Document
Need a fresh take? Get an instant paraphrase of this document with our AI Paraphraser
4MAPPING THE STOCK AND FLOW STRUCTURE OF SYSTEMS
demand will be affecting the storage constantly with the fluctuation in both the expectations and
meeting of the water demands. Thus, if the actual demand increases the physical rate of flow
from the ground and surface water, and seawater will be increases as per the diagram presented
in the above report.
When Estimated Demand is Greater than Actual Demand (Without Ground
Aquifers)
Only the water will be kept as usable for three to five days and rest of the water will be
disposed. The whole system will be of no use without water aquifers. There will be no need of
such advanced system, if this condition happens as every end user would be able to fulfil the
needs of water without any additional efforts.
When Estimated Demand is less than Actual Demand (Without Ground Aquifers)
The system would not be able to fulfil the demands of the end users and an addition
storage facility will be needed that can store water for long time without contamination of water.
Event wastewater treatment would not be able to meet the requirements and needs of the end
user. The whole system would not be enough for the UAE and thus, it will need a storage facility
that can hold water for long time without contamination. In both the systems, if there is not any
balance between the estimated and actual demand the whole system will be of no use and the
total transmission should also include the usage of treated waste water.
Long-Term Storage Establishment
This will be helpful in storage large amount of water and fulfilling the needs and
requirements of the end user. This will also be helpful in storing the water for long term without
contaminating it.
5MAPPING THE STOCK AND FLOW STRUCTURE OF SYSTEMS
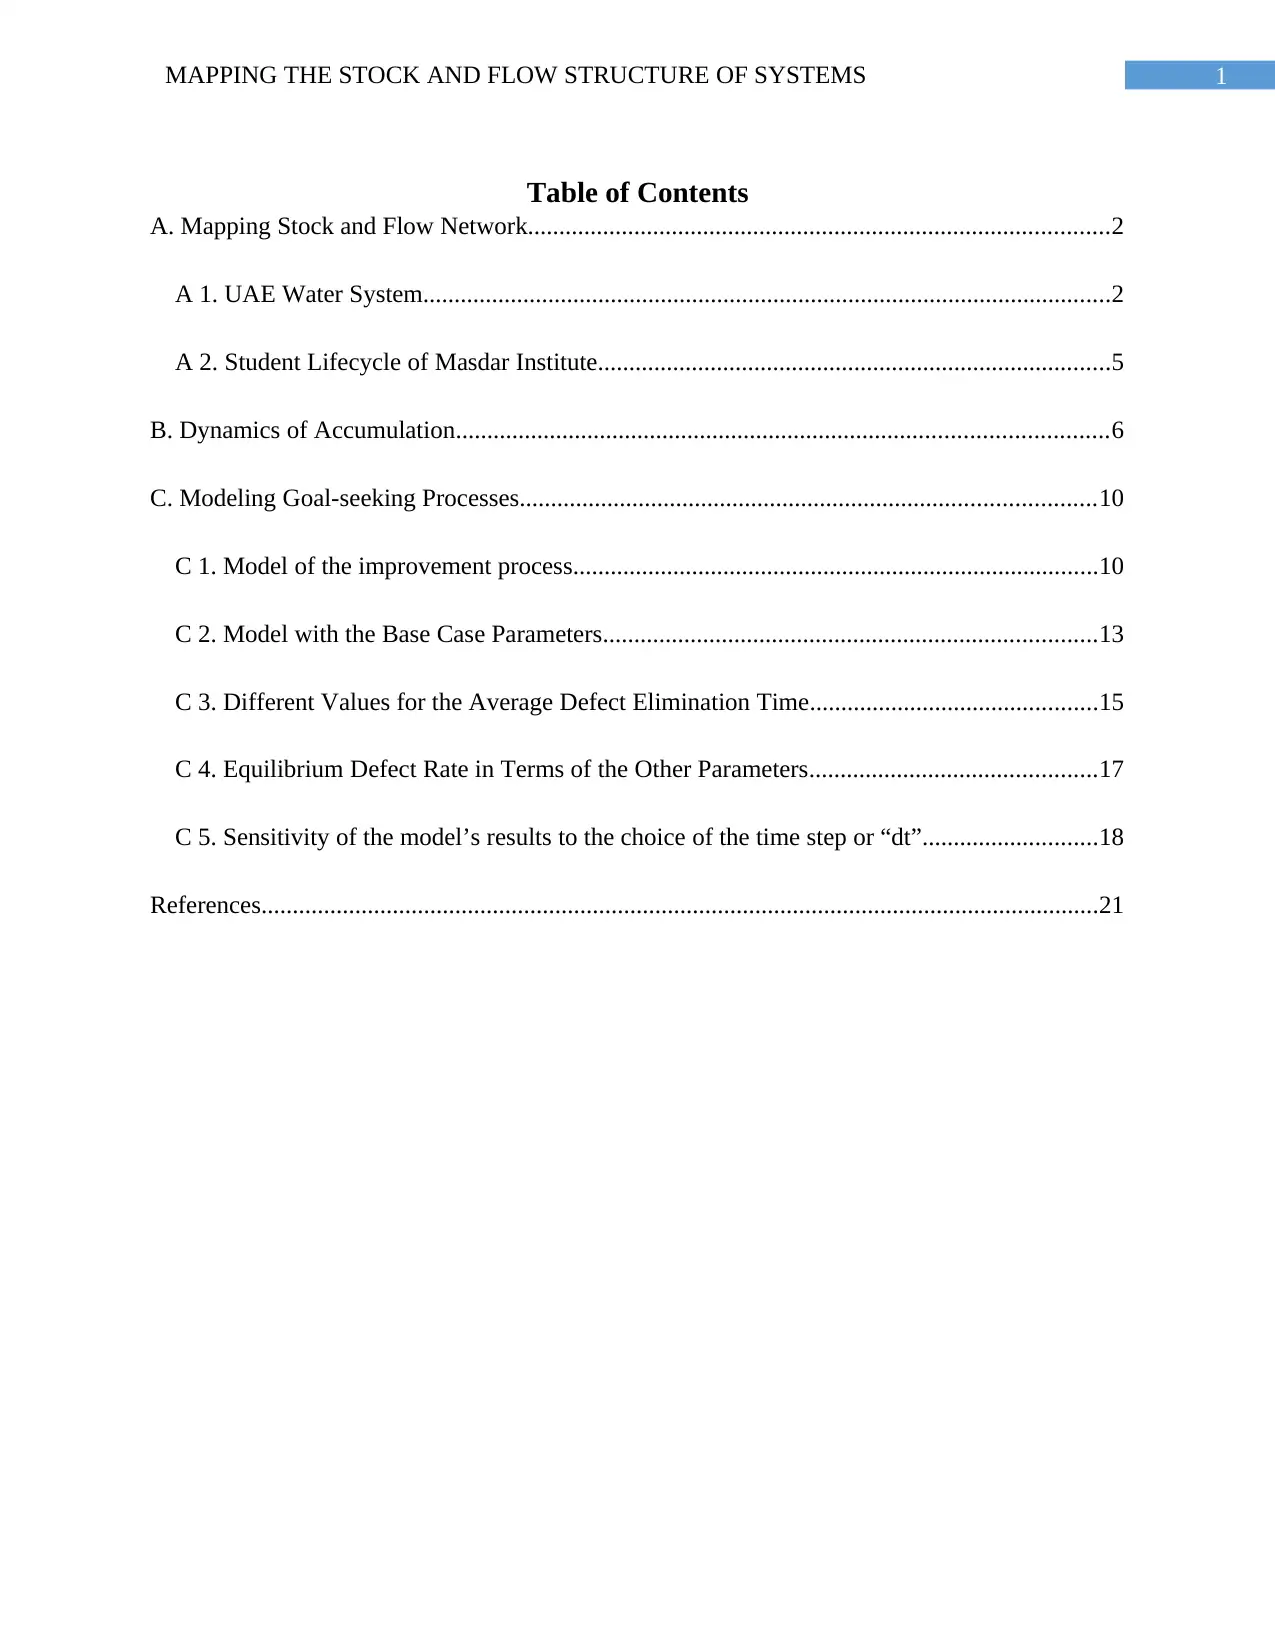
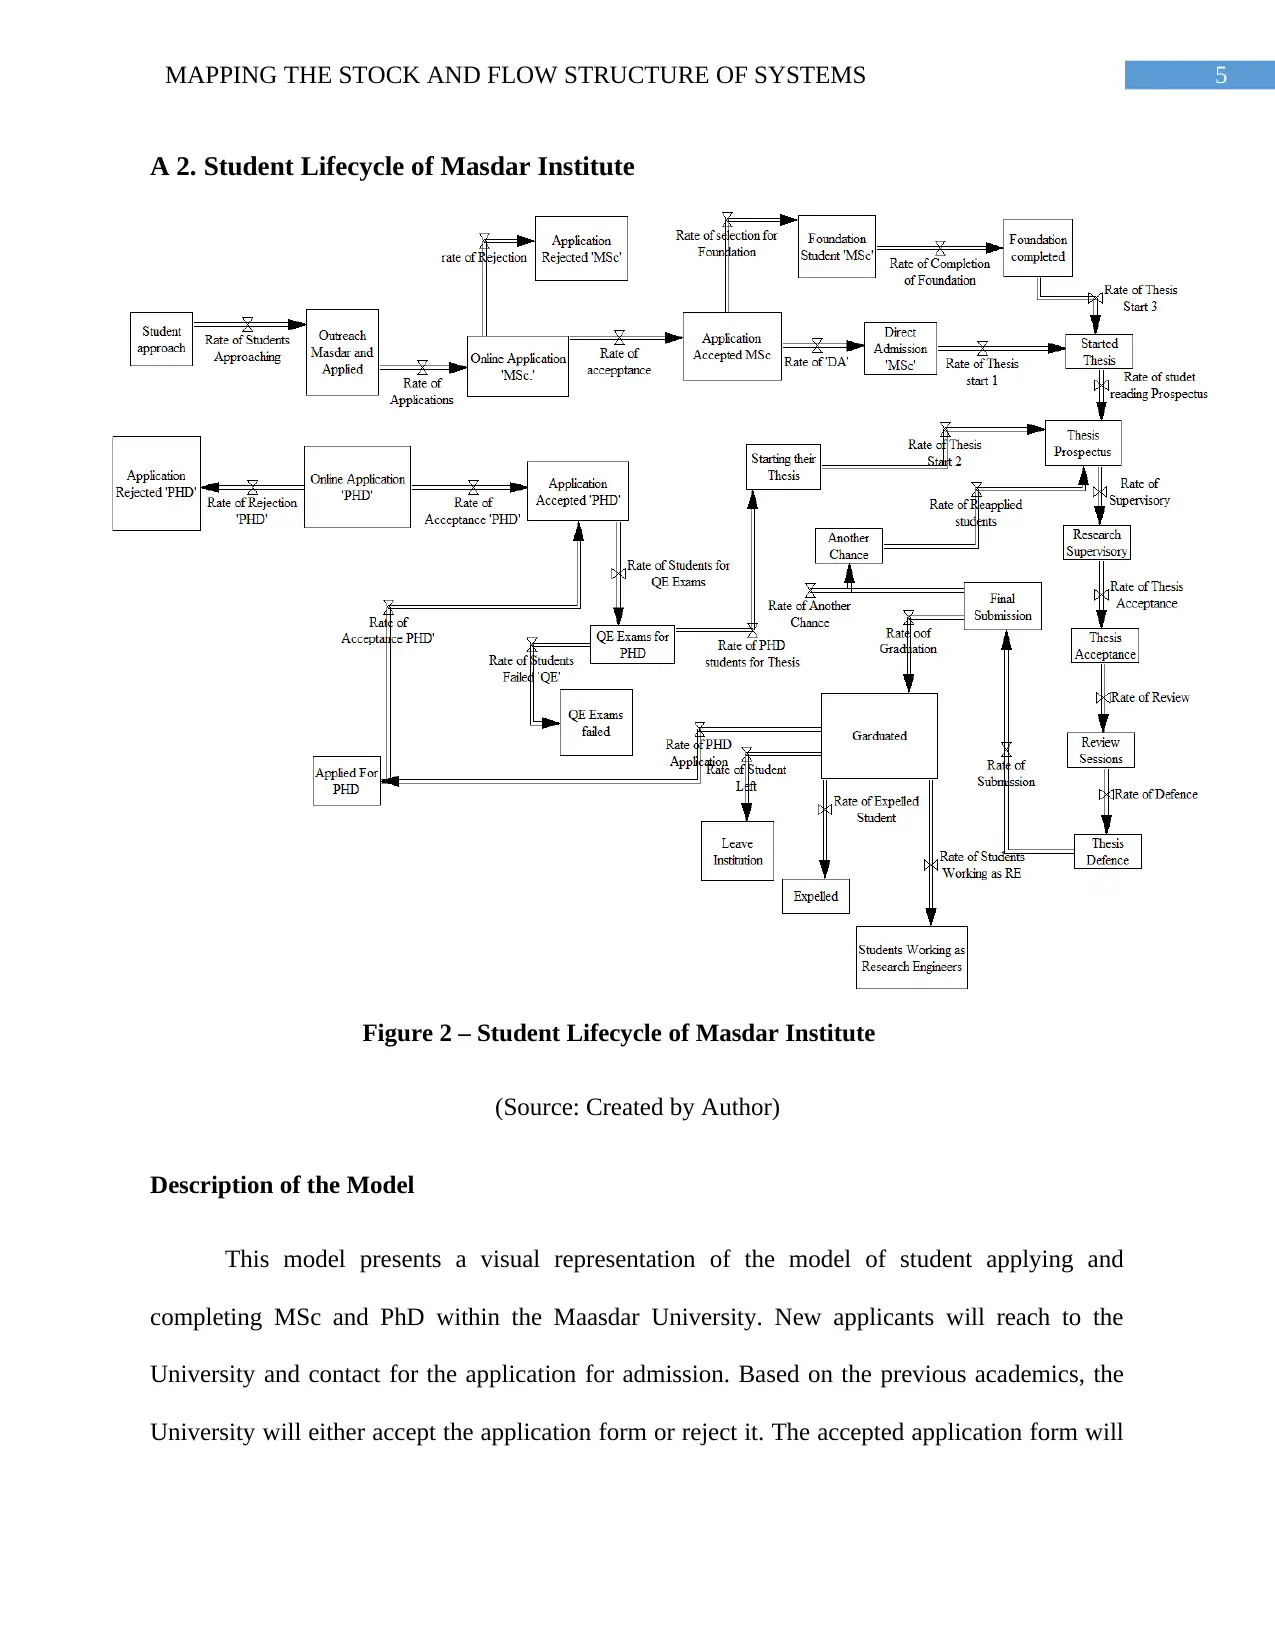
A 2. Student Lifecycle of Masdar Institute
Figure 2 – Student Lifecycle of Masdar Institute
(Source: Created by Author)
Description of the Model
This model presents a visual representation of the model of student applying and
completing MSc and PhD within the Maasdar University. New applicants will reach to the
University and contact for the application for admission. Based on the previous academics, the
University will either accept the application form or reject it. The accepted application form will
⊘ This is a preview!⊘
Do you want full access?
Subscribe today to unlock all pages.
Trusted by 1+ million students worldwide
6MAPPING THE STOCK AND FLOW STRUCTURE OF SYSTEMS
allow the applicant to reach to the direct admission procedure or move to the foundation studies.
Thereafter, the direct admitted student and student completed foundation will be allowed to
move forward for the thesis preparation. The thesis prospectus will introduced to the students
applying for direct PhD or after the completion of MSc from the same university. Thesis
prospectus entity will be joined by three rate of this including the direct PhD students, after
foundation completing student, and Applying after MSc completion from the same university.
MSc students will be then forwarded to the supervising sector, where there the thesis will be
accepted after review. Thereafter, the MSc and PhD students will make the final submission and
then the path will be subdivided for the graduated and less marks gathering students. The
graduated students who secured less marks or failed will be provided with second chance or
expelled and second chance getting student will be resend to the thesis prospectus procedure
where, he or she will have to complete all the procedures again. Some students after passing the
exam will work as RE, apply for PhD, Left the University, or expelled from the university. The
system will continue for the students who apply for PhD and will have to appear with the
students applying for the PhD in the QE exam. Selection will be made based on performance
provided in the QE exam and failed students will not move forward with the students appearing
for the thesis presentation.
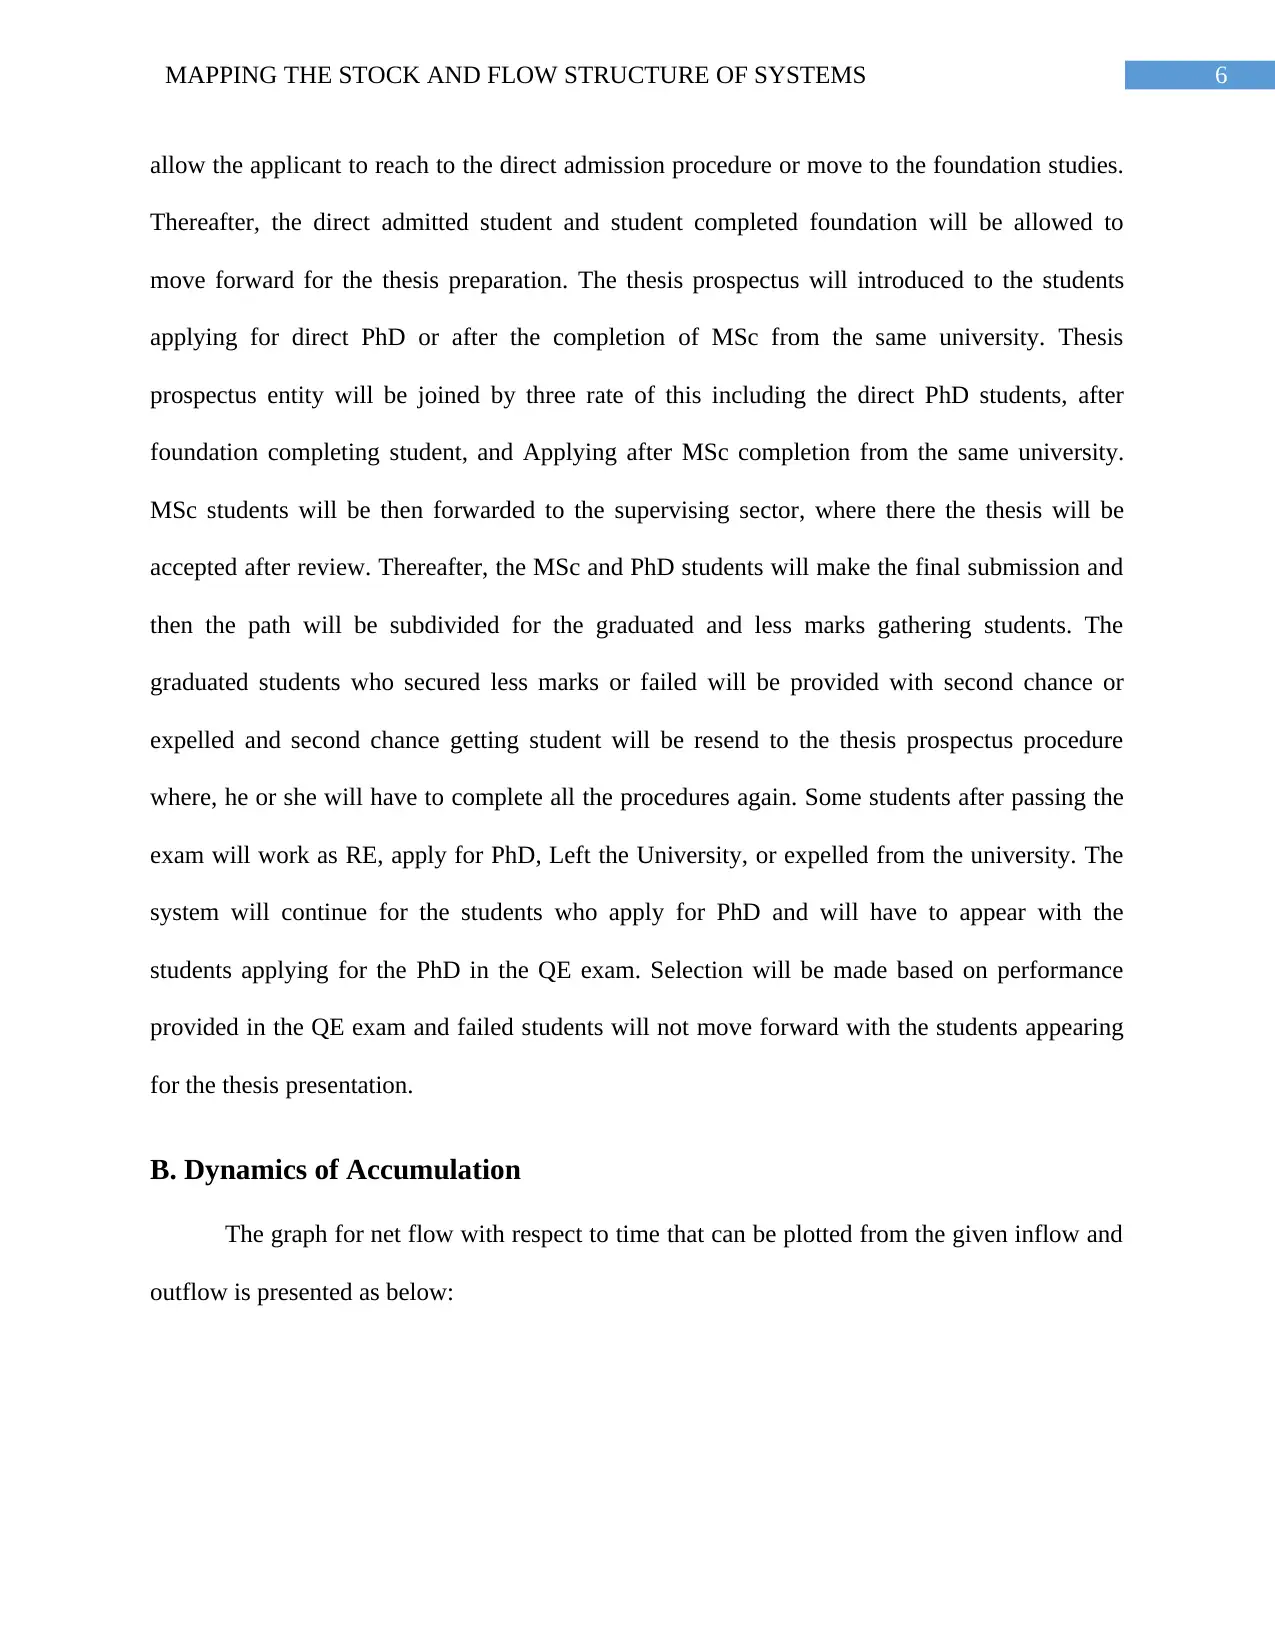
B. Dynamics of Accumulation
The graph for net flow with respect to time that can be plotted from the given inflow and
outflow is presented as below:
allow the applicant to reach to the direct admission procedure or move to the foundation studies.
Thereafter, the direct admitted student and student completed foundation will be allowed to
move forward for the thesis preparation. The thesis prospectus will introduced to the students
applying for direct PhD or after the completion of MSc from the same university. Thesis
prospectus entity will be joined by three rate of this including the direct PhD students, after
foundation completing student, and Applying after MSc completion from the same university.
MSc students will be then forwarded to the supervising sector, where there the thesis will be
accepted after review. Thereafter, the MSc and PhD students will make the final submission and
then the path will be subdivided for the graduated and less marks gathering students. The
graduated students who secured less marks or failed will be provided with second chance or
expelled and second chance getting student will be resend to the thesis prospectus procedure
where, he or she will have to complete all the procedures again. Some students after passing the
exam will work as RE, apply for PhD, Left the University, or expelled from the university. The
system will continue for the students who apply for PhD and will have to appear with the
students applying for the PhD in the QE exam. Selection will be made based on performance
provided in the QE exam and failed students will not move forward with the students appearing
for the thesis presentation.
B. Dynamics of Accumulation
The graph for net flow with respect to time that can be plotted from the given inflow and
outflow is presented as below:
Paraphrase This Document
Need a fresh take? Get an instant paraphrase of this document with our AI Paraphraser
7MAPPING THE STOCK AND FLOW STRUCTURE OF SYSTEMS
0 5 10 15 20 25
-60
-40
-20
0
20
40
60
Net Flow Rate vs Time
Figure 3: Net Flow rate vs Time graph
(Source: Created by Author)
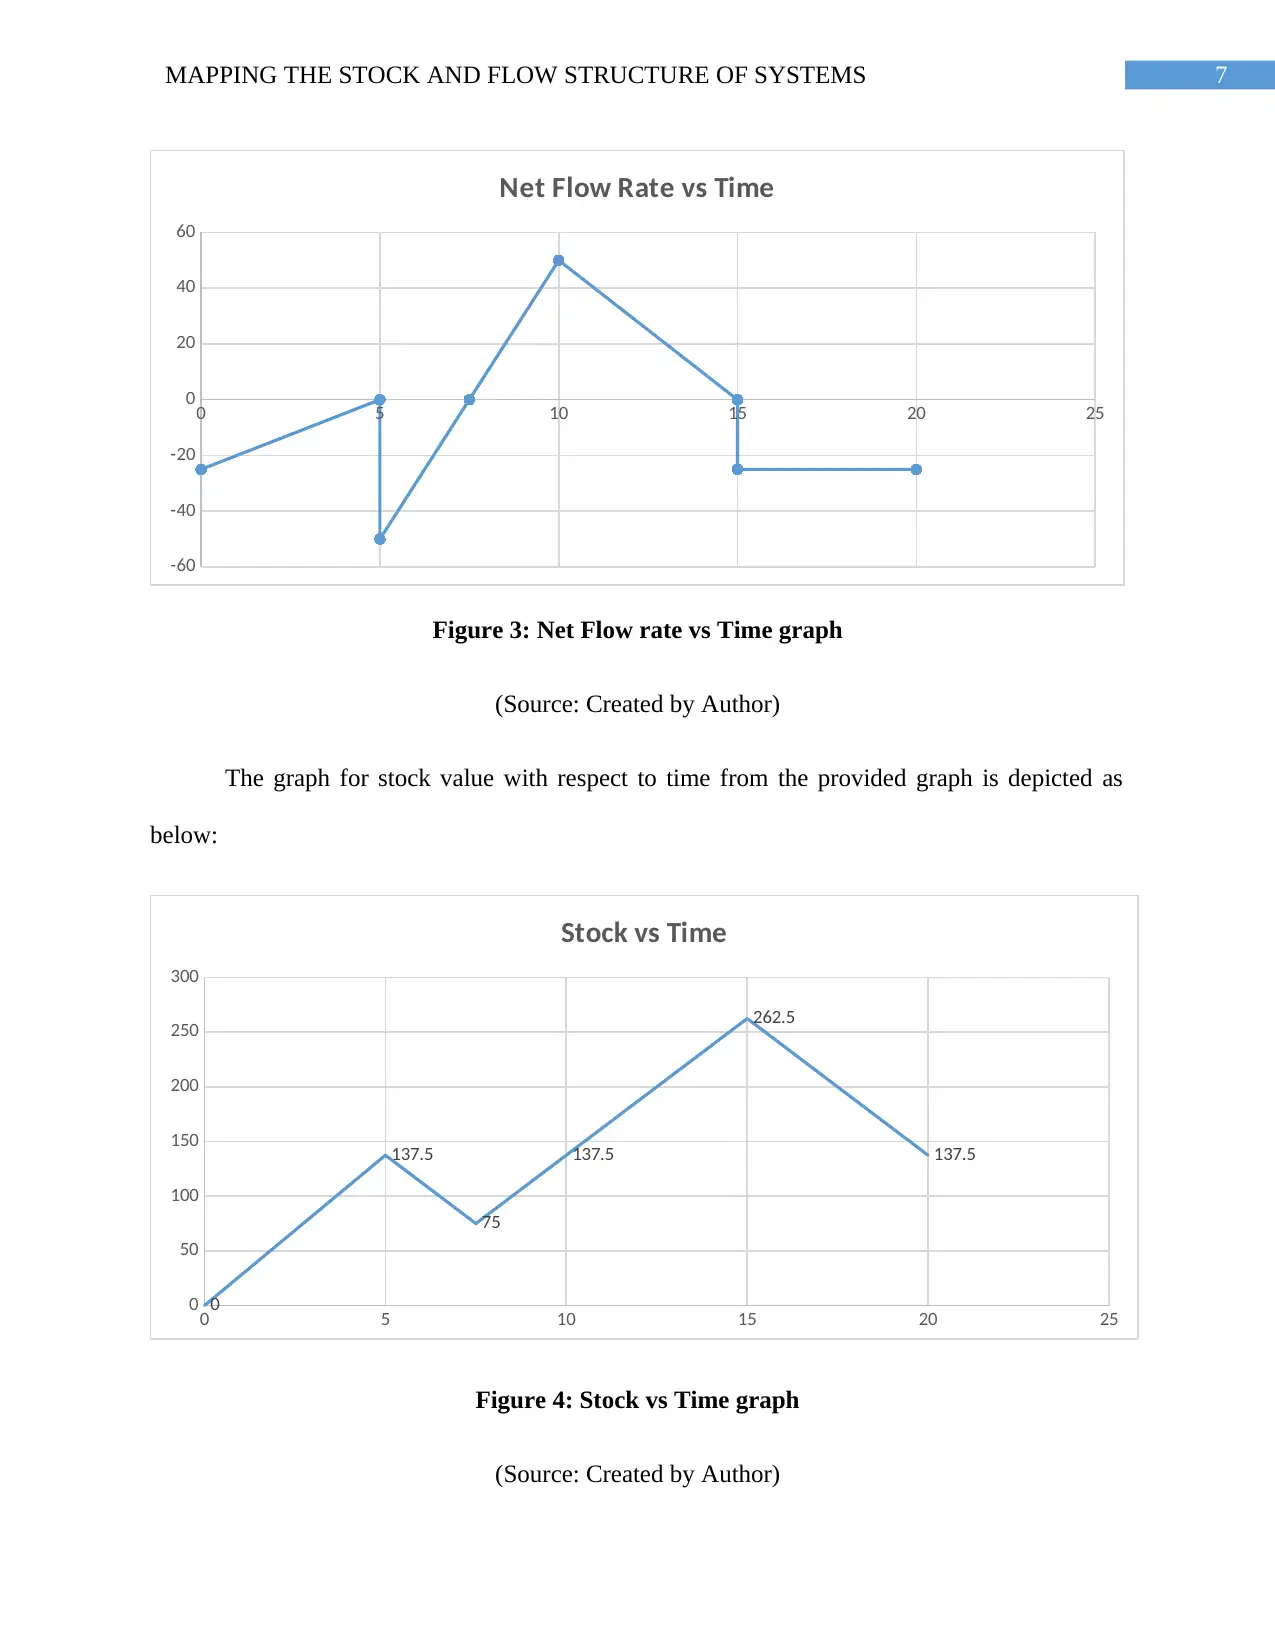
The graph for stock value with respect to time from the provided graph is depicted as
below:
0 5 10 15 20 25
0
50
100
150
200
250
300
0
137.5
75
137.5
262.5
137.5
Stock vs Time
Figure 4: Stock vs Time graph
(Source: Created by Author)
0 5 10 15 20 25
-60
-40
-20
0
20
40
60
Net Flow Rate vs Time
Figure 3: Net Flow rate vs Time graph
(Source: Created by Author)
The graph for stock value with respect to time from the provided graph is depicted as
below:
0 5 10 15 20 25
0
50
100
150
200
250
300
0
137.5
75
137.5
262.5
137.5
Stock vs Time
Figure 4: Stock vs Time graph
(Source: Created by Author)
8MAPPING THE STOCK AND FLOW STRUCTURE OF SYSTEMS
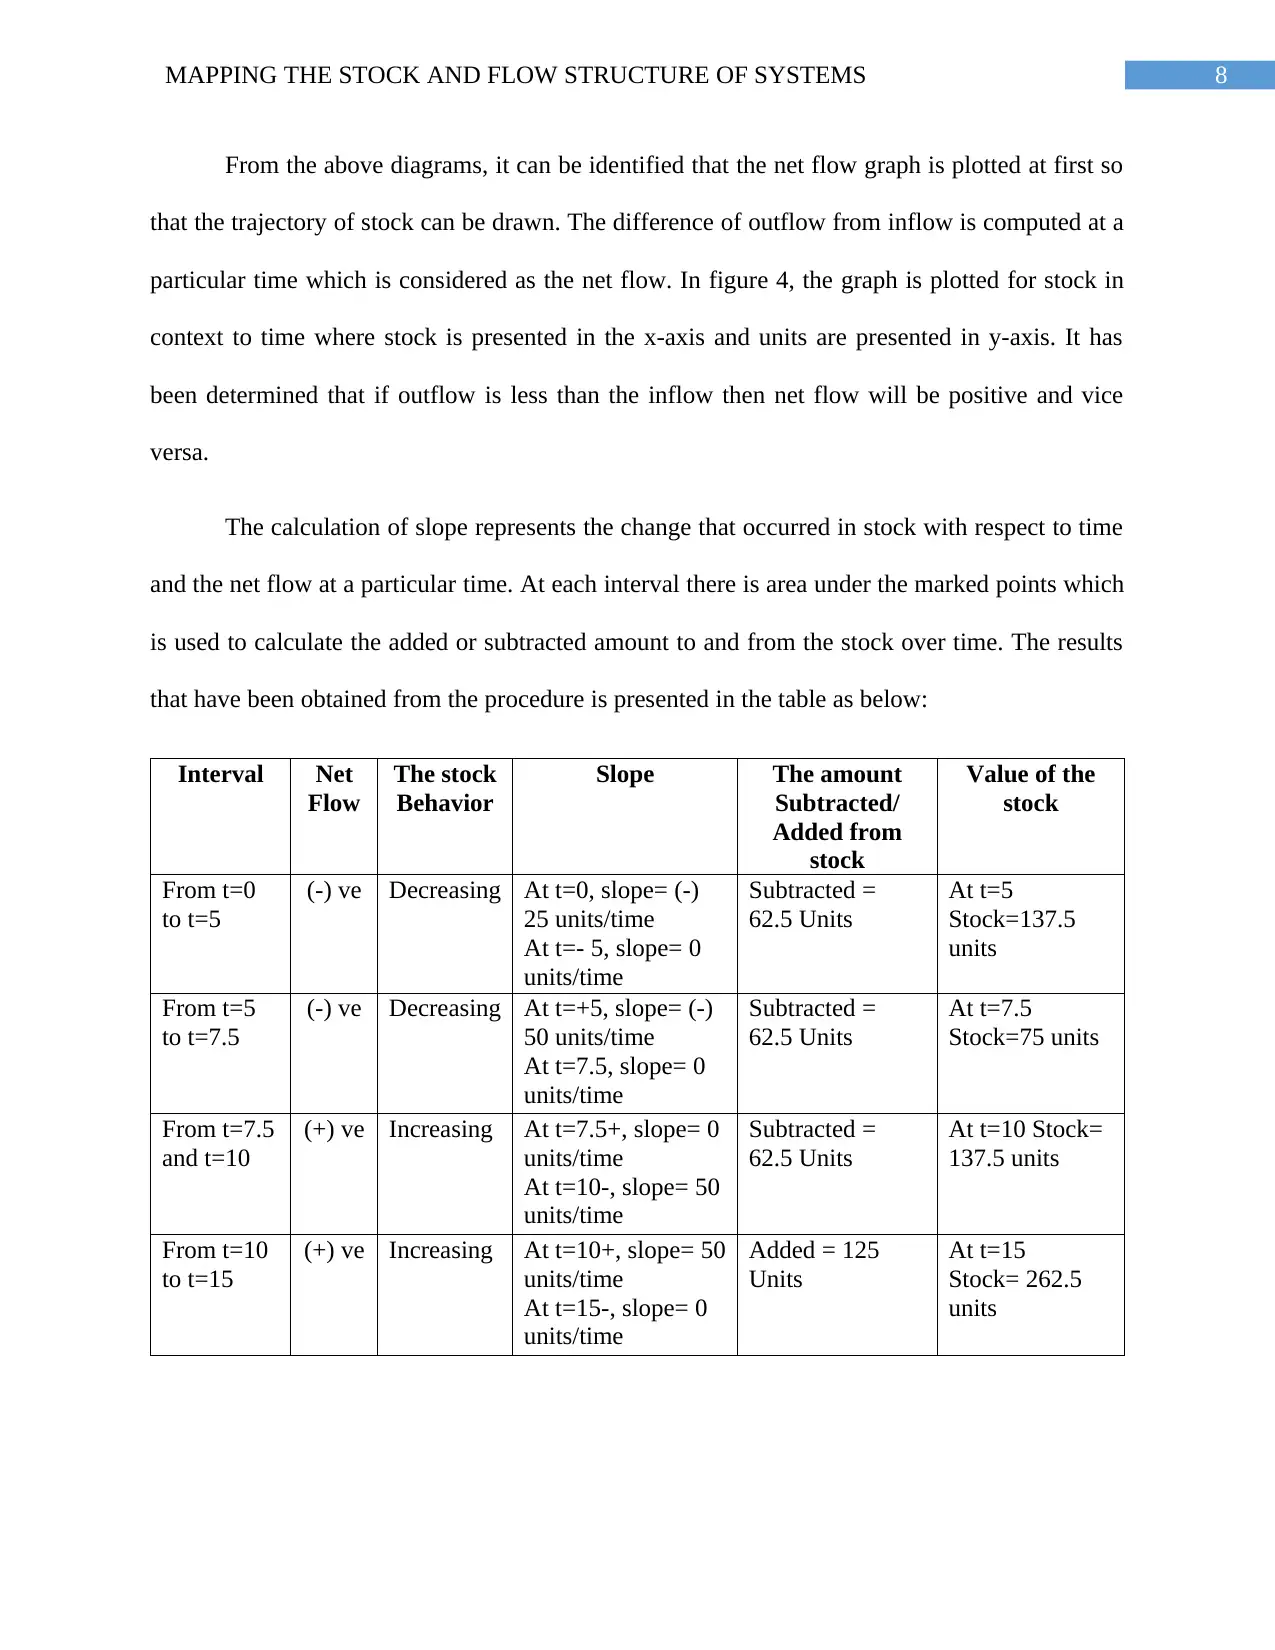
From the above diagrams, it can be identified that the net flow graph is plotted at first so
that the trajectory of stock can be drawn. The difference of outflow from inflow is computed at a
particular time which is considered as the net flow. In figure 4, the graph is plotted for stock in
context to time where stock is presented in the x-axis and units are presented in y-axis. It has
been determined that if outflow is less than the inflow then net flow will be positive and vice
versa.
The calculation of slope represents the change that occurred in stock with respect to time
and the net flow at a particular time. At each interval there is area under the marked points which
is used to calculate the added or subtracted amount to and from the stock over time. The results
that have been obtained from the procedure is presented in the table as below:
Interval Net
Flow
The stock
Behavior
Slope The amount
Subtracted/
Added from
stock
Value of the
stock
From t=0
to t=5
(-) ve Decreasing At t=0, slope= (-)
25 units/time
At t=- 5, slope= 0
units/time
Subtracted =
62.5 Units
At t=5
Stock=137.5
units
From t=5
to t=7.5
(-) ve Decreasing At t=+5, slope= (-)
50 units/time
At t=7.5, slope= 0
units/time
Subtracted =
62.5 Units
At t=7.5
Stock=75 units
From t=7.5
and t=10
(+) ve Increasing At t=7.5+, slope= 0
units/time
At t=10-, slope= 50
units/time
Subtracted =
62.5 Units
At t=10 Stock=
137.5 units
From t=10
to t=15
(+) ve Increasing At t=10+, slope= 50
units/time
At t=15-, slope= 0
units/time
Added = 125
Units
At t=15
Stock= 262.5
units
⊘ This is a preview!⊘
Do you want full access?
Subscribe today to unlock all pages.
Trusted by 1+ million students worldwide
9MAPPING THE STOCK AND FLOW STRUCTURE OF SYSTEMS
From t=15
to t=20
(-) ve Constant At t=15+, slope= (-)
25 units/time
At t=20-, slope= (-)
25 units/time
Subtracted = 125
Units
At t=20 Stock=
137.5
Table 1: Interval, net flow, stock behavior, slope, amount and the value of stock
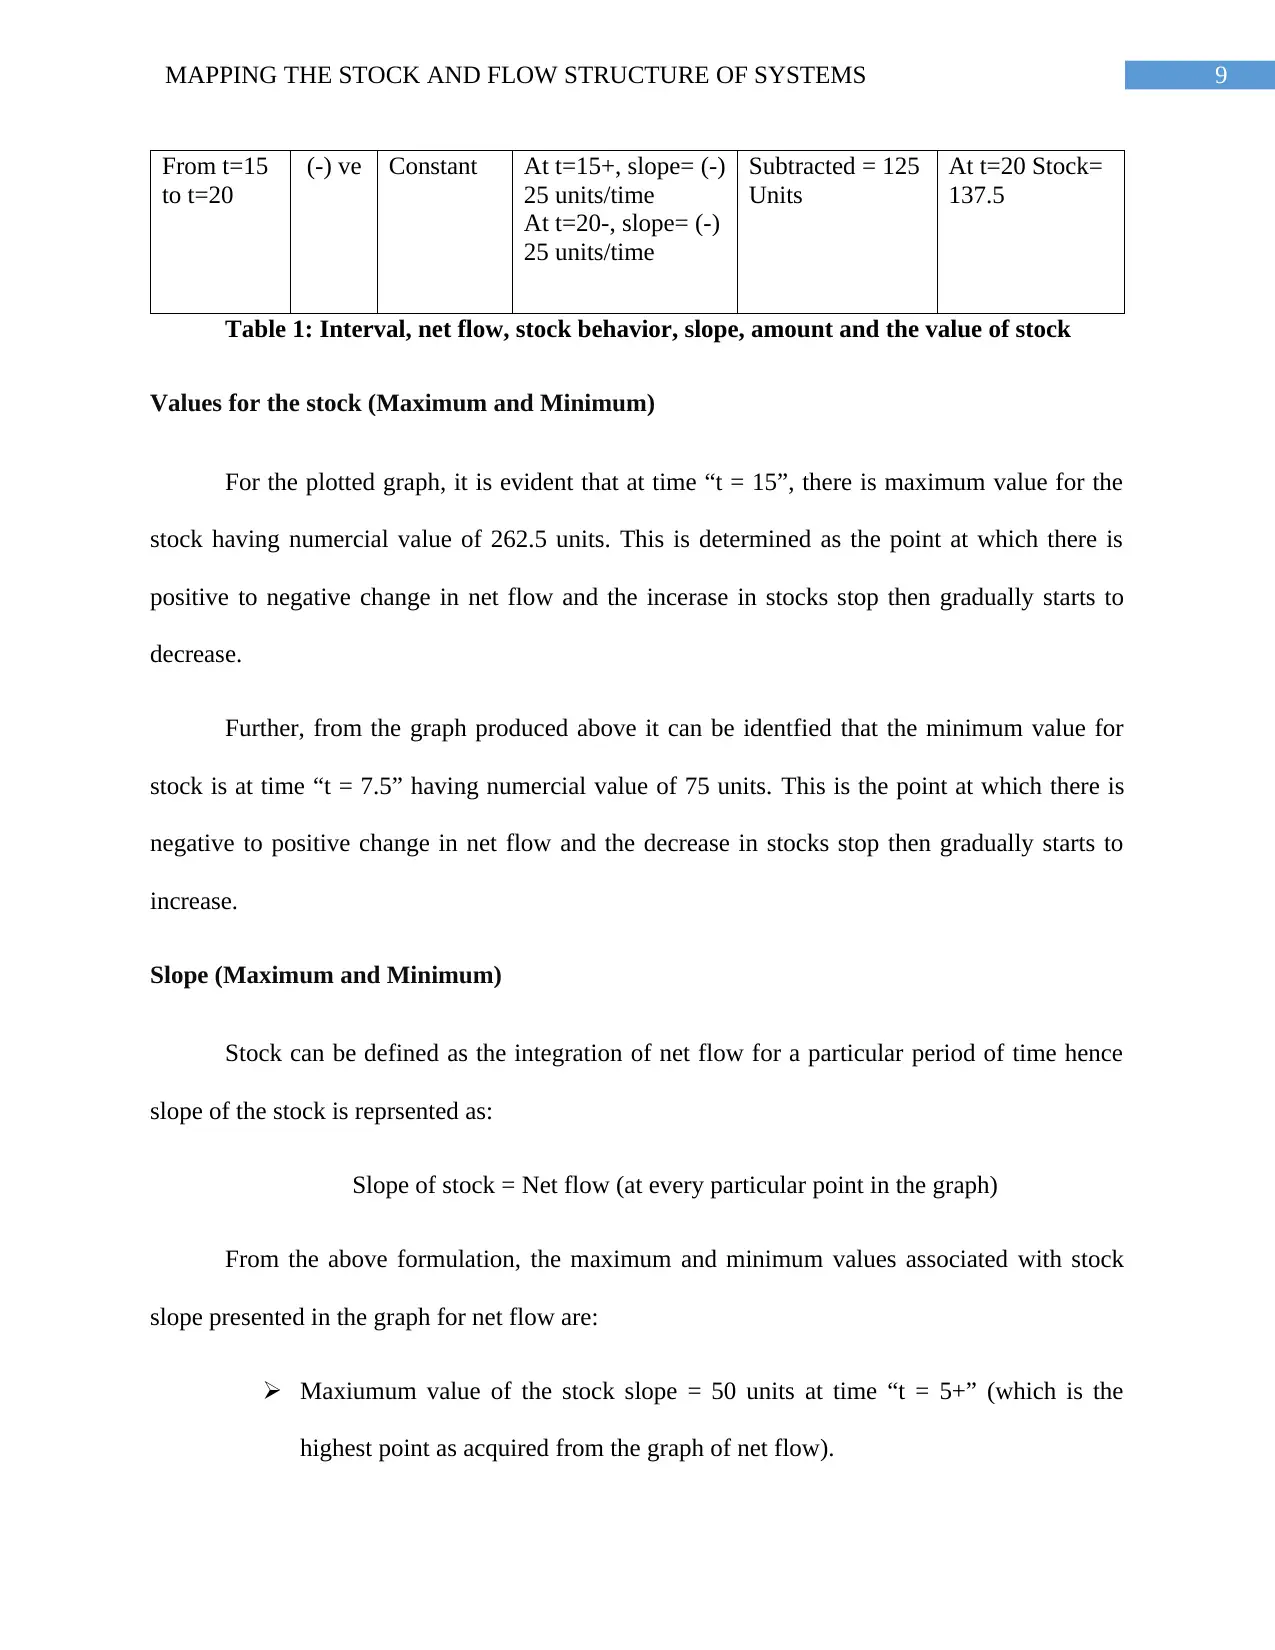
Values for the stock (Maximum and Minimum)
For the plotted graph, it is evident that at time “t = 15”, there is maximum value for the
stock having numercial value of 262.5 units. This is determined as the point at which there is
positive to negative change in net flow and the incerase in stocks stop then gradually starts to
decrease.
Further, from the graph produced above it can be identfied that the minimum value for
stock is at time “t = 7.5” having numercial value of 75 units. This is the point at which there is
negative to positive change in net flow and the decrease in stocks stop then gradually starts to
increase.
Slope (Maximum and Minimum)
Stock can be defined as the integration of net flow for a particular period of time hence
slope of the stock is reprsented as:
Slope of stock = Net flow (at every particular point in the graph)
From the above formulation, the maximum and minimum values associated with stock
slope presented in the graph for net flow are:
Maxiumum value of the stock slope = 50 units at time “t = 5+” (which is the
highest point as acquired from the graph of net flow).
From t=15
to t=20
(-) ve Constant At t=15+, slope= (-)
25 units/time
At t=20-, slope= (-)
25 units/time
Subtracted = 125
Units
At t=20 Stock=
137.5
Table 1: Interval, net flow, stock behavior, slope, amount and the value of stock
Values for the stock (Maximum and Minimum)
For the plotted graph, it is evident that at time “t = 15”, there is maximum value for the
stock having numercial value of 262.5 units. This is determined as the point at which there is
positive to negative change in net flow and the incerase in stocks stop then gradually starts to
decrease.
Further, from the graph produced above it can be identfied that the minimum value for
stock is at time “t = 7.5” having numercial value of 75 units. This is the point at which there is
negative to positive change in net flow and the decrease in stocks stop then gradually starts to
increase.
Slope (Maximum and Minimum)
Stock can be defined as the integration of net flow for a particular period of time hence
slope of the stock is reprsented as:
Slope of stock = Net flow (at every particular point in the graph)
From the above formulation, the maximum and minimum values associated with stock
slope presented in the graph for net flow are:
Maxiumum value of the stock slope = 50 units at time “t = 5+” (which is the
highest point as acquired from the graph of net flow).
Paraphrase This Document
Need a fresh take? Get an instant paraphrase of this document with our AI Paraphraser
10MAPPING THE STOCK AND FLOW STRUCTURE OF SYSTEMS
Minimum value of the stock slope = (-) 50 units at time “t = 10” (which is the
lowest point as acquired from the graph of net flow).
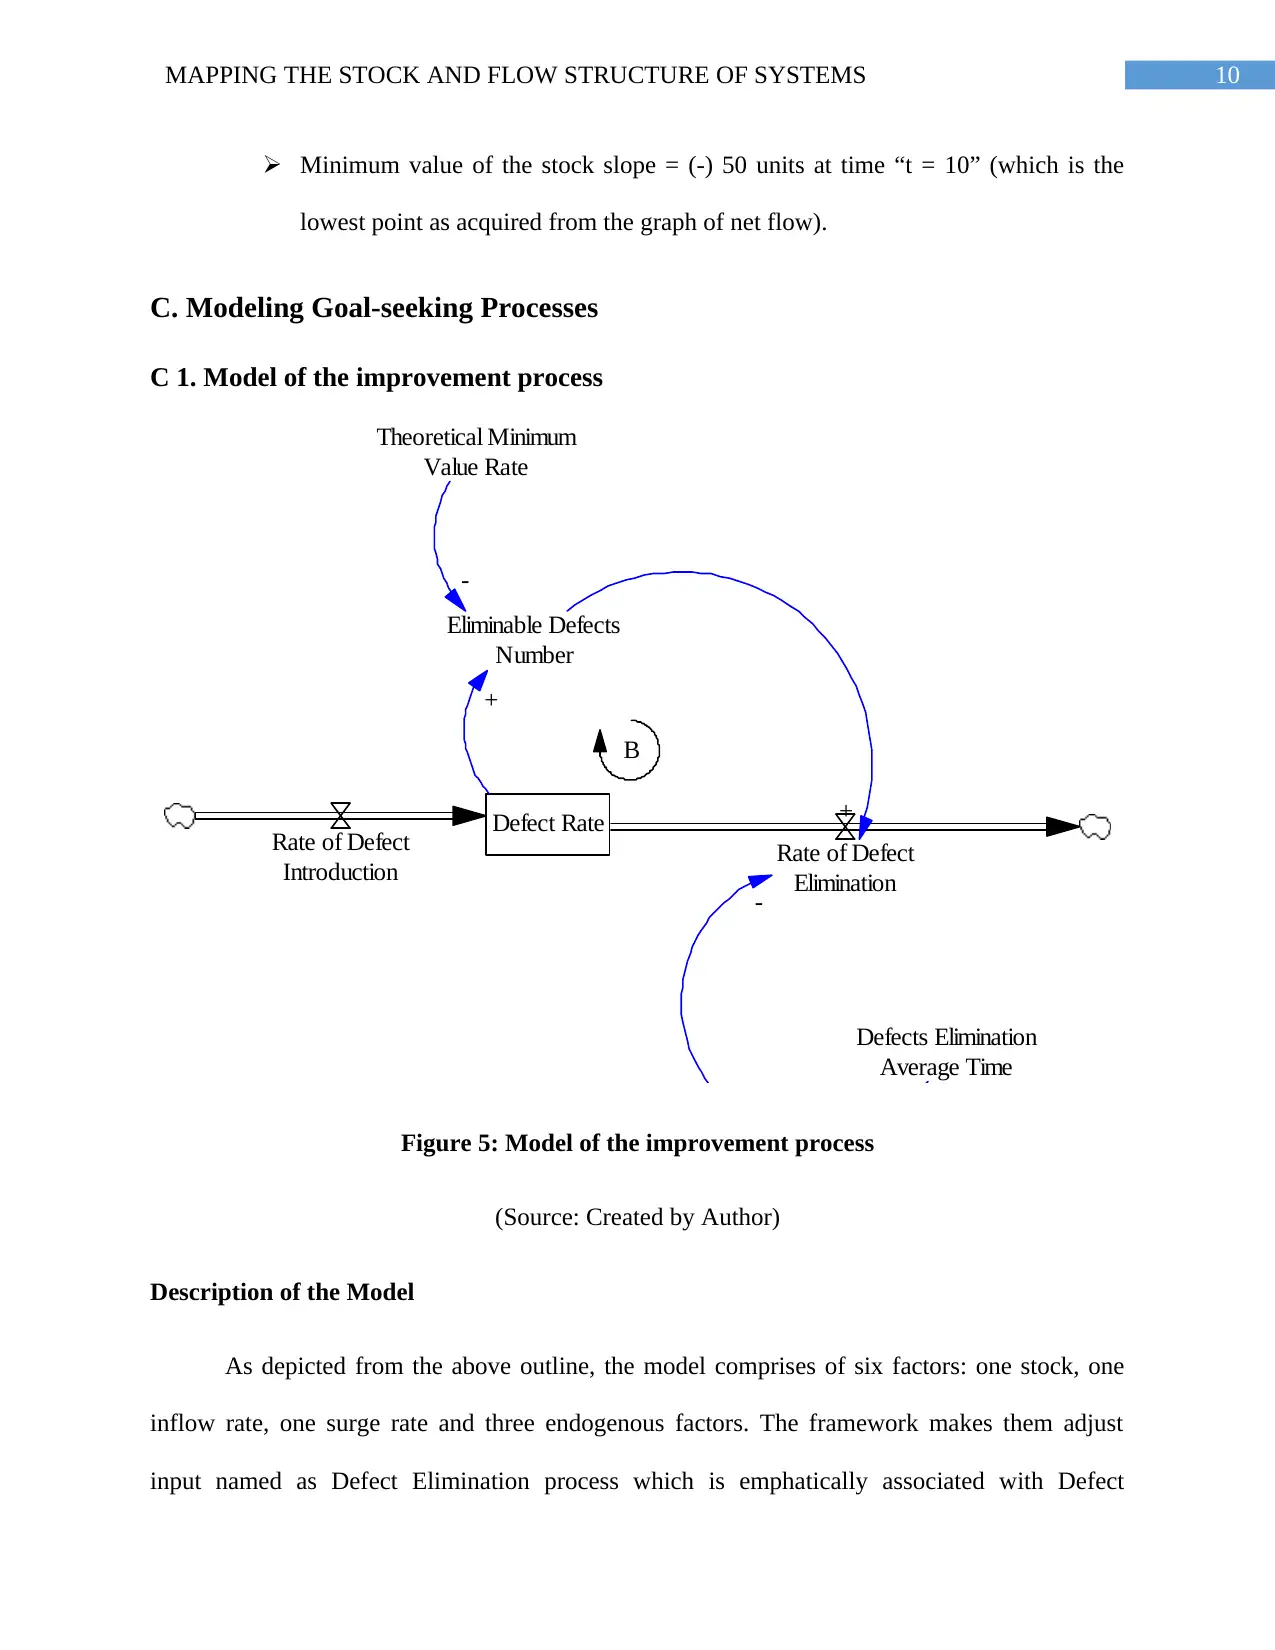
C. Modeling Goal-seeking Processes
C 1. Model of the improvement process
Defect Rate
Rate of Defect
Elimination
Rate of Defect
Introduction
Defects Elimination
Average Time
-
B
Eliminable Defects
Number
+
Theoretical Minimum
Value Rate
-
+
Figure 5: Model of the improvement process
(Source: Created by Author)
Description of the Model
As depicted from the above outline, the model comprises of six factors: one stock, one
inflow rate, one surge rate and three endogenous factors. The framework makes them adjust
input named as Defect Elimination process which is emphatically associated with Defect
Minimum value of the stock slope = (-) 50 units at time “t = 10” (which is the
lowest point as acquired from the graph of net flow).
C. Modeling Goal-seeking Processes
C 1. Model of the improvement process
Defect Rate
Rate of Defect
Elimination
Rate of Defect
Introduction
Defects Elimination
Average Time
-
B
Eliminable Defects
Number
+
Theoretical Minimum
Value Rate
-
+
Figure 5: Model of the improvement process
(Source: Created by Author)
Description of the Model
As depicted from the above outline, the model comprises of six factors: one stock, one
inflow rate, one surge rate and three endogenous factors. The framework makes them adjust
input named as Defect Elimination process which is emphatically associated with Defect
11MAPPING THE STOCK AND FLOW STRUCTURE OF SYSTEMS
Elimination Rate. Then again, the Defects Elimination Rate is adversely corresponded with
Average Time for Defects Elimination. The normal time absconds disposal, the imperfection
presentation rate, and the hypothetical least deformities rate are thought to be consistent.
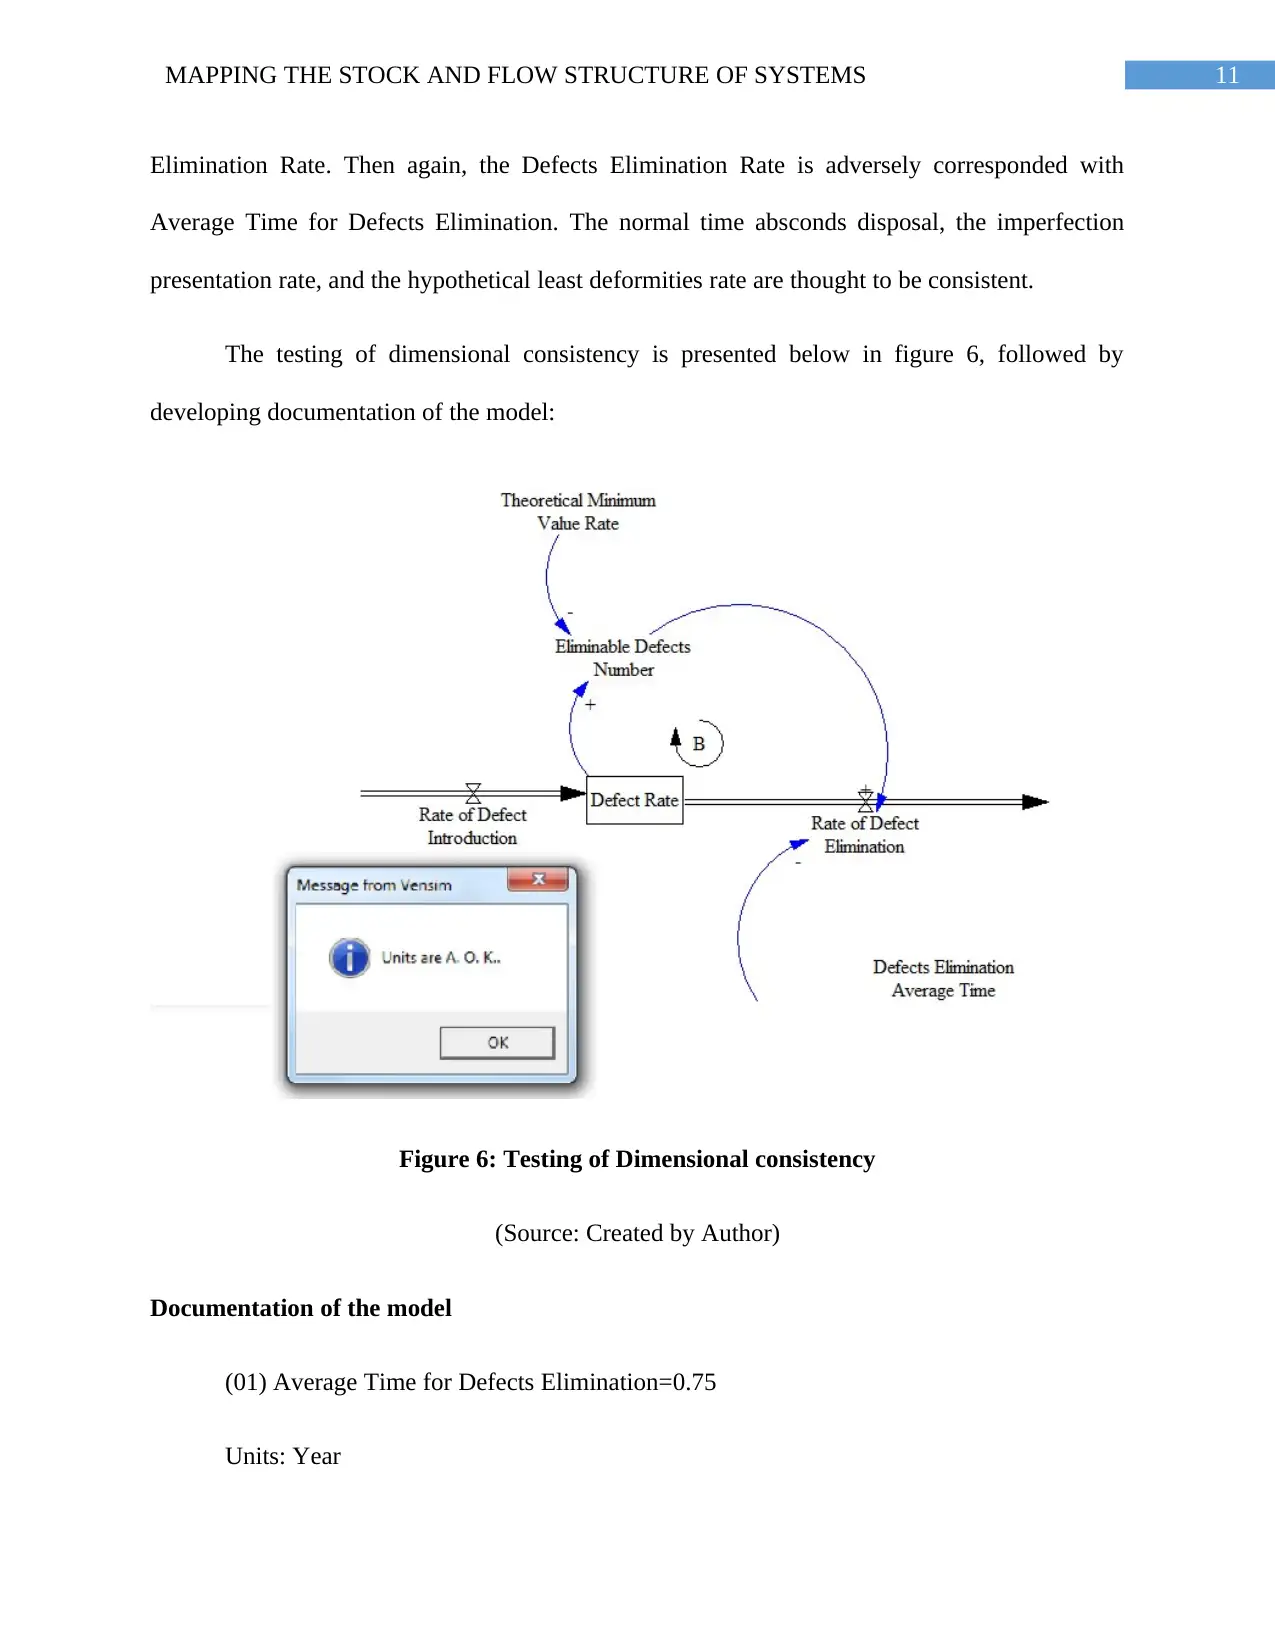
The testing of dimensional consistency is presented below in figure 6, followed by
developing documentation of the model:
Figure 6: Testing of Dimensional consistency
(Source: Created by Author)
Documentation of the model
(01) Average Time for Defects Elimination=0.75
Units: Year
Elimination Rate. Then again, the Defects Elimination Rate is adversely corresponded with
Average Time for Defects Elimination. The normal time absconds disposal, the imperfection
presentation rate, and the hypothetical least deformities rate are thought to be consistent.
The testing of dimensional consistency is presented below in figure 6, followed by
developing documentation of the model:
Figure 6: Testing of Dimensional consistency
(Source: Created by Author)
Documentation of the model
(01) Average Time for Defects Elimination=0.75
Units: Year
⊘ This is a preview!⊘
Do you want full access?
Subscribe today to unlock all pages.
Trusted by 1+ million students worldwide
1 out of 23

Your All-in-One AI-Powered Toolkit for Academic Success.
+13062052269
info@desklib.com
Available 24*7 on WhatsApp / Email
![[object Object]](/_next/static/media/star-bottom.7253800d.svg)
Unlock your academic potential
Copyright © 2020–2025 A2Z Services. All Rights Reserved. Developed and managed by ZUCOL.