AVS 350 Flight Navigation Assignment: Chart Projections Methods
VerifiedAdded on 2023/05/30
|13
|3015
|233
Report
AI Summary
This report provides a detailed overview of flight navigation, focusing on the properties of maps and charts essential for aviation purposes, including conformality, constant scale, and straight-line representation. It discusses the requirements for aviation charts, emphasizing their role in determining safe altitudes, positions, and routes. The report delves into the Lambert Projection with Two Standard Parallels, covering its historical background, construction method, and application areas such as aeronautical charts and coordinate systems. It also presents an example of an IFR en-route chart and concludes with a discussion of the Robinson Projection, including its historical background and characteristics. This document aims to give the student a solid understanding of the different chart projections used in aviation. Desklib is a platform where students can find more solved assignments and study tools.
Running head: AVS 350 – FLIGHT NAVIGATION ASSIGNMENT 1
AVS 350 – Flight Navigation Assignment
Name of Student
Institutional Affiliation
AVS 350 – Flight Navigation Assignment
Name of Student
Institutional Affiliation
Paraphrase This Document
Need a fresh take? Get an instant paraphrase of this document with our AI Paraphraser
AVS 350 – FLIGHT NAVIGATION ASSIGNMENT 2
1. A summary of:
a) Important Properties of Maps and Charts
There are various properties regarding the charts as well as the maps as far as the aviation is
concerned. The discussions on the properties of the charts as well as maps mainly illustrated as
per the appraisal below
Conformality
First and foremost, this property is not only important but also essential as far as the navigation
charts and maps are concerned. Essentially, it is important to ensure that the projection has a
conformal aspect in line with the charts. In doing so, it is essential to ensure that the scale set a
point has a makeable azimuth independent element. However, it is important to note that the
element does not indicate that the scale of the two given points tend to be equal at different
latitudes. The conformality in the chart ascertain in the event that the outlined area conforms in
the shape as well as the features portrayed in the system (Schulze, Malek, & Verburg, 2018).
However, it is essential to demarcate the condition only applies to the small area. For the large
land masses it critical and vital to ensure that necessary reflections in line with any distortions
regarding the projection are taken into account. Subsequently, all the parallel lines as well as
meridians on the earth tend to intersect at the right angles. Furthermore, the latitudes and the
longitude lines often conform to the projections and thus should exhibit makeable same
perpendicularity. The characteristics play a vital role in facilitating the plotting of the overall
points by decisive geographic coordinates. This characteristic facilitates the plotting of points by
geographic coordinates (Schulze, Malek, & Verburg, 2018).
Constant Scale
AVS 350 – FLIGHT NAVIGATION ASSIGNMENT 3
The property relating the constant scale has drawn much attention grounded on its highly
desirable application in the process. However, the attainment of constant scale is practically
impossible as this will require that all the applied points in the system have got same magnitude
as well as depicted in same direction in the overall chart.
Straight Line
Both the great circles as well as the rhumb line are essential curves which must navigators prefer
to represent on the given maps at any instance. The representation of such norms often depicted
as straight lines. Conversely, the analysis indicates that only projection which results in giving
the rhumb line as makeable straight lines is the parametric Mercator. On the other hand, the only
projection in line with the great circles which can facilitate illustrate element as straight lines is
the overall gnomonic projection. Notably, is worth noting that the aspect does not provide
conformal projection and thereby cannot be utilized in gathering distance and direction. Thus,
the analogy depicts that no single conformal chart can give all the related great circles as
parametric straight lines (Schulze, Malek, & Verburg, 2018).
b) Requirements for maps and charts used for aviation purposes
Preferably, aeronautical charts often defined as the maps which are designed to assist in the
overall process of the aircraft navigation. In essence, they play fundamental roles as those of the
roadmap and the watercraft. The application of the charts alongside other related tools helps in
determining the safe altitude, position as well as best destination routes. The charts assist the
navigators in process of steering the airplanes along the way. Furthermore, the charts play an
essential by assisting the pilots to land promptly in situations in which the emergencies emerges
in the process (Schulze, Malek, & Verburg, 2018).
⊘ This is a preview!⊘
Do you want full access?
Subscribe today to unlock all pages.
Trusted by 1+ million students worldwide
AVS 350 – FLIGHT NAVIGATION ASSIGNMENT 4
Subsequently, the role of aiding the overall processes of estimating the radio frequencies as well
as the airspace boundaries cannot be underestimated as far as the overall process is concerned.
There are different charts as far as the aviation concept is concept. The utilization of the charts
often varies from the land masses and long-distance ranging from the earth as well as trans-
oceanic travel. Specified charts are often used for decisive phases of aviation and these tend to
vary from the particular airport facility. The extensions mainly demarcated up to the overall
instrument routes and overview covering the larger continent as a whole. The charts used in the
process of visualization mainly illustrated and depicted on the grounds of the proportional scale
and size. This is taken in preference to the area coverage indicated in the map. Essentially, there
is reduction in the amount often represented in the map and this is common whenever a large
area is represented in the map.
True Azimuth
Essentially, it is preferred to have the projection in extremely desirable manner and this should
indicate the azimuths as well as directions in line with the true charts. True azimuth is a
fundamental element which assists the navigator in determining the heading flown from the
chart. Conversely, most analysis established that there is no great circle which represents the
direction in line with the straight lines as far as the evaluation of all points is concerned (Schulze,
Malek, & Verburg, 2018).
2. Lambert Projection with Two Standard Parallels
It is defined as the conic map projection often used in the aeronautical charts, regional as well as
national mapping of the systems. Preferably, it is also applied in the State Plane Coordinate and
overall System.
a. Historical Background
Paraphrase This Document
Need a fresh take? Get an instant paraphrase of this document with our AI Paraphraser
AVS 350 – FLIGHT NAVIGATION ASSIGNMENT 5
The system regarding the Lambert conformal conic is a system which was developed and
designed by the Johann Heinrich Lambert. The designing and overall development of the system
mainly conducted in 18th century. The individual who conducted and performed the related
computations and analysis in line with the process mainly demarcated as Swiss mathematician,
philosopher, and astronomer as well as physicist (Schulze, Malek, & Verburg, 2018).
b. Method of Construction
The method of construction of the Lambert Projection with Two Standard Parallels mainly
grounded on the transformation techniques and analogy approach. The transformation of the
spherical datum coordinates into the overall Lambert conformal conic projection mainly
grounded on the essential formulas. In the formula, various aspects and elementary symbols
often applied as the key denotations in the process. The key and critical ones often applied
comprises of
λ -which represent the longitude
λ0-denoting the reference longitude
φ representing the latitude
φ0 marking reference latitude
φ1 as well as φ2 demarcating the standard parallels
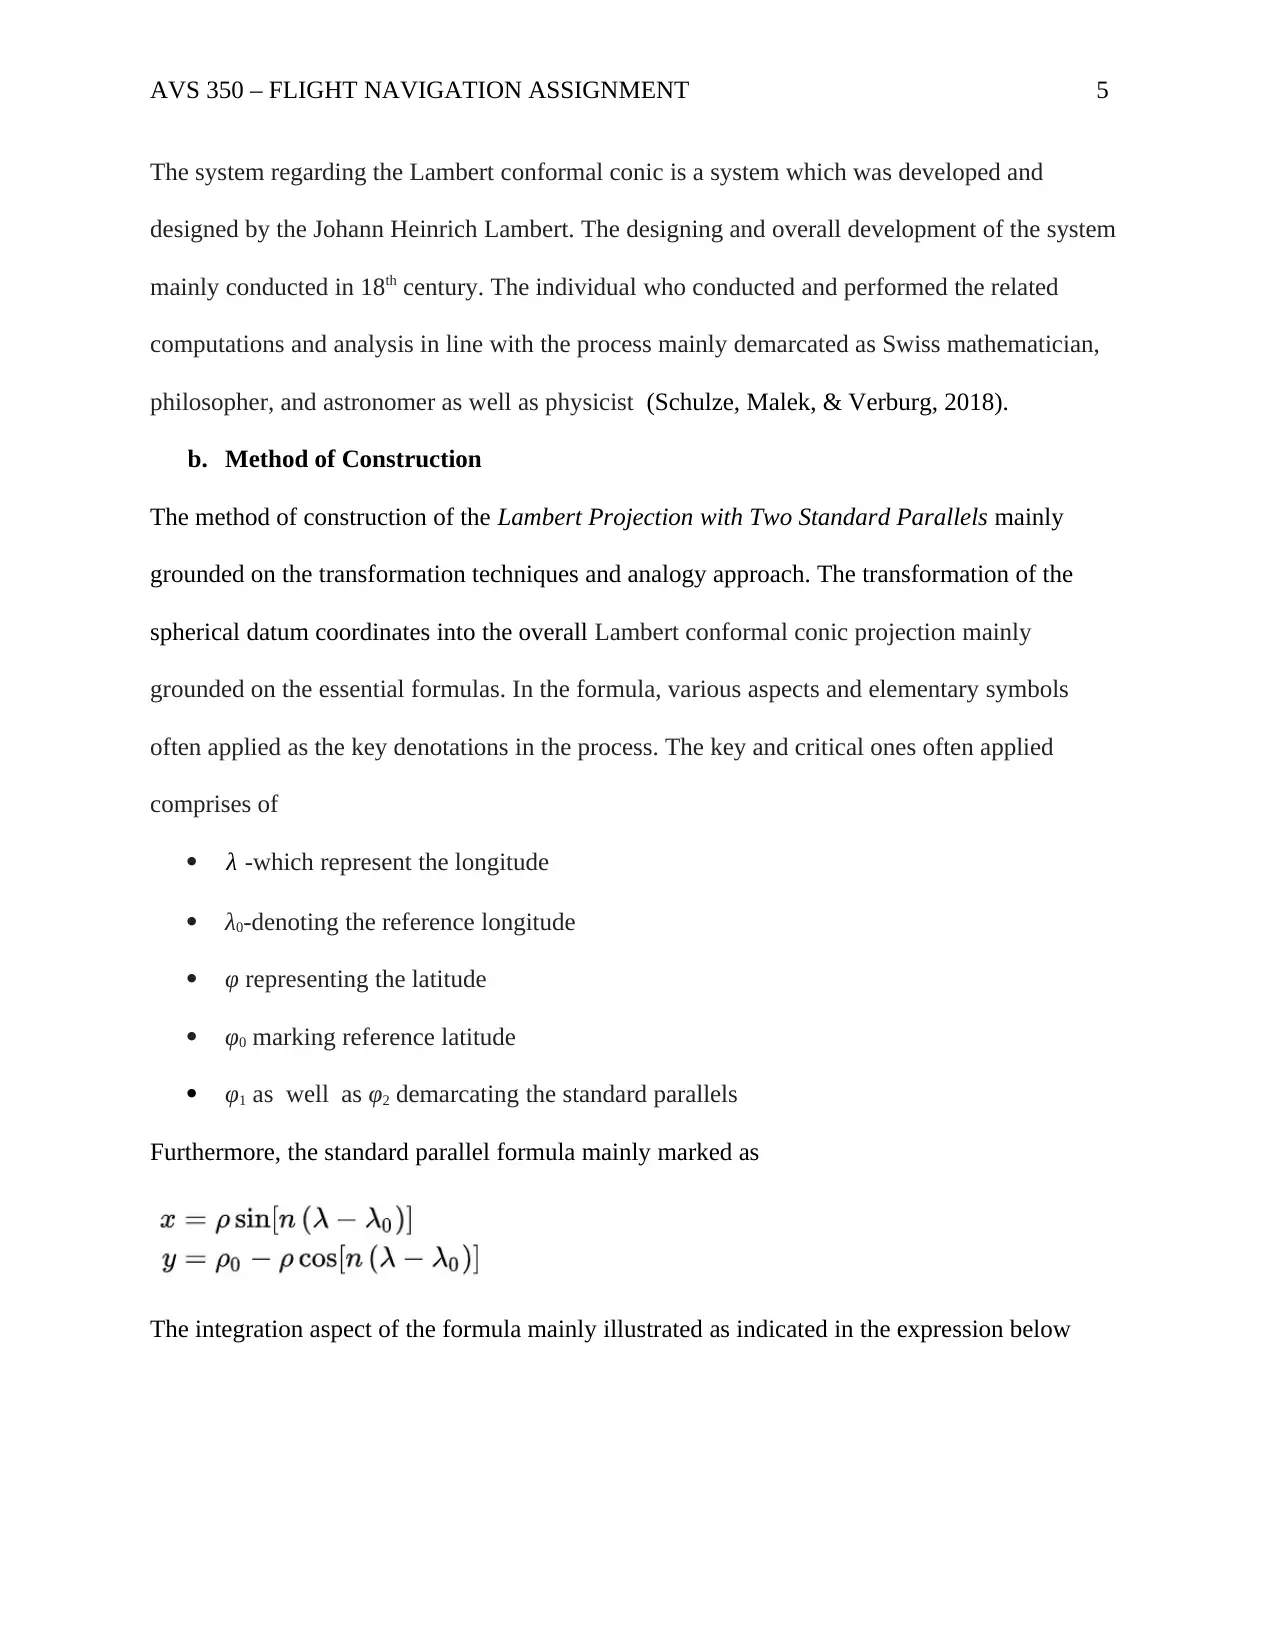
Furthermore, the standard parallel formula mainly marked as
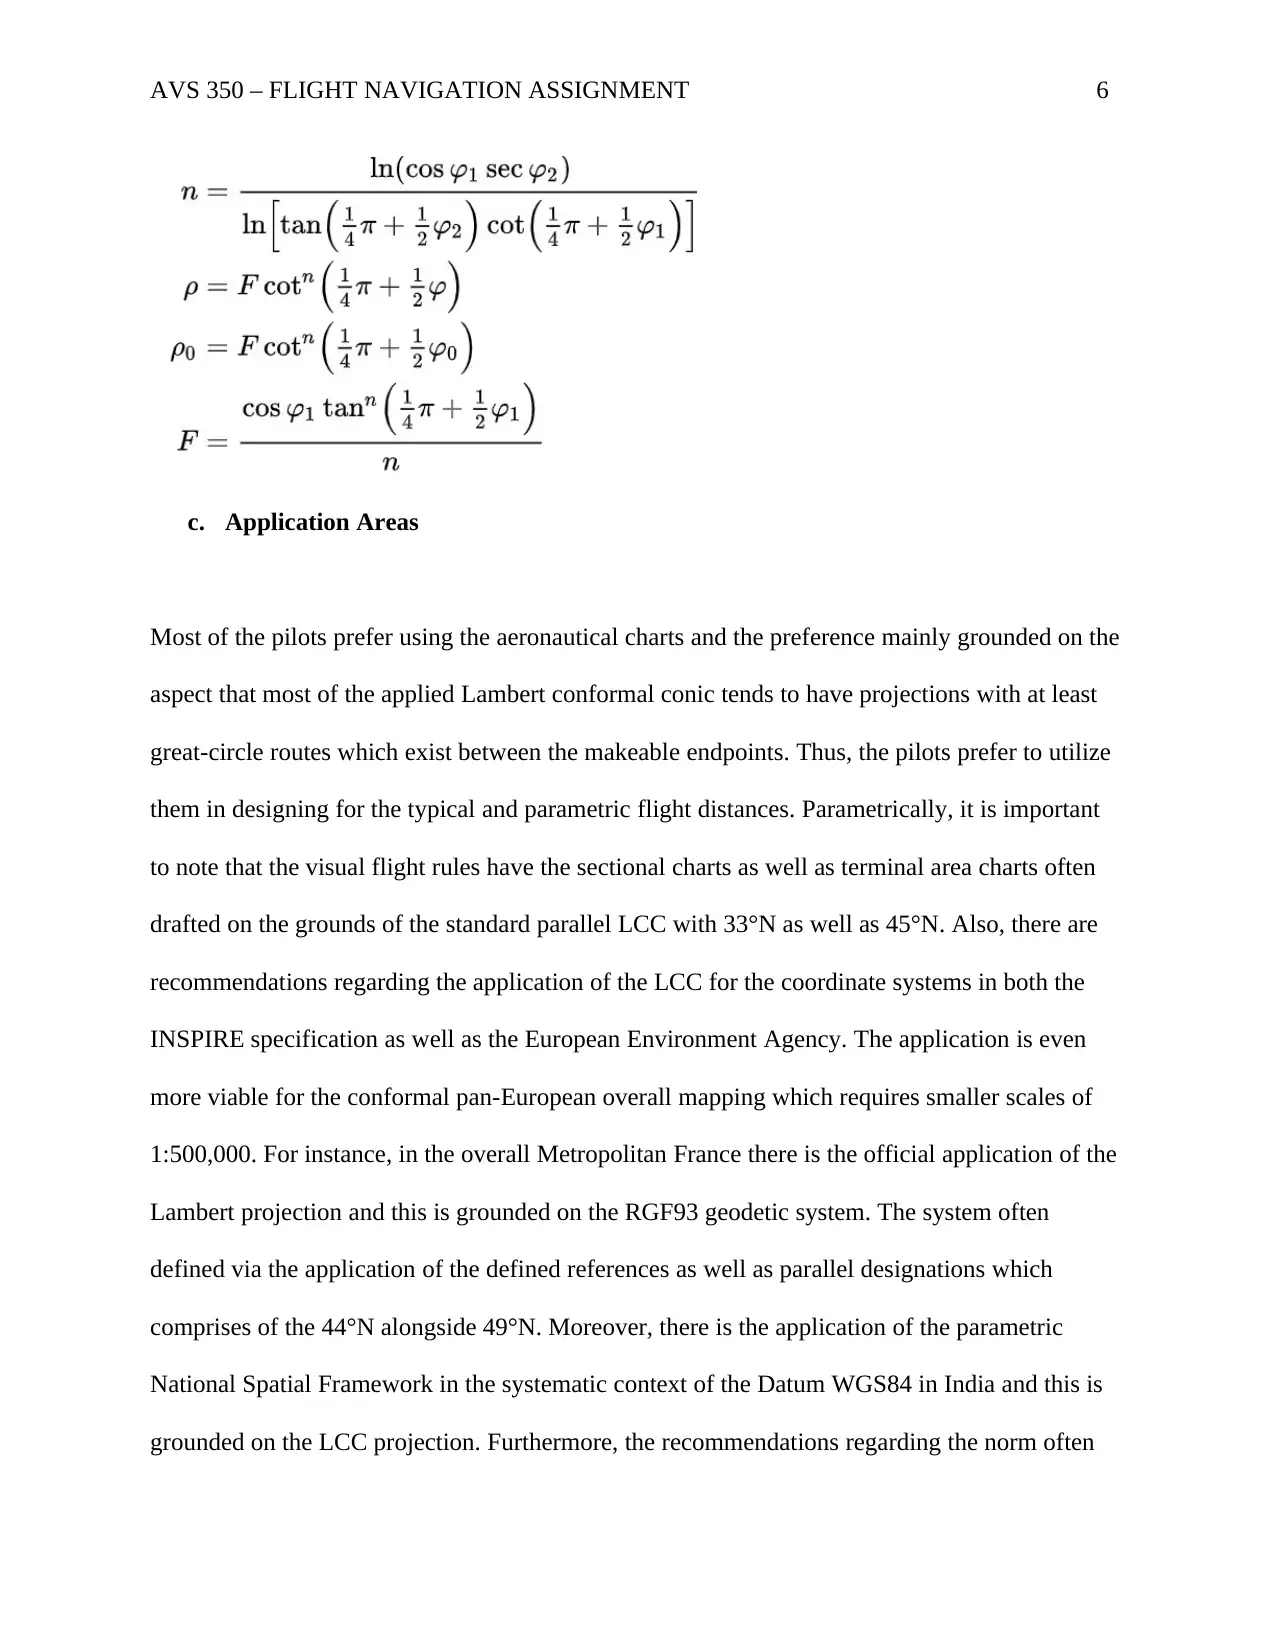
The integration aspect of the formula mainly illustrated as indicated in the expression below
The system regarding the Lambert conformal conic is a system which was developed and
designed by the Johann Heinrich Lambert. The designing and overall development of the system
mainly conducted in 18th century. The individual who conducted and performed the related
computations and analysis in line with the process mainly demarcated as Swiss mathematician,
philosopher, and astronomer as well as physicist (Schulze, Malek, & Verburg, 2018).
b. Method of Construction
The method of construction of the Lambert Projection with Two Standard Parallels mainly
grounded on the transformation techniques and analogy approach. The transformation of the
spherical datum coordinates into the overall Lambert conformal conic projection mainly
grounded on the essential formulas. In the formula, various aspects and elementary symbols
often applied as the key denotations in the process. The key and critical ones often applied
comprises of
λ -which represent the longitude
λ0-denoting the reference longitude
φ representing the latitude
φ0 marking reference latitude
φ1 as well as φ2 demarcating the standard parallels
Furthermore, the standard parallel formula mainly marked as
The integration aspect of the formula mainly illustrated as indicated in the expression below
AVS 350 – FLIGHT NAVIGATION ASSIGNMENT 6
c. Application Areas
Most of the pilots prefer using the aeronautical charts and the preference mainly grounded on the
aspect that most of the applied Lambert conformal conic tends to have projections with at least
great-circle routes which exist between the makeable endpoints. Thus, the pilots prefer to utilize
them in designing for the typical and parametric flight distances. Parametrically, it is important
to note that the visual flight rules have the sectional charts as well as terminal area charts often
drafted on the grounds of the standard parallel LCC with 33°N as well as 45°N. Also, there are
recommendations regarding the application of the LCC for the coordinate systems in both the
INSPIRE specification as well as the European Environment Agency. The application is even
more viable for the conformal pan-European overall mapping which requires smaller scales of
1:500,000. For instance, in the overall Metropolitan France there is the official application of the
Lambert projection and this is grounded on the RGF93 geodetic system. The system often
defined via the application of the defined references as well as parallel designations which
comprises of the 44°N alongside 49°N. Moreover, there is the application of the parametric
National Spatial Framework in the systematic context of the Datum WGS84 in India and this is
grounded on the LCC projection. Furthermore, the recommendations regarding the norm often
⊘ This is a preview!⊘
Do you want full access?
Subscribe today to unlock all pages.
Trusted by 1+ million students worldwide
AVS 350 – FLIGHT NAVIGATION ASSIGNMENT 7
based on the NNRMS standard. Different analysis as well as studies has indicated that different
states have got designated reference set parameters and this is grounded on the standards sets.
For example, the United States of America applies the National Geodetic Survey's also denoted
as the “State Plane Coordinate System of 1983” (Schulze, Malek, & Verburg, 2018).
d. One example chart ( IFR en-route chart)
The goal of IFR on the way flight is to explore inside the sidelong furthest reaches of an assigned
aviation route at a height predictable with the ATC freedom. Your capacity to fl y instruments
securely and ably in the framework is incredibly upgraded by understanding the huge swath of
information accessible to the pilot on instrument diagrams. The NACG keeps up and creates the
graphs for the United States government. In transit high-elevation graphs give aeronautical data
to on the way instrument route (IFR) at or over 18,000 feet MSL. Data incorporates the depiction
of Jet and RNAV courses, distinguishing proof and frequencies of radio guides, chose air
terminals, separations, time zones, uncommon utilize airspace and related data. Built up Jet
courses from 18,000 feet MSL to FL 450 use NAVAIDs not more than 260 NM separated. The
outlines are changed every 56 days. To viably withdraw from one airplane terminal and explore
on the way under instrument conditions a pilot needs the suitable IFR in transit low-height
chart(s).
The IFR low height on the way outline is what could be compared to the Sectional graph.
Whenever collapsed, the front of the NACG on the way chart shows a file guide of the United
States demonstrating the inclusion territories. Urban areas close blocked airspace appear dark
and their related zone outline is recorded in the container in the lower left-hand corner of the
guide inclusion box. Likewise noted is a clarification of the off-course check leeway height
(OROCA). The auspicious date of the diagram is imprinted on the opposite side of the collapsed
Paraphrase This Document
Need a fresh take? Get an instant paraphrase of this document with our AI Paraphraser
AVS 350 – FLIGHT NAVIGATION ASSIGNMENT 8
outline. Data concerning MTRs are likewise included on the diagram cover. The on the way
descriptions are updated every 56 days. At the point when the NACG on the way graph is
unfurled, the legend is shown and gives data concerning airplane terminals, NAVAIDs,
interchanges, air activity administrations, and airspace. Airplane terminal data is provided in the
legend, and the images utilized for the air terminal name, rise, and runway length are like the
sectional outline introduction (Schulze, Malek, & Verburg, 2018). Related city names appear
for open airplane terminals as it were. FAA identifiers appear for all airplane terminals. ICAO
identifiers are additionally looked for airplane terminals outside of the coterminous United
States. Instrument methodologies can be found at airplane terminals with blue or green images,
while the dark-colored air terminal image indicates air terminals that don't have instrument
approaches. Stars are utilized to demonstrate the low maintenance nature of pinnacle tasks, ATIS
frequencies, low maintenance or on-demand lighting offices, and low maintenance airspace
characterizations.
3. A short discussion of the Robinson Projection
a. Historical background
The Robinson projection is a guide projection of a world guide which demonstrates the whole
world without a moment's delay. It was explicitly made trying to locate a decent trade-off to the
issue of promptly expressing the entire globe as a level picture. Arthur H. Robinson concocted
the Robinson projection in 1963 because of intrigue from the Rand McNally organization, which
has utilized the forecast by and large reason world maps since that time. Robinson distributed
subtle elements of the projection's development in 1974. The National Geographic Society
(NGS) started utilizing the Robinson projection for broadly useful world maps in 1988,
supplanting the Van der Grinten projection. In 1998 NGS deserted the Robinson projection for
AVS 350 – FLIGHT NAVIGATION ASSIGNMENT 9
that utilization for the Winkel tripel projection, as the last "diminishes the bending of land
masses as they close to the posts (Schulze, Malek, & Verburg, 2018).
b. Method of Construction
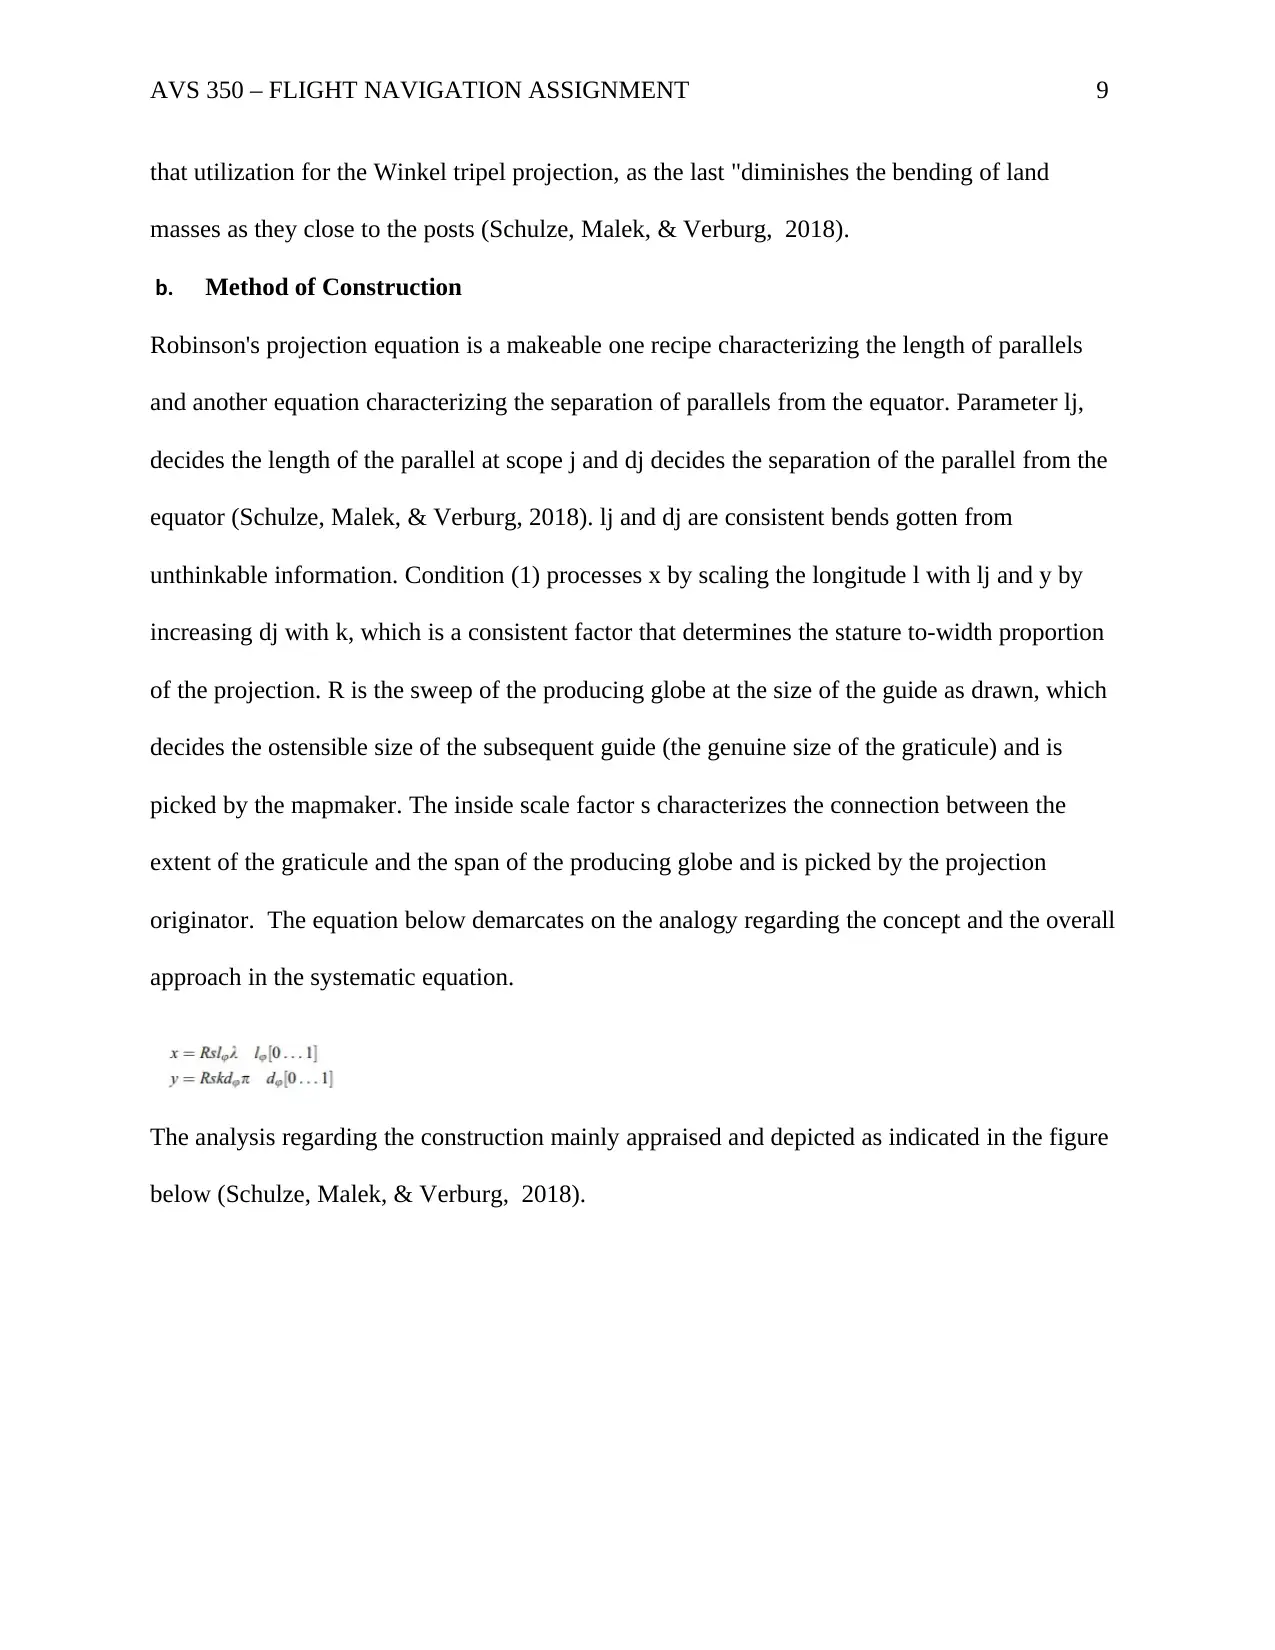
Robinson's projection equation is a makeable one recipe characterizing the length of parallels
and another equation characterizing the separation of parallels from the equator. Parameter lj,
decides the length of the parallel at scope j and dj decides the separation of the parallel from the
equator (Schulze, Malek, & Verburg, 2018). lj and dj are consistent bends gotten from
unthinkable information. Condition (1) processes x by scaling the longitude l with lj and y by
increasing dj with k, which is a consistent factor that determines the stature to-width proportion
of the projection. R is the sweep of the producing globe at the size of the guide as drawn, which
decides the ostensible size of the subsequent guide (the genuine size of the graticule) and is
picked by the mapmaker. The inside scale factor s characterizes the connection between the
extent of the graticule and the span of the producing globe and is picked by the projection
originator. The equation below demarcates on the analogy regarding the concept and the overall
approach in the systematic equation.
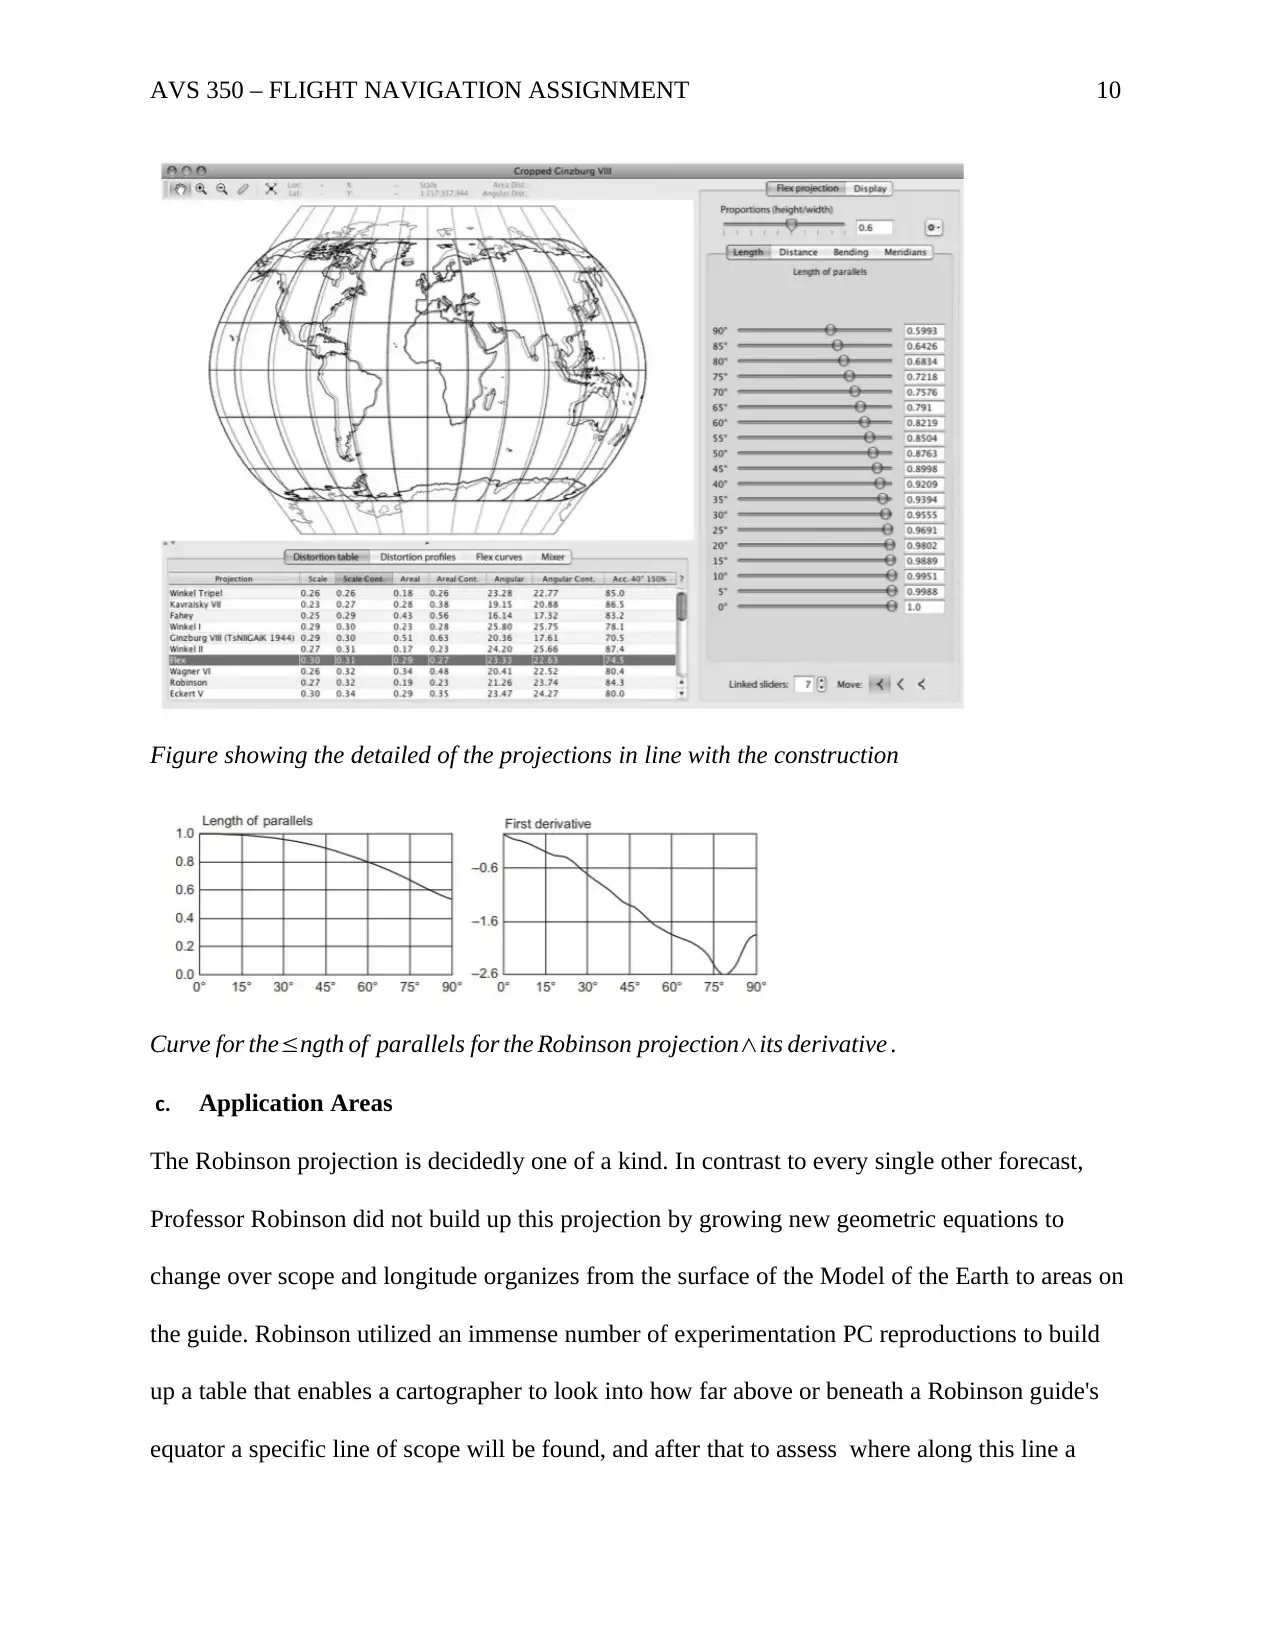
The analysis regarding the construction mainly appraised and depicted as indicated in the figure
below (Schulze, Malek, & Verburg, 2018).
that utilization for the Winkel tripel projection, as the last "diminishes the bending of land
masses as they close to the posts (Schulze, Malek, & Verburg, 2018).
b. Method of Construction
Robinson's projection equation is a makeable one recipe characterizing the length of parallels
and another equation characterizing the separation of parallels from the equator. Parameter lj,
decides the length of the parallel at scope j and dj decides the separation of the parallel from the
equator (Schulze, Malek, & Verburg, 2018). lj and dj are consistent bends gotten from
unthinkable information. Condition (1) processes x by scaling the longitude l with lj and y by
increasing dj with k, which is a consistent factor that determines the stature to-width proportion
of the projection. R is the sweep of the producing globe at the size of the guide as drawn, which
decides the ostensible size of the subsequent guide (the genuine size of the graticule) and is
picked by the mapmaker. The inside scale factor s characterizes the connection between the
extent of the graticule and the span of the producing globe and is picked by the projection
originator. The equation below demarcates on the analogy regarding the concept and the overall
approach in the systematic equation.
The analysis regarding the construction mainly appraised and depicted as indicated in the figure
below (Schulze, Malek, & Verburg, 2018).
⊘ This is a preview!⊘
Do you want full access?
Subscribe today to unlock all pages.
Trusted by 1+ million students worldwide
AVS 350 – FLIGHT NAVIGATION ASSIGNMENT 10
Figure showing the detailed of the projections in line with the construction
Curve for the≤ngth of parallels for the Robinson projection∧its derivative .
c. Application Areas
The Robinson projection is decidedly one of a kind. In contrast to every single other forecast,
Professor Robinson did not build up this projection by growing new geometric equations to
change over scope and longitude organizes from the surface of the Model of the Earth to areas on
the guide. Robinson utilized an immense number of experimentation PC reproductions to build
up a table that enables a cartographer to look into how far above or beneath a Robinson guide's
equator a specific line of scope will be found, and after that to assess where along this line a
Paraphrase This Document
Need a fresh take? Get an instant paraphrase of this document with our AI Paraphraser
AVS 350 – FLIGHT NAVIGATION ASSIGNMENT 11
precise longitude will fall. Right up 'til today, no other projection utilizes this way to deal with
manufacture a guide.
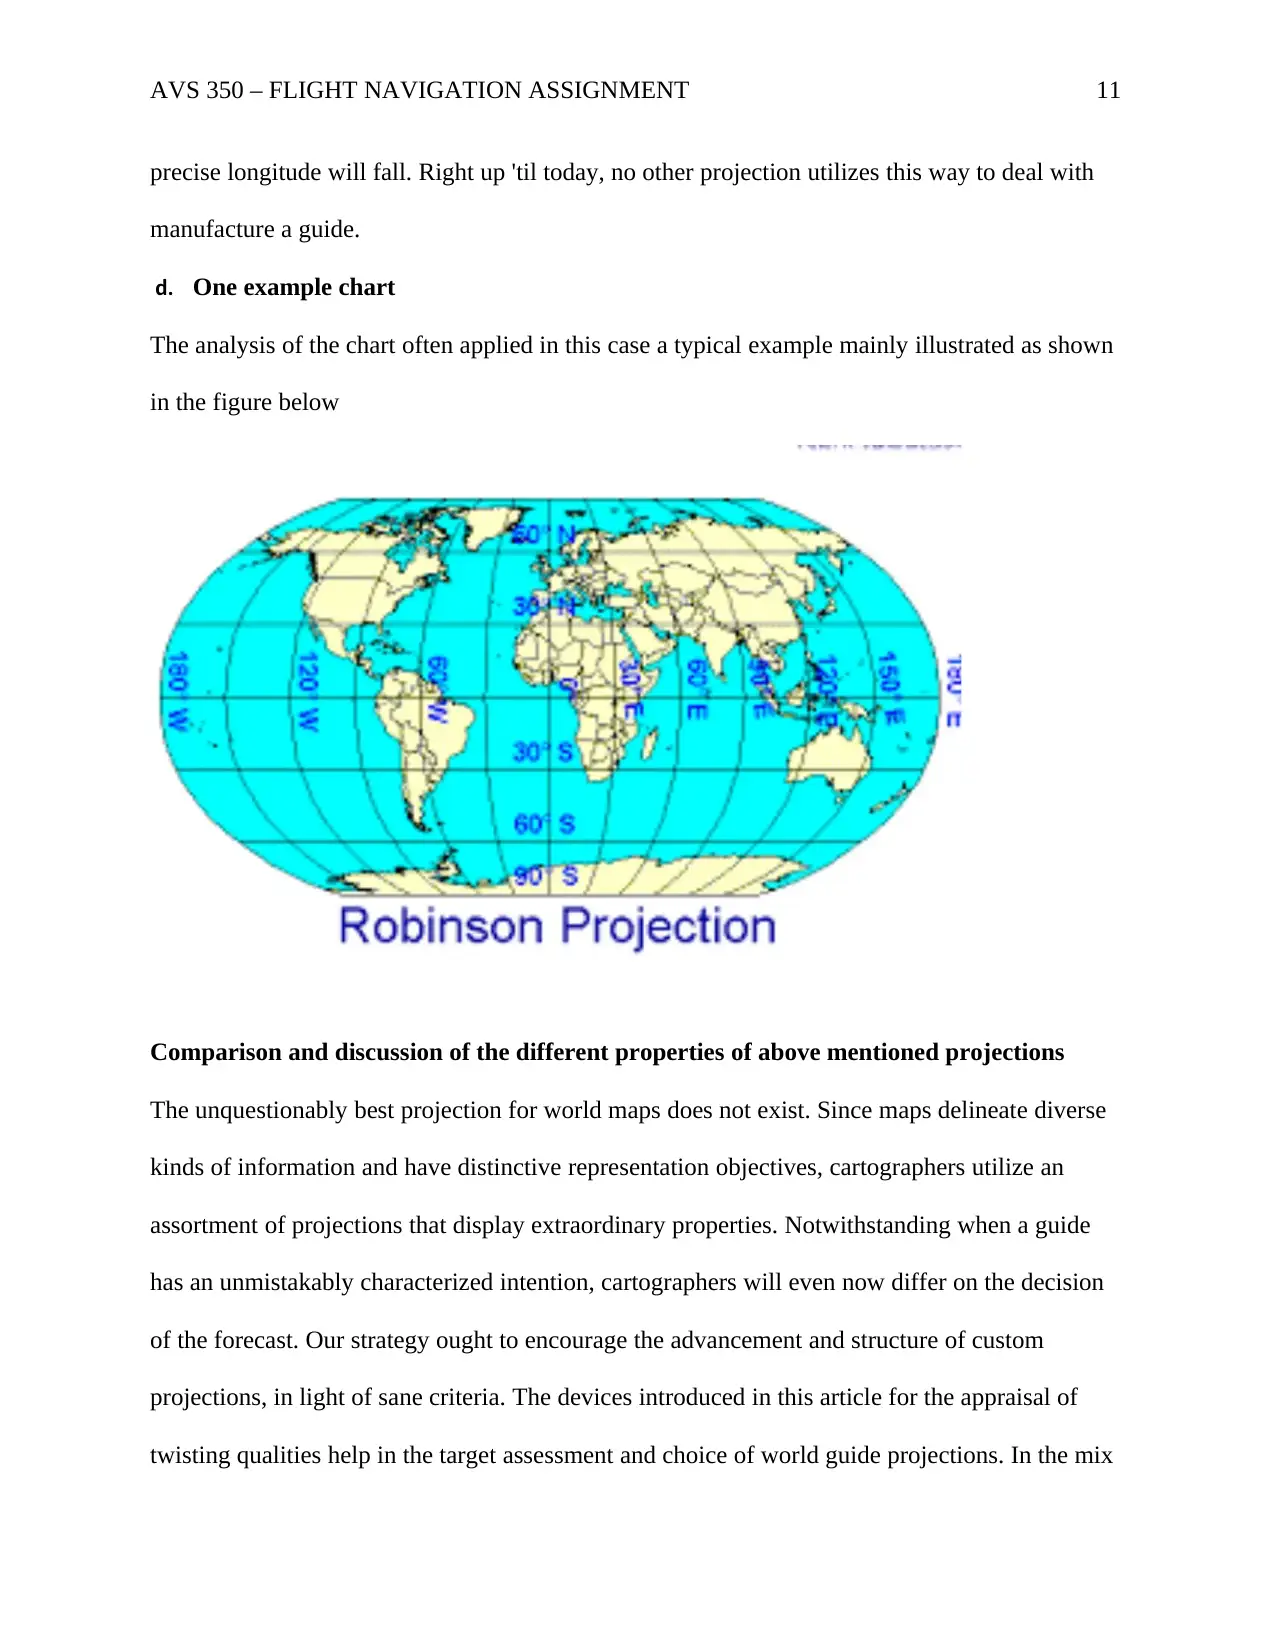
d. One example chart
The analysis of the chart often applied in this case a typical example mainly illustrated as shown
in the figure below
Comparison and discussion of the different properties of above mentioned projections
The unquestionably best projection for world maps does not exist. Since maps delineate diverse
kinds of information and have distinctive representation objectives, cartographers utilize an
assortment of projections that display extraordinary properties. Notwithstanding when a guide
has an unmistakably characterized intention, cartographers will even now differ on the decision
of the forecast. Our strategy ought to encourage the advancement and structure of custom
projections, in light of sane criteria. The devices introduced in this article for the appraisal of
twisting qualities help in the target assessment and choice of world guide projections. In the mix
precise longitude will fall. Right up 'til today, no other projection utilizes this way to deal with
manufacture a guide.
d. One example chart
The analysis of the chart often applied in this case a typical example mainly illustrated as shown
in the figure below
Comparison and discussion of the different properties of above mentioned projections
The unquestionably best projection for world maps does not exist. Since maps delineate diverse
kinds of information and have distinctive representation objectives, cartographers utilize an
assortment of projections that display extraordinary properties. Notwithstanding when a guide
has an unmistakably characterized intention, cartographers will even now differ on the decision
of the forecast. Our strategy ought to encourage the advancement and structure of custom
projections, in light of sane criteria. The devices introduced in this article for the appraisal of
twisting qualities help in the target assessment and choice of world guide projections. In the mix
AVS 350 – FLIGHT NAVIGATION ASSIGNMENT 12
with Tissot's indicatrices as well as isolines of precise and areal twisting, a trade-off between the
graphical appearance of a graticule and its contortion attributes can be accomplished. The
apparatuses displayed in this article may even settle on cartographers reexamine their constant
selection of projections and possibly create enhanced new predictions. The Cropped Ginzburg
VIII projection is nevertheless one case of a large number of new projections that clients of Flex
Projector will ideally make later on. It additionally gives a few rules, and generous tips for the
making of new projections with the strategy displayed here and furthermore portray the structure
of two new projections (the Natural Earth and the A4 projections) that could motivate intrigued
perusers to make their projection (Wang, Ye, Zhong, Fang, & Zhang 2018, August).
⊘ This is a preview!⊘
Do you want full access?
Subscribe today to unlock all pages.
Trusted by 1+ million students worldwide
1 out of 13
Your All-in-One AI-Powered Toolkit for Academic Success.
+13062052269
info@desklib.com
Available 24*7 on WhatsApp / Email
![[object Object]](/_next/static/media/star-bottom.7253800d.svg)
Unlock your academic potential
Copyright © 2020–2025 A2Z Services. All Rights Reserved. Developed and managed by ZUCOL.