Facelift Ltd: Market Research Report for Home Furniture Expansion, UK
VerifiedAdded on 2020/01/07
|18
|4836
|278
Report
AI Summary
This report presents a comprehensive market research analysis conducted for Facelift Ltd, a UK-based office furniture retailer aiming to diversify into the home furniture market. The research employs both quantitative and qualitative methods, including customer surveys and secondary data analysis from the internet. The report outlines the research methodology, including the sampling frame, questionnaire design, and data analysis techniques. Key findings from the customer satisfaction survey indicate preferences for kitchen and bedroom furniture, with comfort and quality being major drivers in purchasing decisions. The analysis of sales data for cabinets and chairs provides insights into market trends. Based on these findings, the report provides recommendations for Facelift Ltd to enhance its product offerings, marketing strategies, and overall business decisions to successfully enter the home furniture market. The report also includes a detailed budget and timeline for the research project.

BUSINESS DECISION MAKING
Paraphrase This Document
Need a fresh take? Get an instant paraphrase of this document with our AI Paraphraser
INTRODUCTION
Background: The Facelift is a general merchant selling office furniture in the UK market.
They have 100 stores with 8000 employees. The company wants to diversify into the home
furniture market, because the economic downturn having affected their core furniture business.
Rationale: The present report helps to make market research for Facelift Ltd. It will be very
helpful to forecast some details about the new furniture and helps to determine changes in future
period. The new furniture would be suitable for families, woman, and man between ages 20-55.
Objectives: Our objective has to be SMART Specific, Measurable, Achievable, Realistic and
Timed. The present report mainly aims at market research analysis so as to start manufacturing new
furniture products and launching new furniture at the market place. This report includes both the
quantitative and qualitative research.
AC 1.1 Market research analysis
Market research: It is a method of gathering information about the target market. It helps to
collect both the primary as well as secondary data. Primary data has been collected by the
investigator itself while secondary data includes all the published information sources. It has been
collected with the help of the internet, for example, home furniture websites, competitor’s website
and from books.
Quantitative research: It helps to collect more valid and reliable numerical and statistical
business information, helps to estimate the future easily.
Qualitative research: It helps to determine customer needs and their preferences accurately.
By using this information, business will be able to clarify their future business prospects.
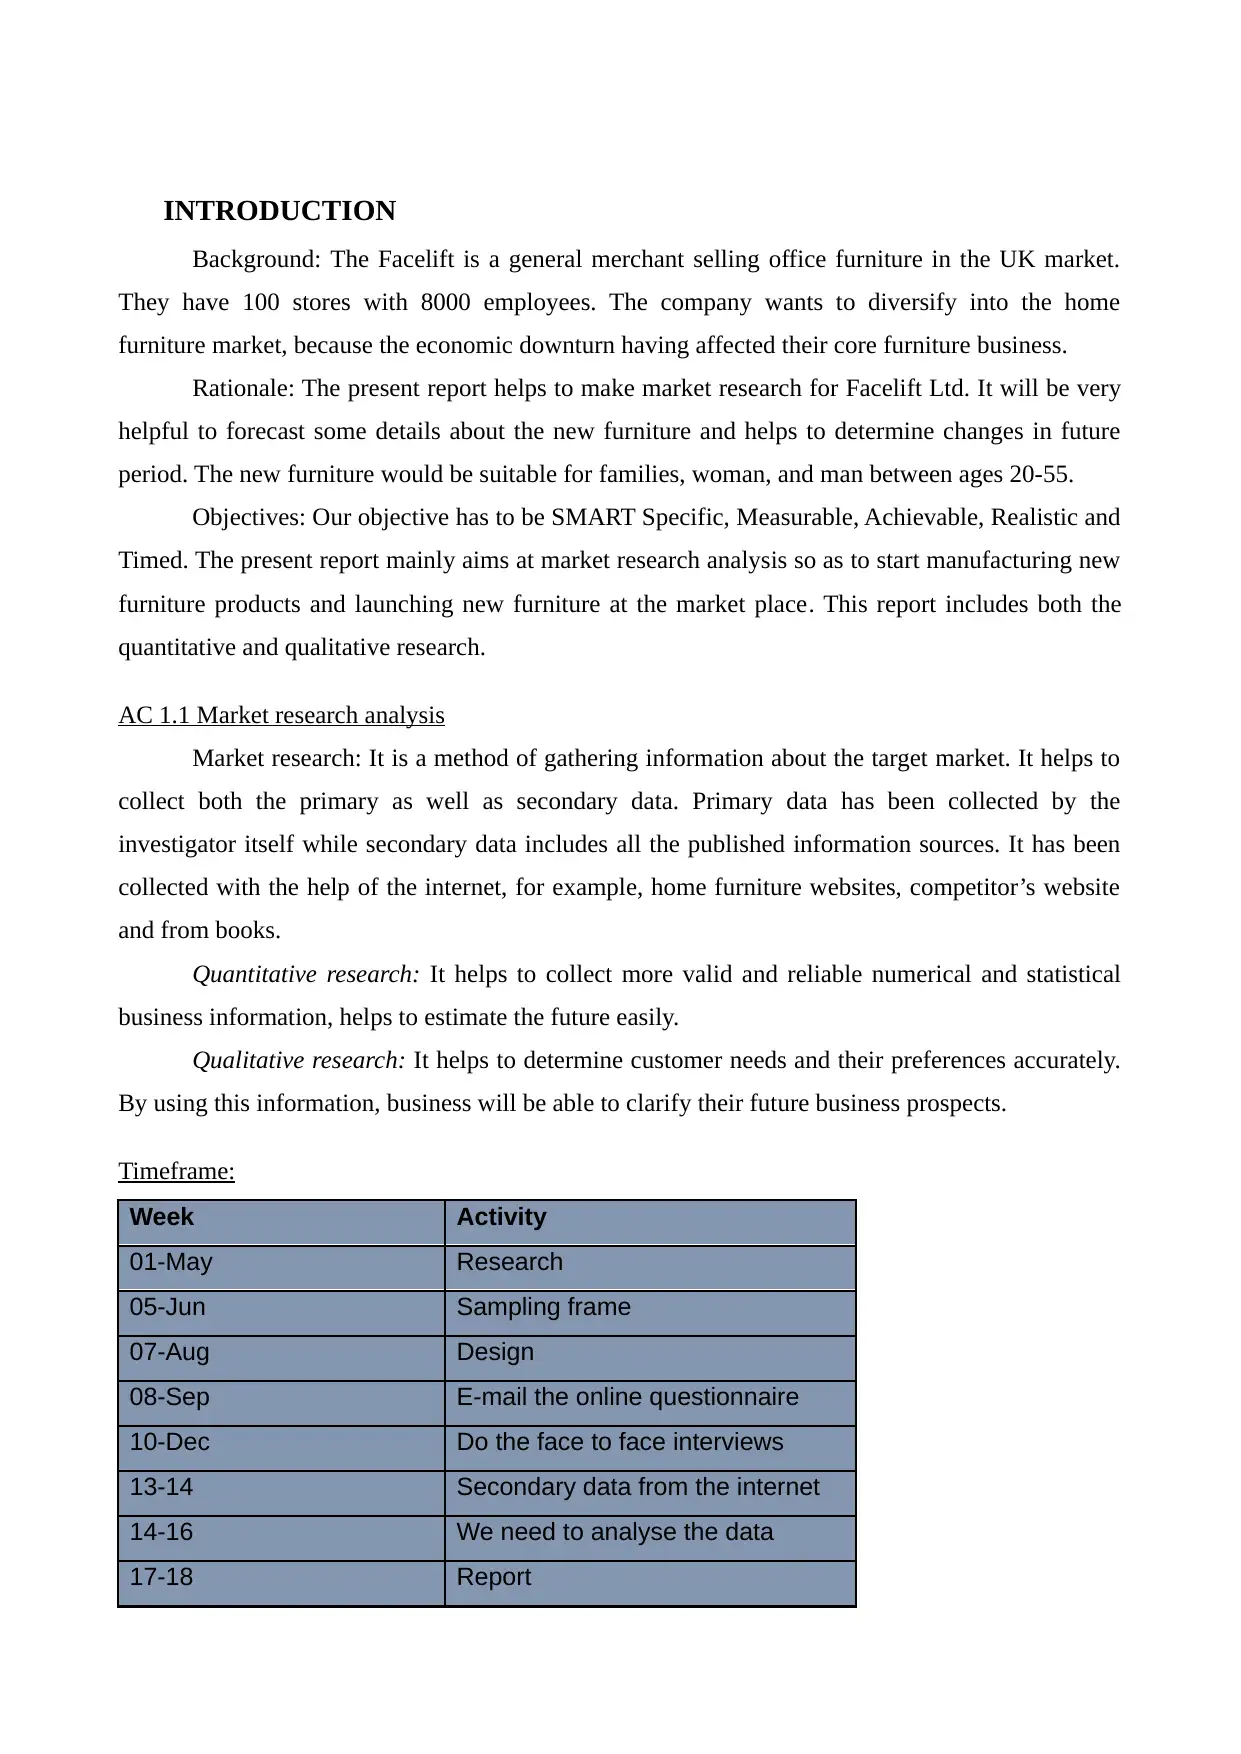
Timeframe:
Week Activity
01-May Research
05-Jun Sampling frame
07-Aug Design
08-Sep E-mail the online questionnaire
10-Dec Do the face to face interviews
13-14 Secondary data from the internet
14-16 We need to analyse the data
17-18 Report
Background: The Facelift is a general merchant selling office furniture in the UK market.
They have 100 stores with 8000 employees. The company wants to diversify into the home
furniture market, because the economic downturn having affected their core furniture business.
Rationale: The present report helps to make market research for Facelift Ltd. It will be very
helpful to forecast some details about the new furniture and helps to determine changes in future
period. The new furniture would be suitable for families, woman, and man between ages 20-55.
Objectives: Our objective has to be SMART Specific, Measurable, Achievable, Realistic and
Timed. The present report mainly aims at market research analysis so as to start manufacturing new
furniture products and launching new furniture at the market place. This report includes both the
quantitative and qualitative research.
AC 1.1 Market research analysis
Market research: It is a method of gathering information about the target market. It helps to
collect both the primary as well as secondary data. Primary data has been collected by the
investigator itself while secondary data includes all the published information sources. It has been
collected with the help of the internet, for example, home furniture websites, competitor’s website
and from books.
Quantitative research: It helps to collect more valid and reliable numerical and statistical
business information, helps to estimate the future easily.
Qualitative research: It helps to determine customer needs and their preferences accurately.
By using this information, business will be able to clarify their future business prospects.
Timeframe:
Week Activity
01-May Research
05-Jun Sampling frame
07-Aug Design
08-Sep E-mail the online questionnaire
10-Dec Do the face to face interviews
13-14 Secondary data from the internet
14-16 We need to analyse the data
17-18 Report
18-22 Launch the new product
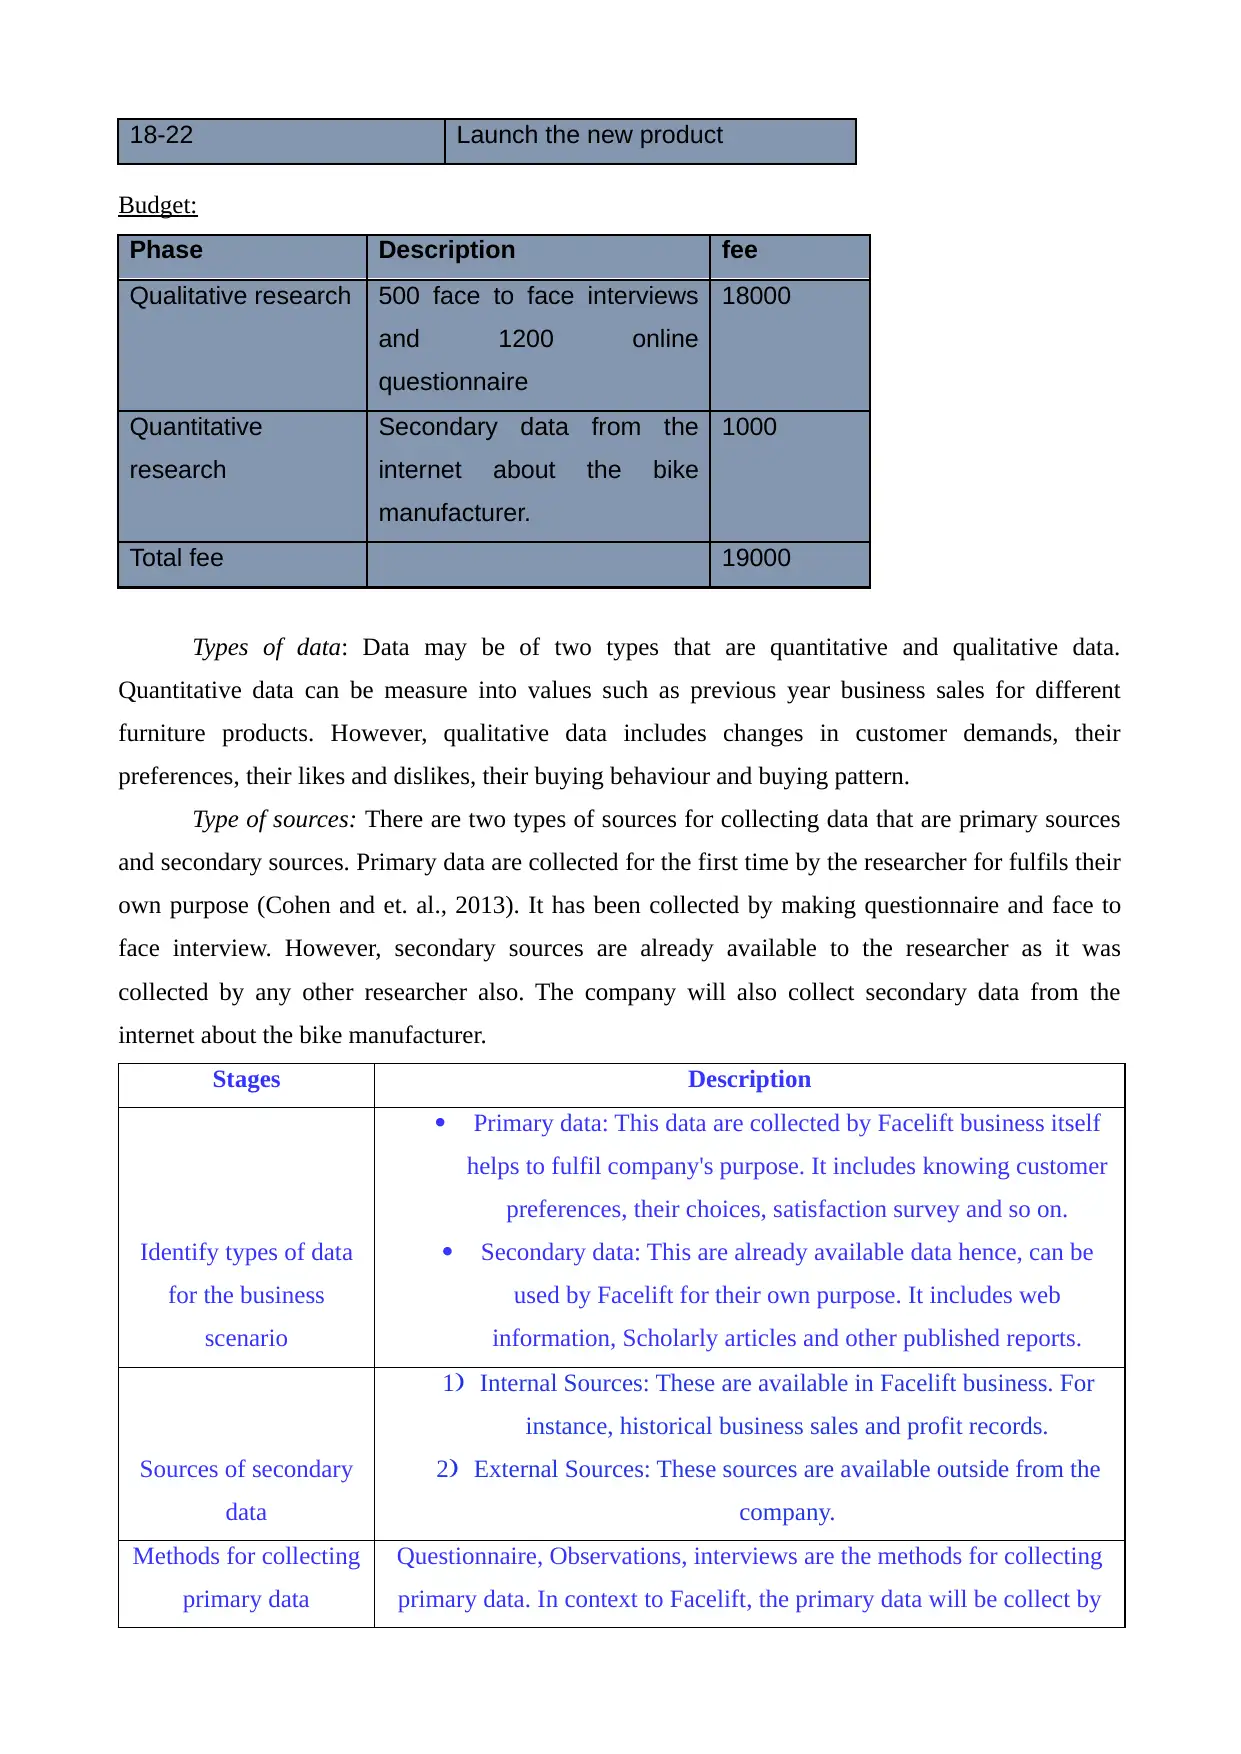
Budget:
Phase Description fee
Qualitative research 500 face to face interviews
and 1200 online
questionnaire
18000
Quantitative
research
Secondary data from the
internet about the bike
manufacturer.
1000
Total fee 19000
Types of data: Data may be of two types that are quantitative and qualitative data.
Quantitative data can be measure into values such as previous year business sales for different
furniture products. However, qualitative data includes changes in customer demands, their
preferences, their likes and dislikes, their buying behaviour and buying pattern.
Type of sources: There are two types of sources for collecting data that are primary sources
and secondary sources. Primary data are collected for the first time by the researcher for fulfils their
own purpose (Cohen and et. al., 2013). It has been collected by making questionnaire and face to
face interview. However, secondary sources are already available to the researcher as it was
collected by any other researcher also. The company will also collect secondary data from the
internet about the bike manufacturer.
Stages Description
Identify types of data
for the business
scenario
Primary data: This data are collected by Facelift business itself
helps to fulfil company's purpose. It includes knowing customer
preferences, their choices, satisfaction survey and so on.
Secondary data: This are already available data hence, can be
used by Facelift for their own purpose. It includes web
information, Scholarly articles and other published reports.
Sources of secondary
data
1) Internal Sources: These are available in Facelift business. For
instance, historical business sales and profit records.
2) External Sources: These sources are available outside from the
company.
Methods for collecting
primary data
Questionnaire, Observations, interviews are the methods for collecting
primary data. In context to Facelift, the primary data will be collect by
⊘ This is a preview!⊘
Do you want full access?
Subscribe today to unlock all pages.
Trusted by 1+ million students worldwide
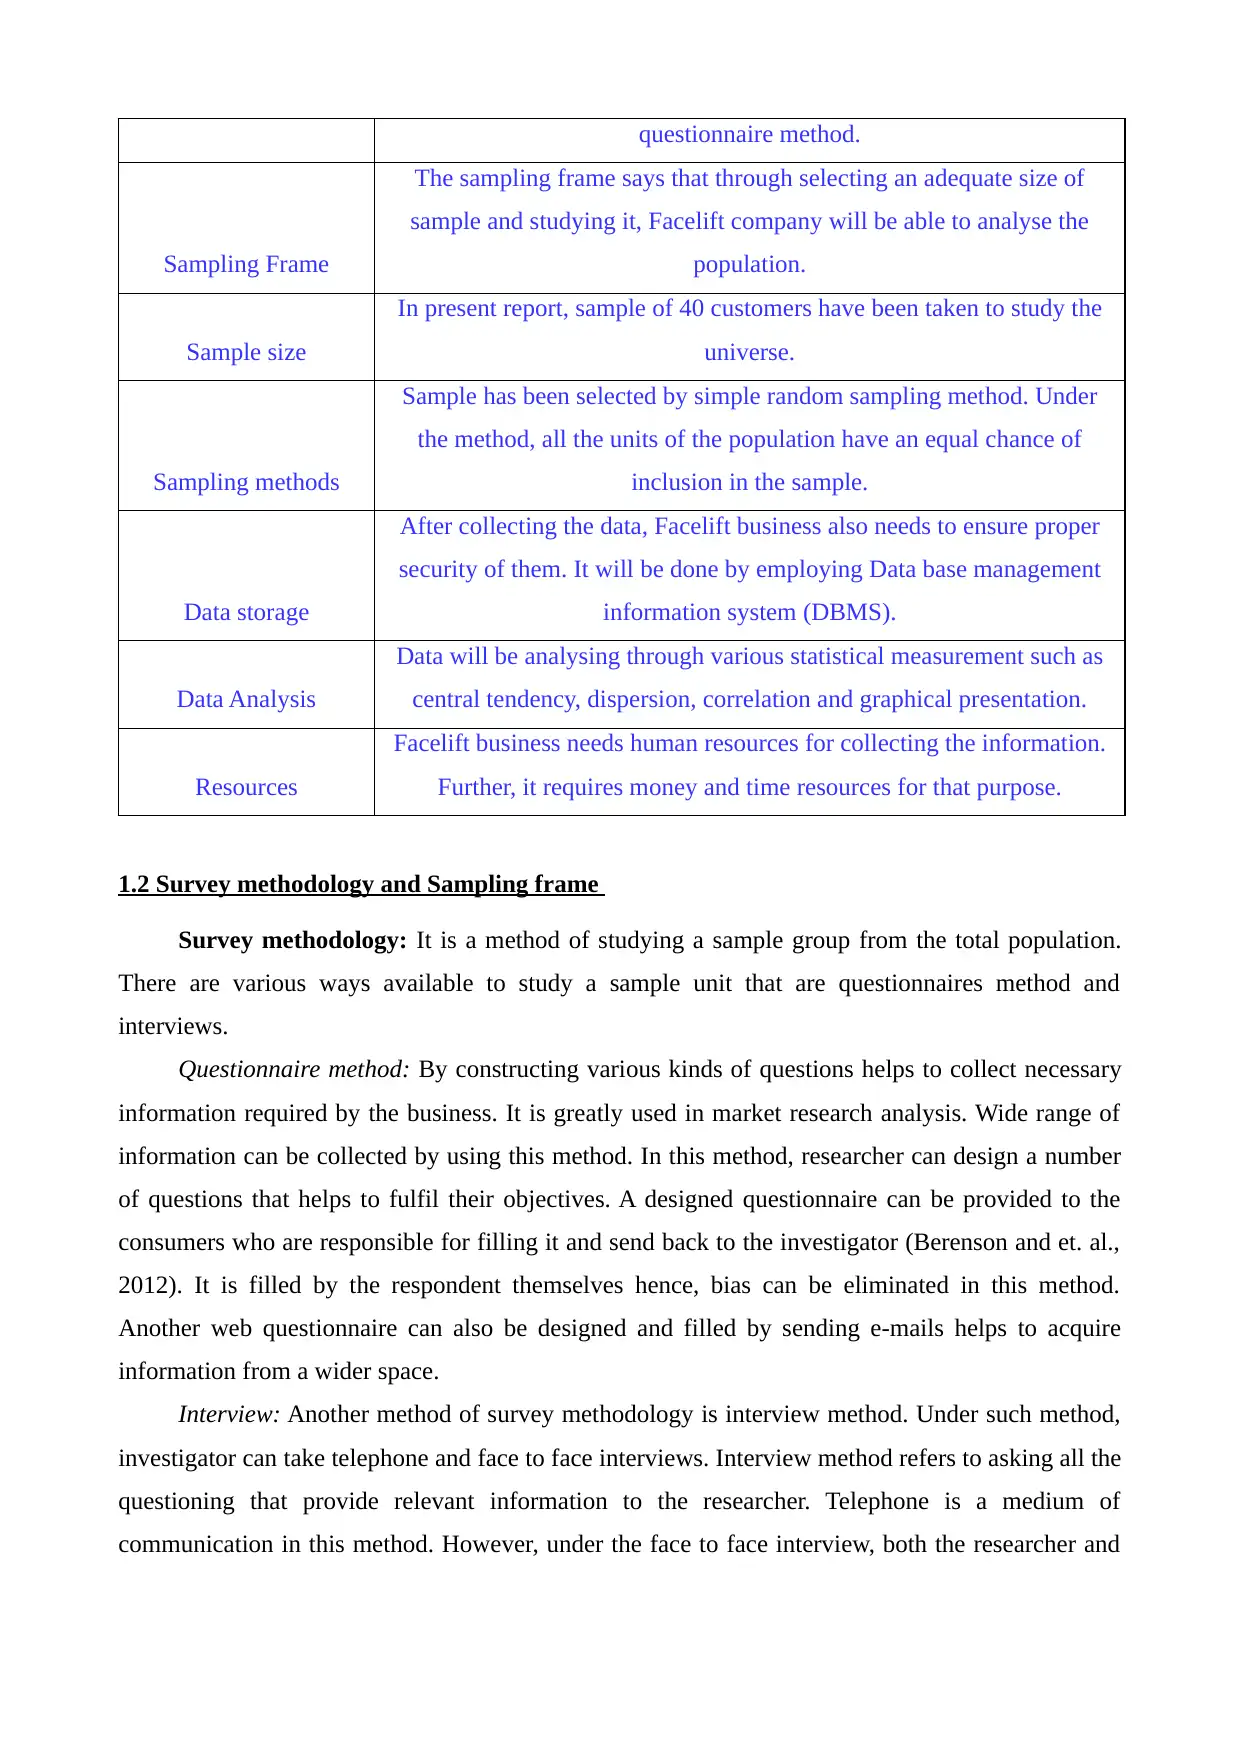
questionnaire method.
Sampling Frame
The sampling frame says that through selecting an adequate size of
sample and studying it, Facelift company will be able to analyse the
population.
Sample size
In present report, sample of 40 customers have been taken to study the
universe.
Sampling methods
Sample has been selected by simple random sampling method. Under
the method, all the units of the population have an equal chance of
inclusion in the sample.
Data storage
After collecting the data, Facelift business also needs to ensure proper
security of them. It will be done by employing Data base management
information system (DBMS).
Data Analysis
Data will be analysing through various statistical measurement such as
central tendency, dispersion, correlation and graphical presentation.
Resources
Facelift business needs human resources for collecting the information.
Further, it requires money and time resources for that purpose.
1.2 Survey methodology and Sampling frame
Survey methodology: It is a method of studying a sample group from the total population.
There are various ways available to study a sample unit that are questionnaires method and
interviews.
Questionnaire method: By constructing various kinds of questions helps to collect necessary
information required by the business. It is greatly used in market research analysis. Wide range of
information can be collected by using this method. In this method, researcher can design a number
of questions that helps to fulfil their objectives. A designed questionnaire can be provided to the
consumers who are responsible for filling it and send back to the investigator (Berenson and et. al.,
2012). It is filled by the respondent themselves hence, bias can be eliminated in this method.
Another web questionnaire can also be designed and filled by sending e-mails helps to acquire
information from a wider space.
Interview: Another method of survey methodology is interview method. Under such method,
investigator can take telephone and face to face interviews. Interview method refers to asking all the
questioning that provide relevant information to the researcher. Telephone is a medium of
communication in this method. However, under the face to face interview, both the researcher and
Paraphrase This Document
Need a fresh take? Get an instant paraphrase of this document with our AI Paraphraser
respondent are in front of each other. This is quite effective method as investigator can analyse the
respondent in an effective manner. However, bias possibility is the disadvantage of this method.
Sampling frame: It is very difficult for every corporation to analyse the universe as it takes
long time and will be very expensive also. Therefore, business has to identify an appropriate size of
sample that represents all the characteristics of universe. The method employs that by analysing the
representative sample, Facelift business will be able to analyse whole the universe and take
effective decisions. In context to Facelift business, we have taken a sample of 40 people by using
simple random sampling method. In this method, all the units of the universe have an equal
probability of inclusion in the sample (Morato, 2013). The reason for using this method is that,
sampling error can be determined in this method helps to provide better results.
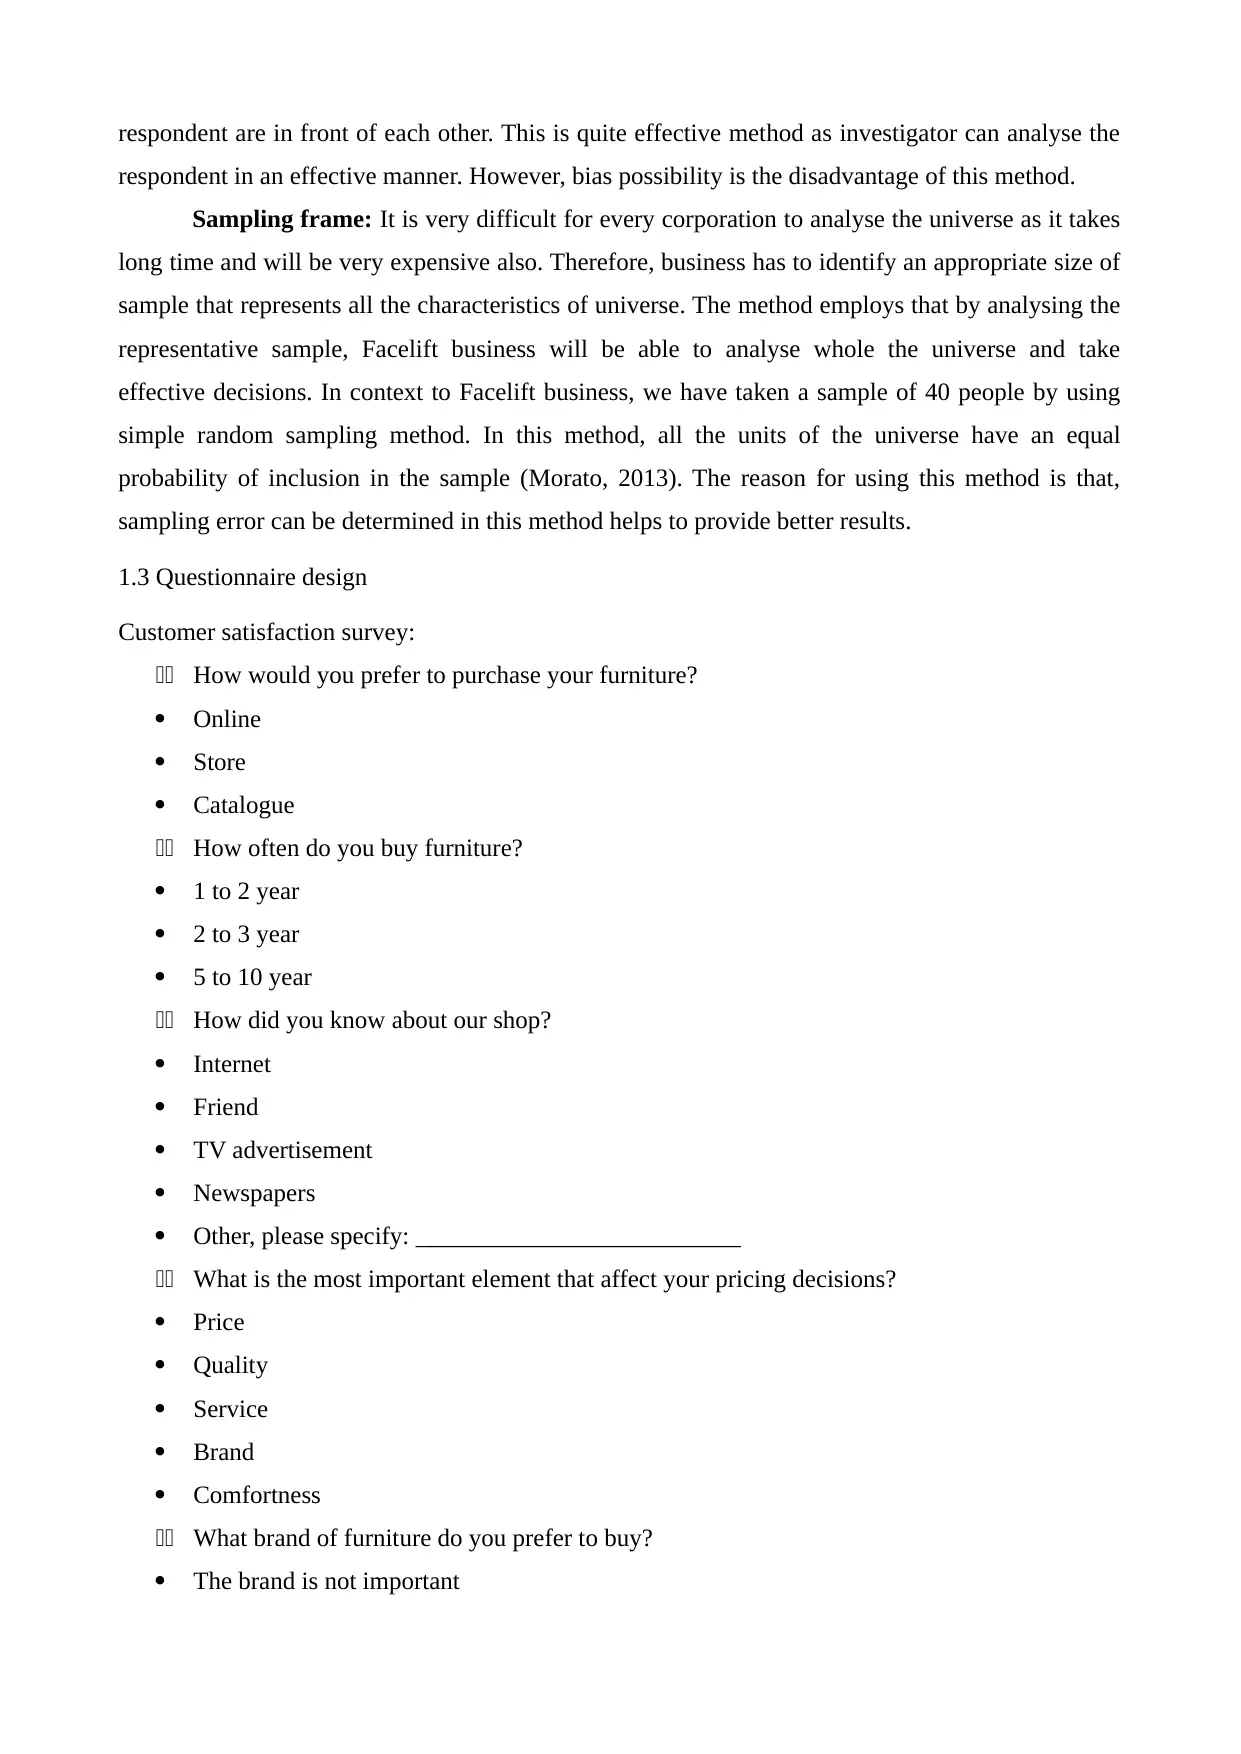
1.3 Questionnaire design
Customer satisfaction survey:
11 How would you prefer to purchase your furniture?
Online
Store
Catalogue
11 How often do you buy furniture?
1 to 2 year
2 to 3 year
5 to 10 year
11 How did you know about our shop?
Internet
Friend
TV advertisement
Newspapers
Other, please specify: __________________________
11 What is the most important element that affect your pricing decisions?
Price
Quality
Service
Brand
Comfortness
11 What brand of furniture do you prefer to buy?
The brand is not important
respondent in an effective manner. However, bias possibility is the disadvantage of this method.
Sampling frame: It is very difficult for every corporation to analyse the universe as it takes
long time and will be very expensive also. Therefore, business has to identify an appropriate size of
sample that represents all the characteristics of universe. The method employs that by analysing the
representative sample, Facelift business will be able to analyse whole the universe and take
effective decisions. In context to Facelift business, we have taken a sample of 40 people by using
simple random sampling method. In this method, all the units of the universe have an equal
probability of inclusion in the sample (Morato, 2013). The reason for using this method is that,
sampling error can be determined in this method helps to provide better results.
1.3 Questionnaire design
Customer satisfaction survey:
11 How would you prefer to purchase your furniture?
Online
Store
Catalogue
11 How often do you buy furniture?
1 to 2 year
2 to 3 year
5 to 10 year
11 How did you know about our shop?
Internet
Friend
TV advertisement
Newspapers
Other, please specify: __________________________
11 What is the most important element that affect your pricing decisions?
Price
Quality
Service
Brand
Comfortness
11 What brand of furniture do you prefer to buy?
The brand is not important
Name the brand
11 What kind of furniture do you intend to buy?
Bedroom furniture
Living room furniture
Kitchen furniture
11 Which style of furniture you often used to prefer?
Antique
Decorative
Handicrafted
Any other please specify_______________
11 Do you want to give any suggestion for making improvement our the furntiture quality?
Please specify______________________
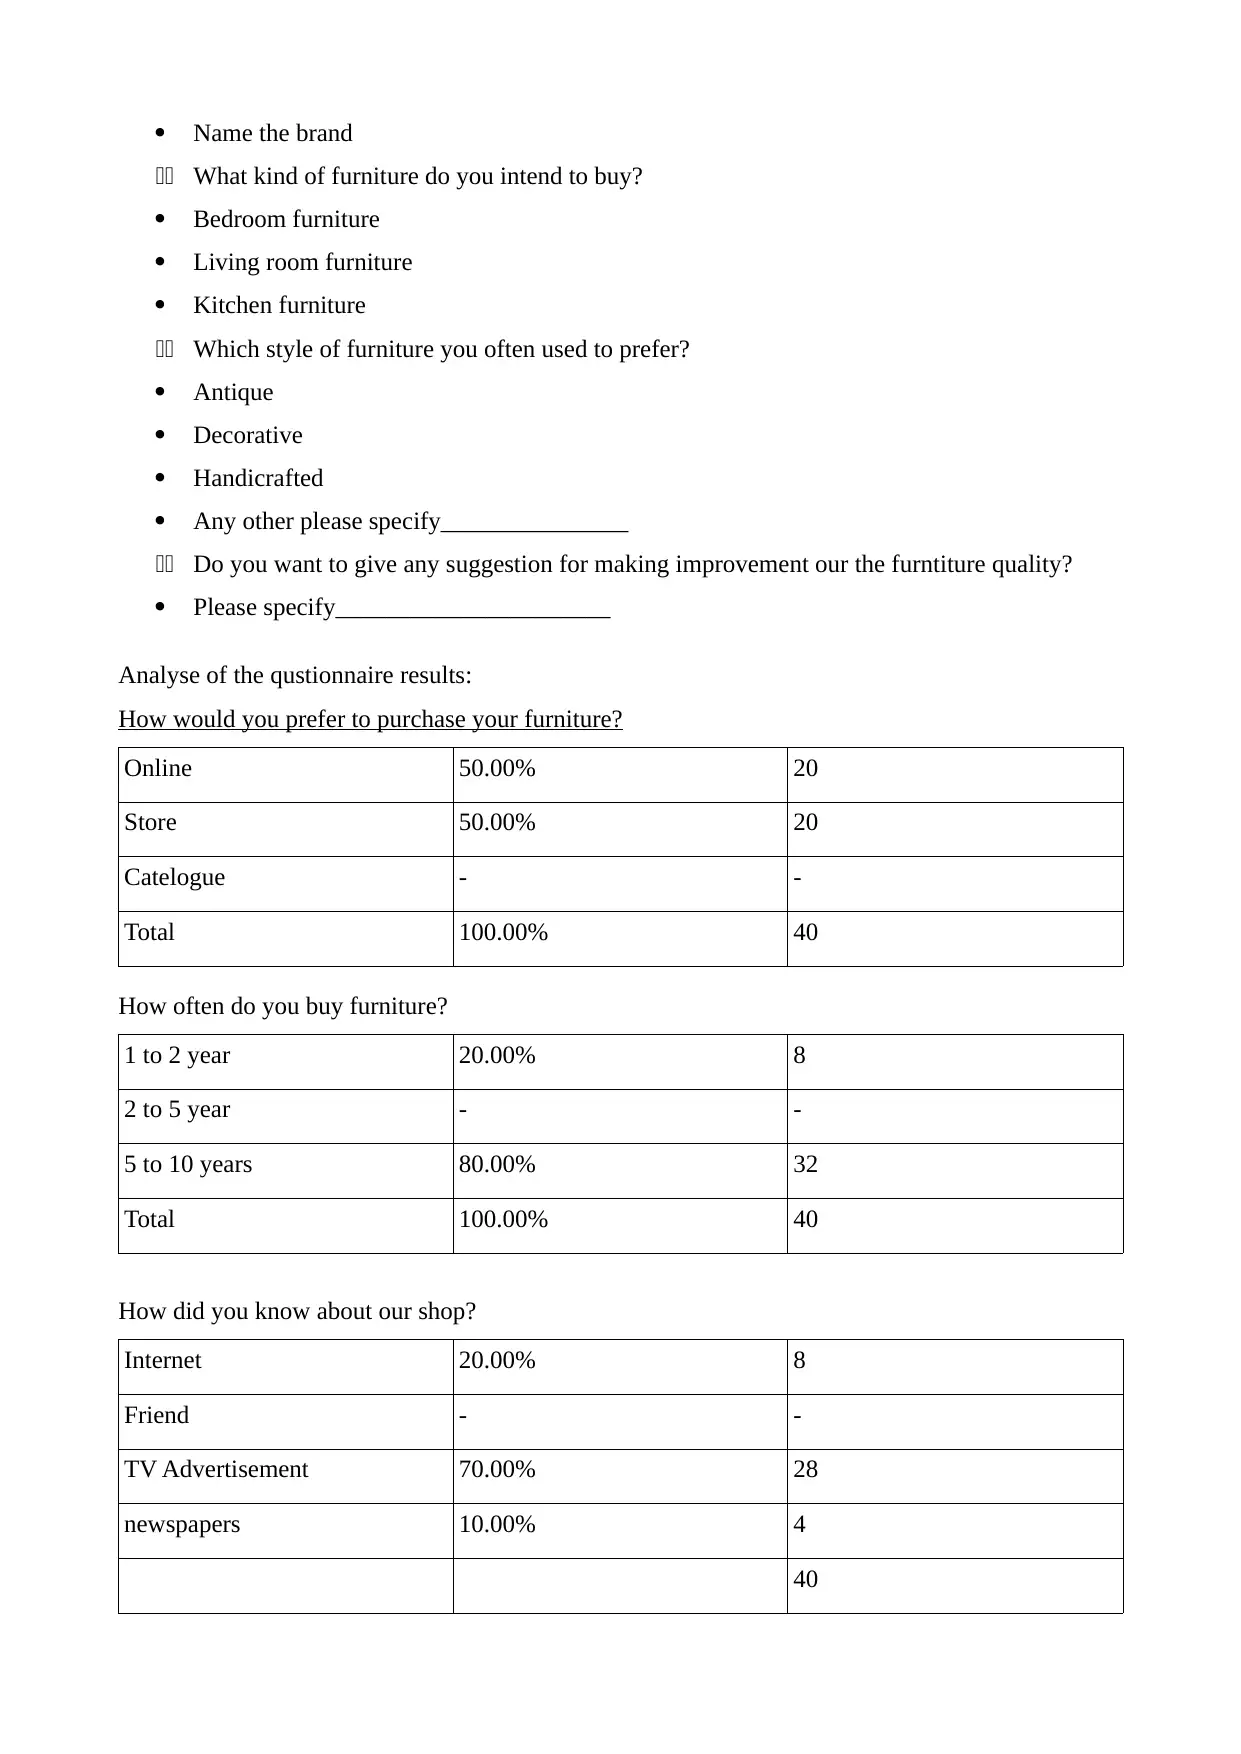
Analyse of the qustionnaire results:
How would you prefer to purchase your furniture?
Online 50.00% 20
Store 50.00% 20
Catelogue - -
Total 100.00% 40
How often do you buy furniture?
1 to 2 year 20.00% 8
2 to 5 year - -
5 to 10 years 80.00% 32
Total 100.00% 40
How did you know about our shop?
Internet 20.00% 8
Friend - -
TV Advertisement 70.00% 28
newspapers 10.00% 4
40
11 What kind of furniture do you intend to buy?
Bedroom furniture
Living room furniture
Kitchen furniture
11 Which style of furniture you often used to prefer?
Antique
Decorative
Handicrafted
Any other please specify_______________
11 Do you want to give any suggestion for making improvement our the furntiture quality?
Please specify______________________
Analyse of the qustionnaire results:
How would you prefer to purchase your furniture?
Online 50.00% 20
Store 50.00% 20
Catelogue - -
Total 100.00% 40
How often do you buy furniture?
1 to 2 year 20.00% 8
2 to 5 year - -
5 to 10 years 80.00% 32
Total 100.00% 40
How did you know about our shop?
Internet 20.00% 8
Friend - -
TV Advertisement 70.00% 28
newspapers 10.00% 4
40
⊘ This is a preview!⊘
Do you want full access?
Subscribe today to unlock all pages.
Trusted by 1+ million students worldwide
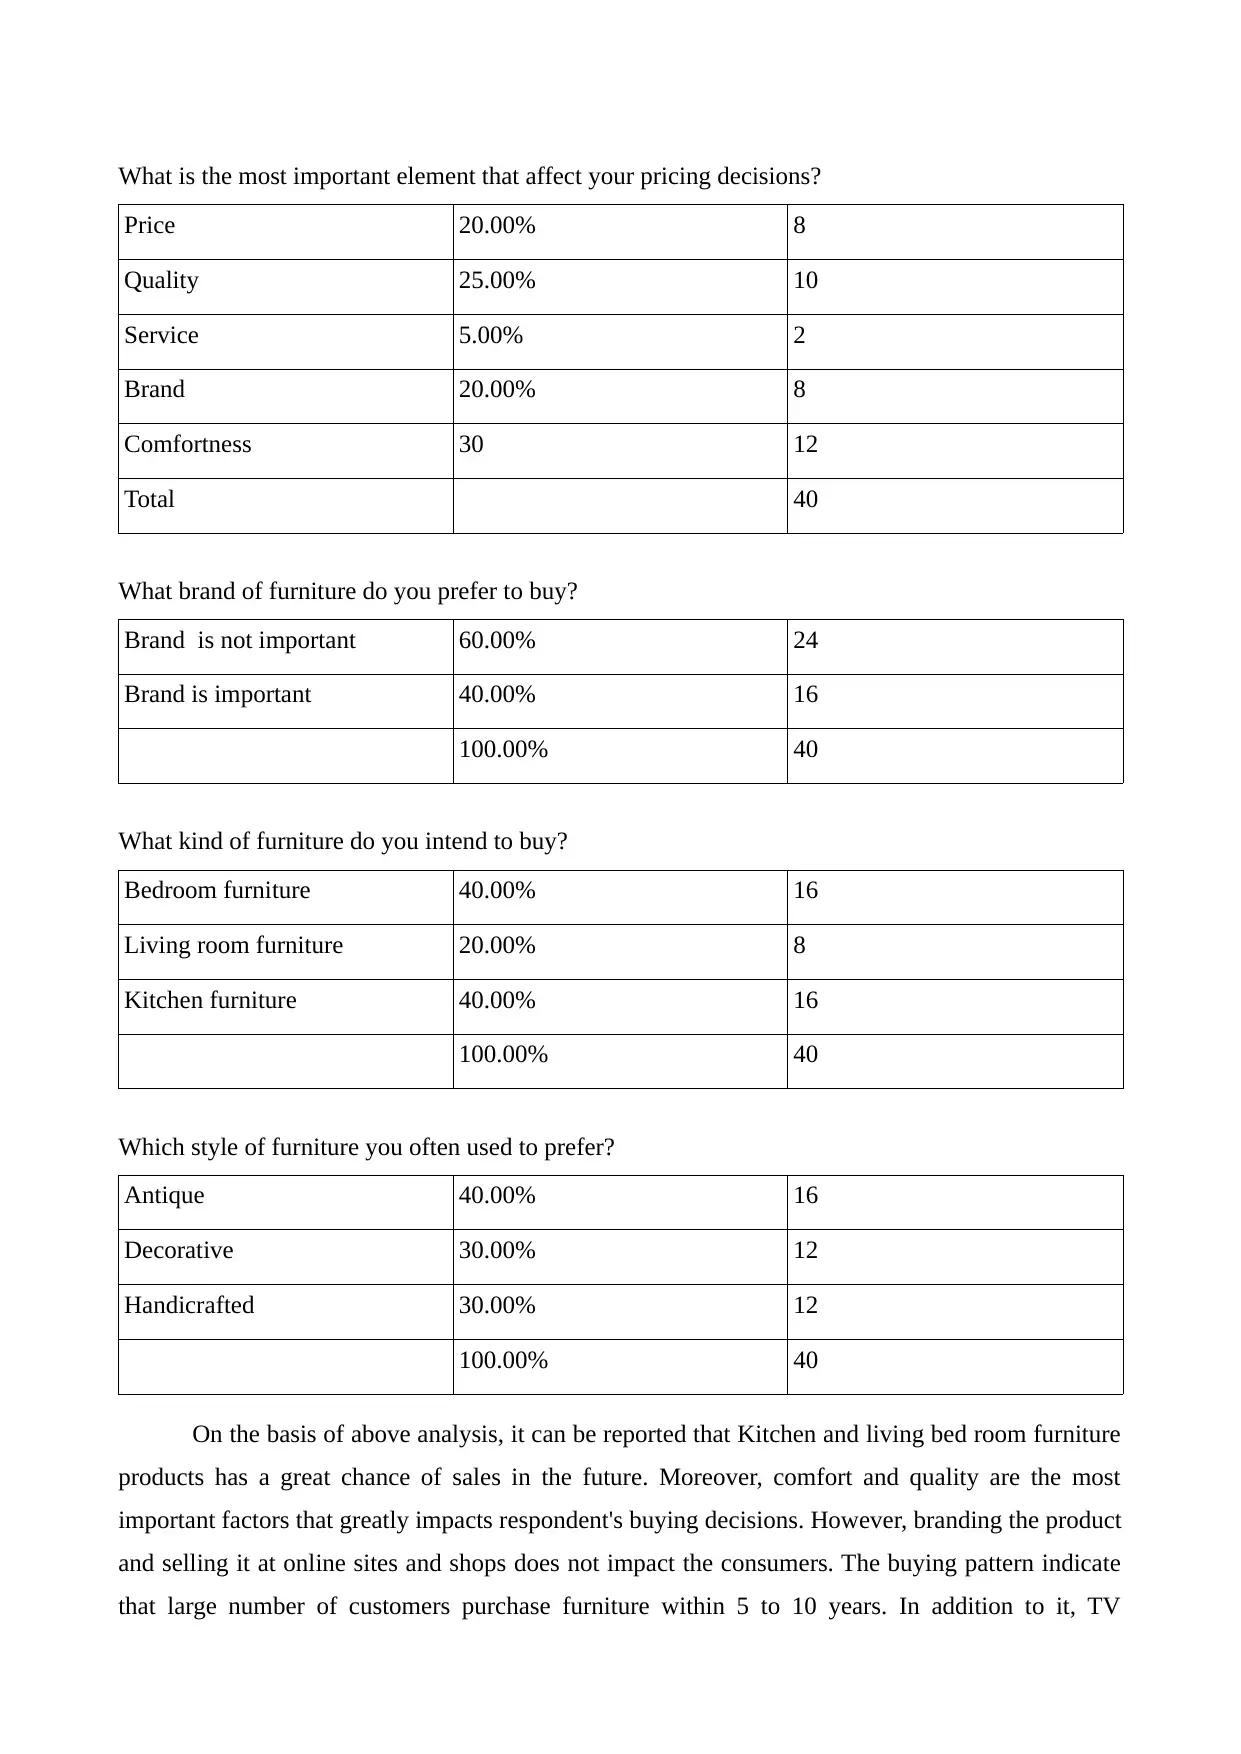
What is the most important element that affect your pricing decisions?
Price 20.00% 8
Quality 25.00% 10
Service 5.00% 2
Brand 20.00% 8
Comfortness 30 12
Total 40
What brand of furniture do you prefer to buy?
Brand is not important 60.00% 24
Brand is important 40.00% 16
100.00% 40
What kind of furniture do you intend to buy?
Bedroom furniture 40.00% 16
Living room furniture 20.00% 8
Kitchen furniture 40.00% 16
100.00% 40
Which style of furniture you often used to prefer?
Antique 40.00% 16
Decorative 30.00% 12
Handicrafted 30.00% 12
100.00% 40
On the basis of above analysis, it can be reported that Kitchen and living bed room furniture
products has a great chance of sales in the future. Moreover, comfort and quality are the most
important factors that greatly impacts respondent's buying decisions. However, branding the product
and selling it at online sites and shops does not impact the consumers. The buying pattern indicate
that large number of customers purchase furniture within 5 to 10 years. In addition to it, TV
Paraphrase This Document
Need a fresh take? Get an instant paraphrase of this document with our AI Paraphraser
advertisement is the best way for marketing the product as 70% customer has knowledge about the
products through TV advertisement. Therefore, it can be reported that facelift business has to
improve quality and comfort of kitchen and bedroom furniture that provide high customer
satisfaction. Moreover, sales can be enhancing by making more effective TV advertisement for the
products. Further, company should make antique style of furniture as 40% of the respondent replied
that they prefer Antique style of furniture.
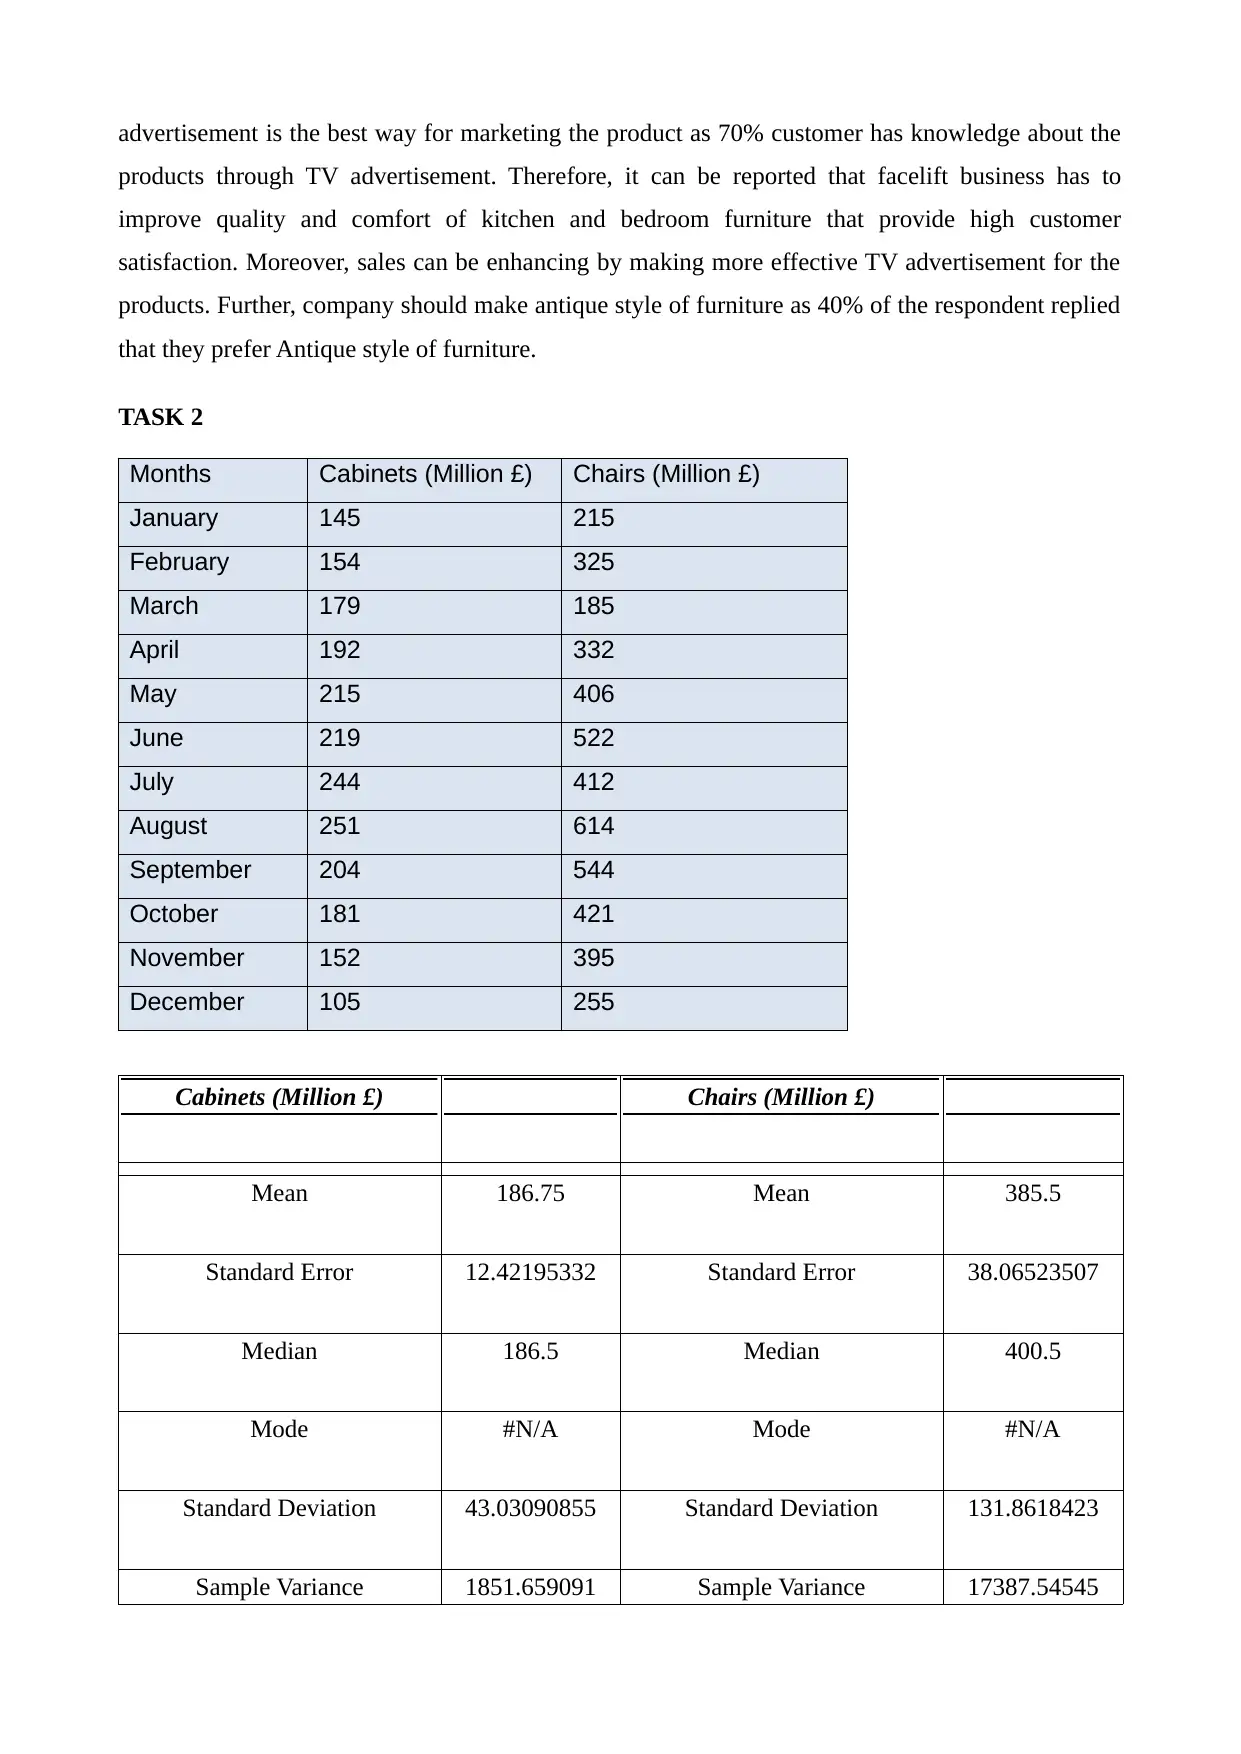
TASK 2
Months Cabinets (Million £) Chairs (Million £)
January 145 215
February 154 325
March 179 185
April 192 332
May 215 406
June 219 522
July 244 412
August 251 614
September 204 544
October 181 421
November 152 395
December 105 255
Cabinets (Million £) Chairs (Million £)
Mean 186.75 Mean 385.5
Standard Error 12.42195332 Standard Error 38.06523507
Median 186.5 Median 400.5
Mode #N/A Mode #N/A
Standard Deviation 43.03090855 Standard Deviation 131.8618423
Sample Variance 1851.659091 Sample Variance 17387.54545
products through TV advertisement. Therefore, it can be reported that facelift business has to
improve quality and comfort of kitchen and bedroom furniture that provide high customer
satisfaction. Moreover, sales can be enhancing by making more effective TV advertisement for the
products. Further, company should make antique style of furniture as 40% of the respondent replied
that they prefer Antique style of furniture.
TASK 2
Months Cabinets (Million £) Chairs (Million £)
January 145 215
February 154 325
March 179 185
April 192 332
May 215 406
June 219 522
July 244 412
August 251 614
September 204 544
October 181 421
November 152 395
December 105 255
Cabinets (Million £) Chairs (Million £)
Mean 186.75 Mean 385.5
Standard Error 12.42195332 Standard Error 38.06523507
Median 186.5 Median 400.5
Mode #N/A Mode #N/A
Standard Deviation 43.03090855 Standard Deviation 131.8618423
Sample Variance 1851.659091 Sample Variance 17387.54545
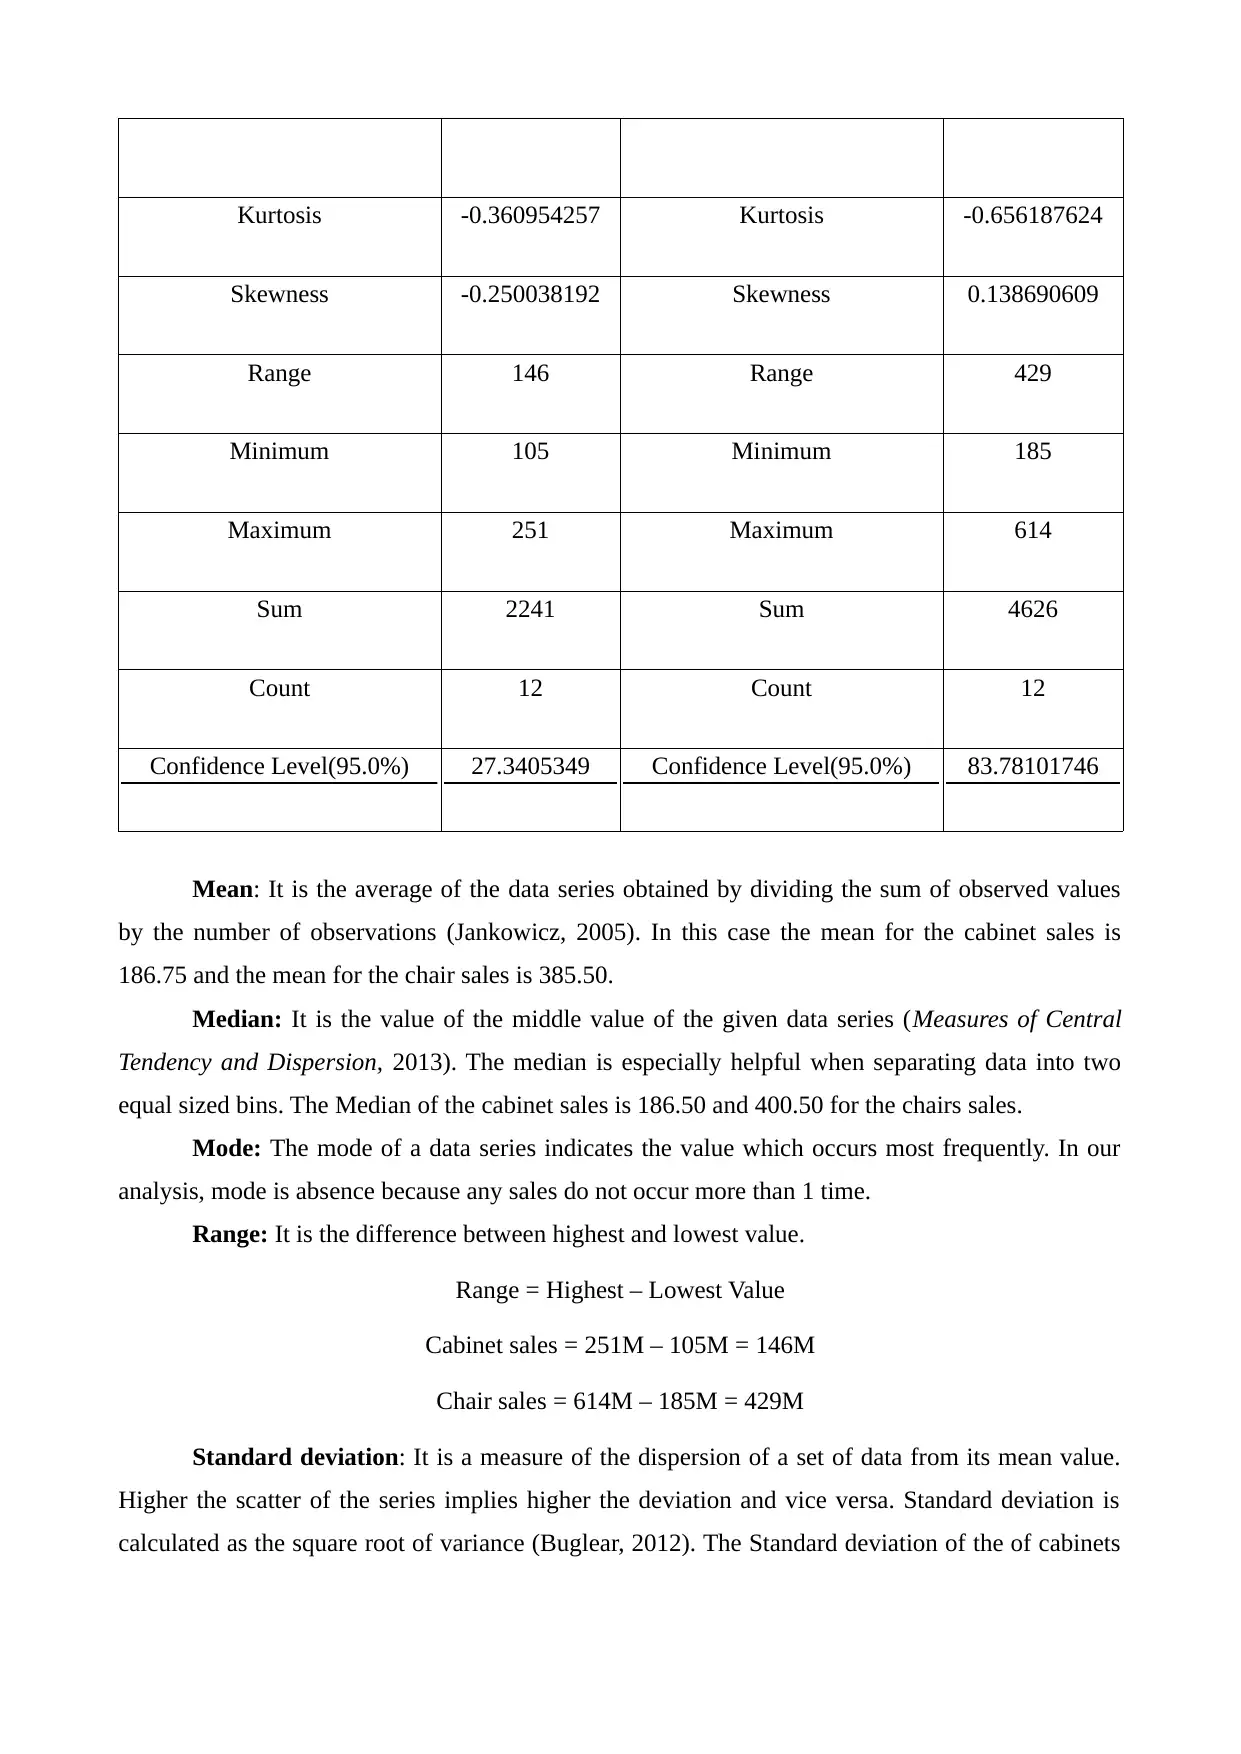
Kurtosis -0.360954257 Kurtosis -0.656187624
Skewness -0.250038192 Skewness 0.138690609
Range 146 Range 429
Minimum 105 Minimum 185
Maximum 251 Maximum 614
Sum 2241 Sum 4626
Count 12 Count 12
Confidence Level(95.0%) 27.3405349 Confidence Level(95.0%) 83.78101746
Mean: It is the average of the data series obtained by dividing the sum of observed values
by the number of observations (Jankowicz, 2005). In this case the mean for the cabinet sales is
186.75 and the mean for the chair sales is 385.50.
Median: It is the value of the middle value of the given data series (Measures of Central
Tendency and Dispersion, 2013). The median is especially helpful when separating data into two
equal sized bins. The Median of the cabinet sales is 186.50 and 400.50 for the chairs sales.
Mode: The mode of a data series indicates the value which occurs most frequently. In our
analysis, mode is absence because any sales do not occur more than 1 time.
Range: It is the difference between highest and lowest value.
Range = Highest – Lowest Value
Cabinet sales = 251M – 105M = 146M
Chair sales = 614M – 185M = 429M
Standard deviation: It is a measure of the dispersion of a set of data from its mean value.
Higher the scatter of the series implies higher the deviation and vice versa. Standard deviation is
calculated as the square root of variance (Buglear, 2012). The Standard deviation of the of cabinets
⊘ This is a preview!⊘
Do you want full access?
Subscribe today to unlock all pages.
Trusted by 1+ million students worldwide
and chair sales are 43.03 and 131.85 respectively. It indicates that Chair sales are highly deviated
from its mean as compared to cabinet sales.
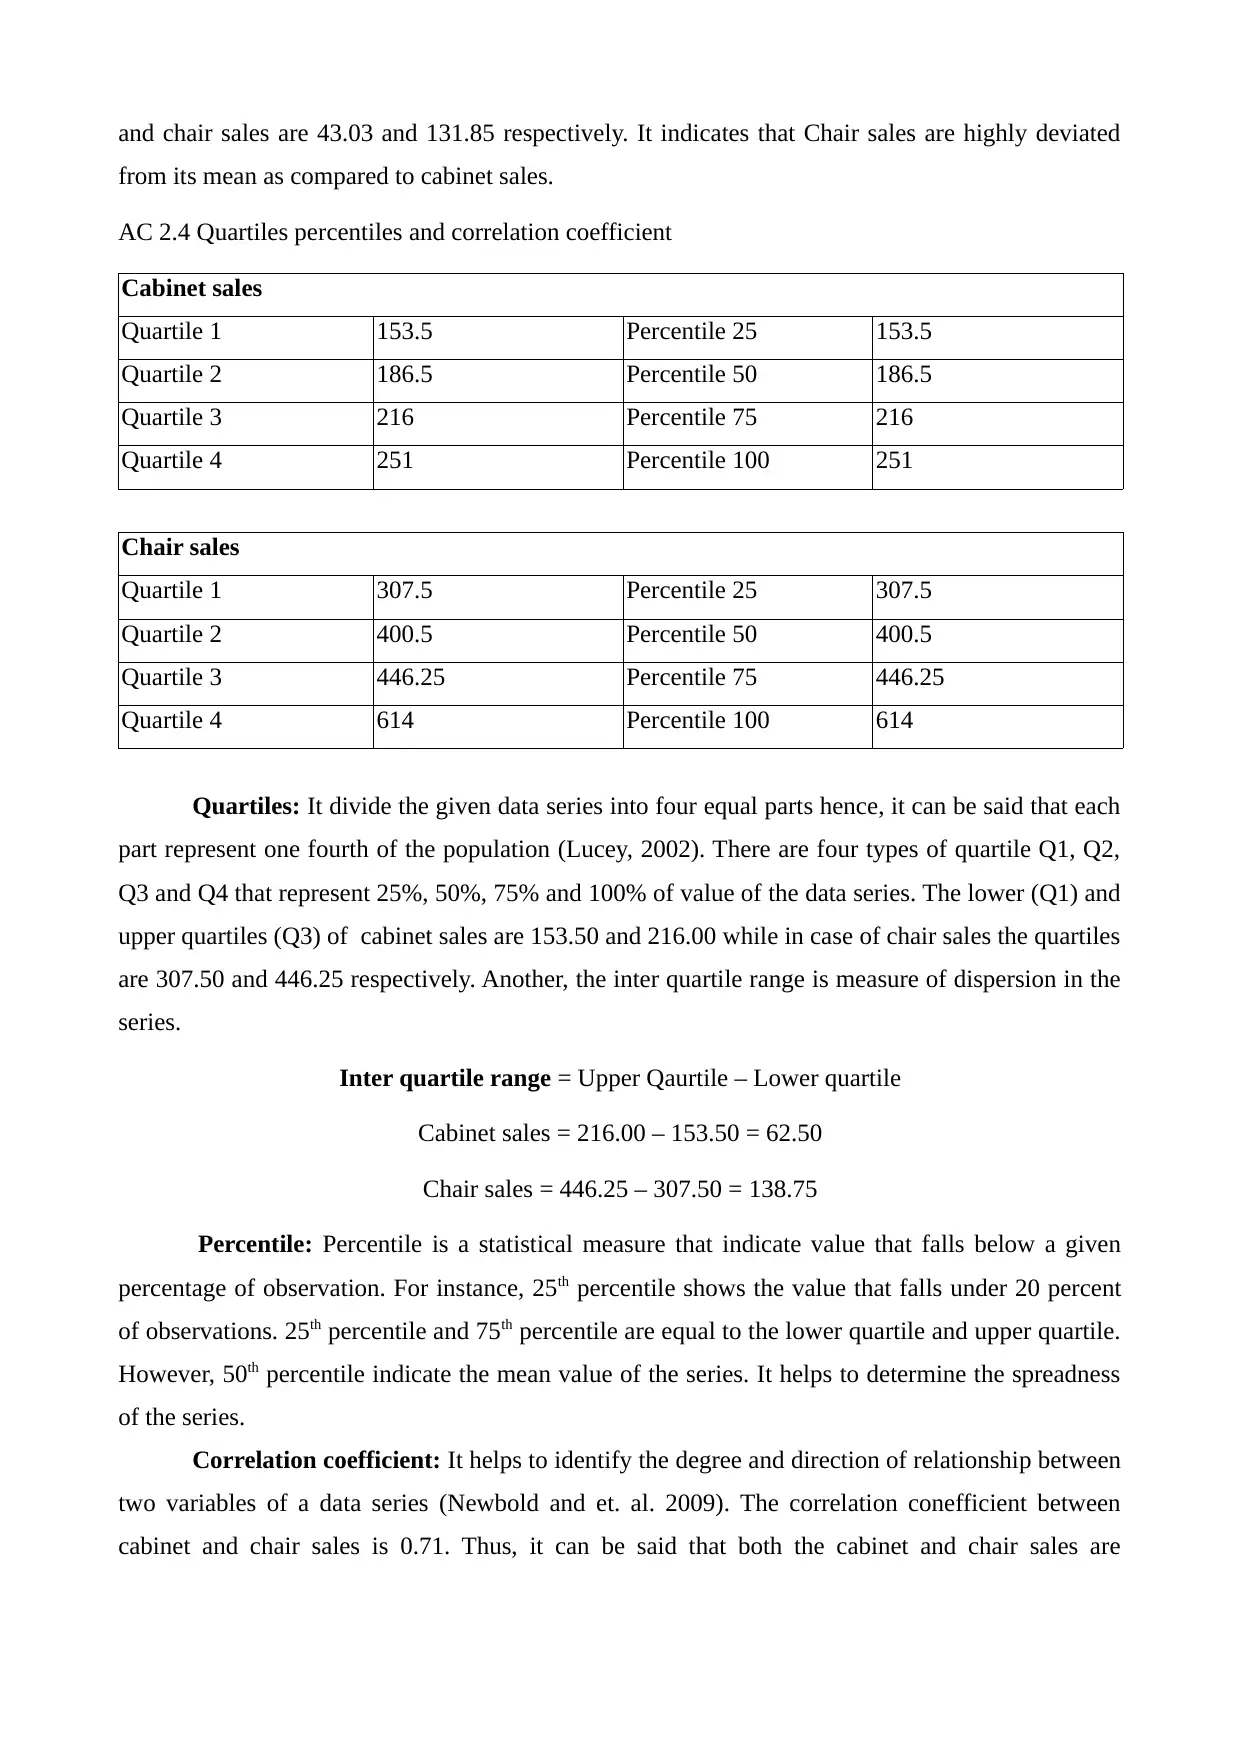
AC 2.4 Quartiles percentiles and correlation coefficient
Cabinet sales
Quartile 1 153.5 Percentile 25 153.5
Quartile 2 186.5 Percentile 50 186.5
Quartile 3 216 Percentile 75 216
Quartile 4 251 Percentile 100 251
Chair sales
Quartile 1 307.5 Percentile 25 307.5
Quartile 2 400.5 Percentile 50 400.5
Quartile 3 446.25 Percentile 75 446.25
Quartile 4 614 Percentile 100 614
Quartiles: It divide the given data series into four equal parts hence, it can be said that each
part represent one fourth of the population (Lucey, 2002). There are four types of quartile Q1, Q2,
Q3 and Q4 that represent 25%, 50%, 75% and 100% of value of the data series. The lower (Q1) and
upper quartiles (Q3) of cabinet sales are 153.50 and 216.00 while in case of chair sales the quartiles
are 307.50 and 446.25 respectively. Another, the inter quartile range is measure of dispersion in the
series.
Inter quartile range = Upper Qaurtile – Lower quartile
Cabinet sales = 216.00 – 153.50 = 62.50
Chair sales = 446.25 – 307.50 = 138.75
Percentile: Percentile is a statistical measure that indicate value that falls below a given
percentage of observation. For instance, 25th percentile shows the value that falls under 20 percent
of observations. 25th percentile and 75th percentile are equal to the lower quartile and upper quartile.
However, 50th percentile indicate the mean value of the series. It helps to determine the spreadness
of the series.
Correlation coefficient: It helps to identify the degree and direction of relationship between
two variables of a data series (Newbold and et. al. 2009). The correlation conefficient between
cabinet and chair sales is 0.71. Thus, it can be said that both the cabinet and chair sales are
from its mean as compared to cabinet sales.
AC 2.4 Quartiles percentiles and correlation coefficient
Cabinet sales
Quartile 1 153.5 Percentile 25 153.5
Quartile 2 186.5 Percentile 50 186.5
Quartile 3 216 Percentile 75 216
Quartile 4 251 Percentile 100 251
Chair sales
Quartile 1 307.5 Percentile 25 307.5
Quartile 2 400.5 Percentile 50 400.5
Quartile 3 446.25 Percentile 75 446.25
Quartile 4 614 Percentile 100 614
Quartiles: It divide the given data series into four equal parts hence, it can be said that each
part represent one fourth of the population (Lucey, 2002). There are four types of quartile Q1, Q2,
Q3 and Q4 that represent 25%, 50%, 75% and 100% of value of the data series. The lower (Q1) and
upper quartiles (Q3) of cabinet sales are 153.50 and 216.00 while in case of chair sales the quartiles
are 307.50 and 446.25 respectively. Another, the inter quartile range is measure of dispersion in the
series.
Inter quartile range = Upper Qaurtile – Lower quartile
Cabinet sales = 216.00 – 153.50 = 62.50
Chair sales = 446.25 – 307.50 = 138.75
Percentile: Percentile is a statistical measure that indicate value that falls below a given
percentage of observation. For instance, 25th percentile shows the value that falls under 20 percent
of observations. 25th percentile and 75th percentile are equal to the lower quartile and upper quartile.
However, 50th percentile indicate the mean value of the series. It helps to determine the spreadness
of the series.
Correlation coefficient: It helps to identify the degree and direction of relationship between
two variables of a data series (Newbold and et. al. 2009). The correlation conefficient between
cabinet and chair sales is 0.71. Thus, it can be said that both the cabinet and chair sales are
Paraphrase This Document
Need a fresh take? Get an instant paraphrase of this document with our AI Paraphraser
positively related to each other. Higher the cabinet sales implies higher the chair sales and vice
versa.
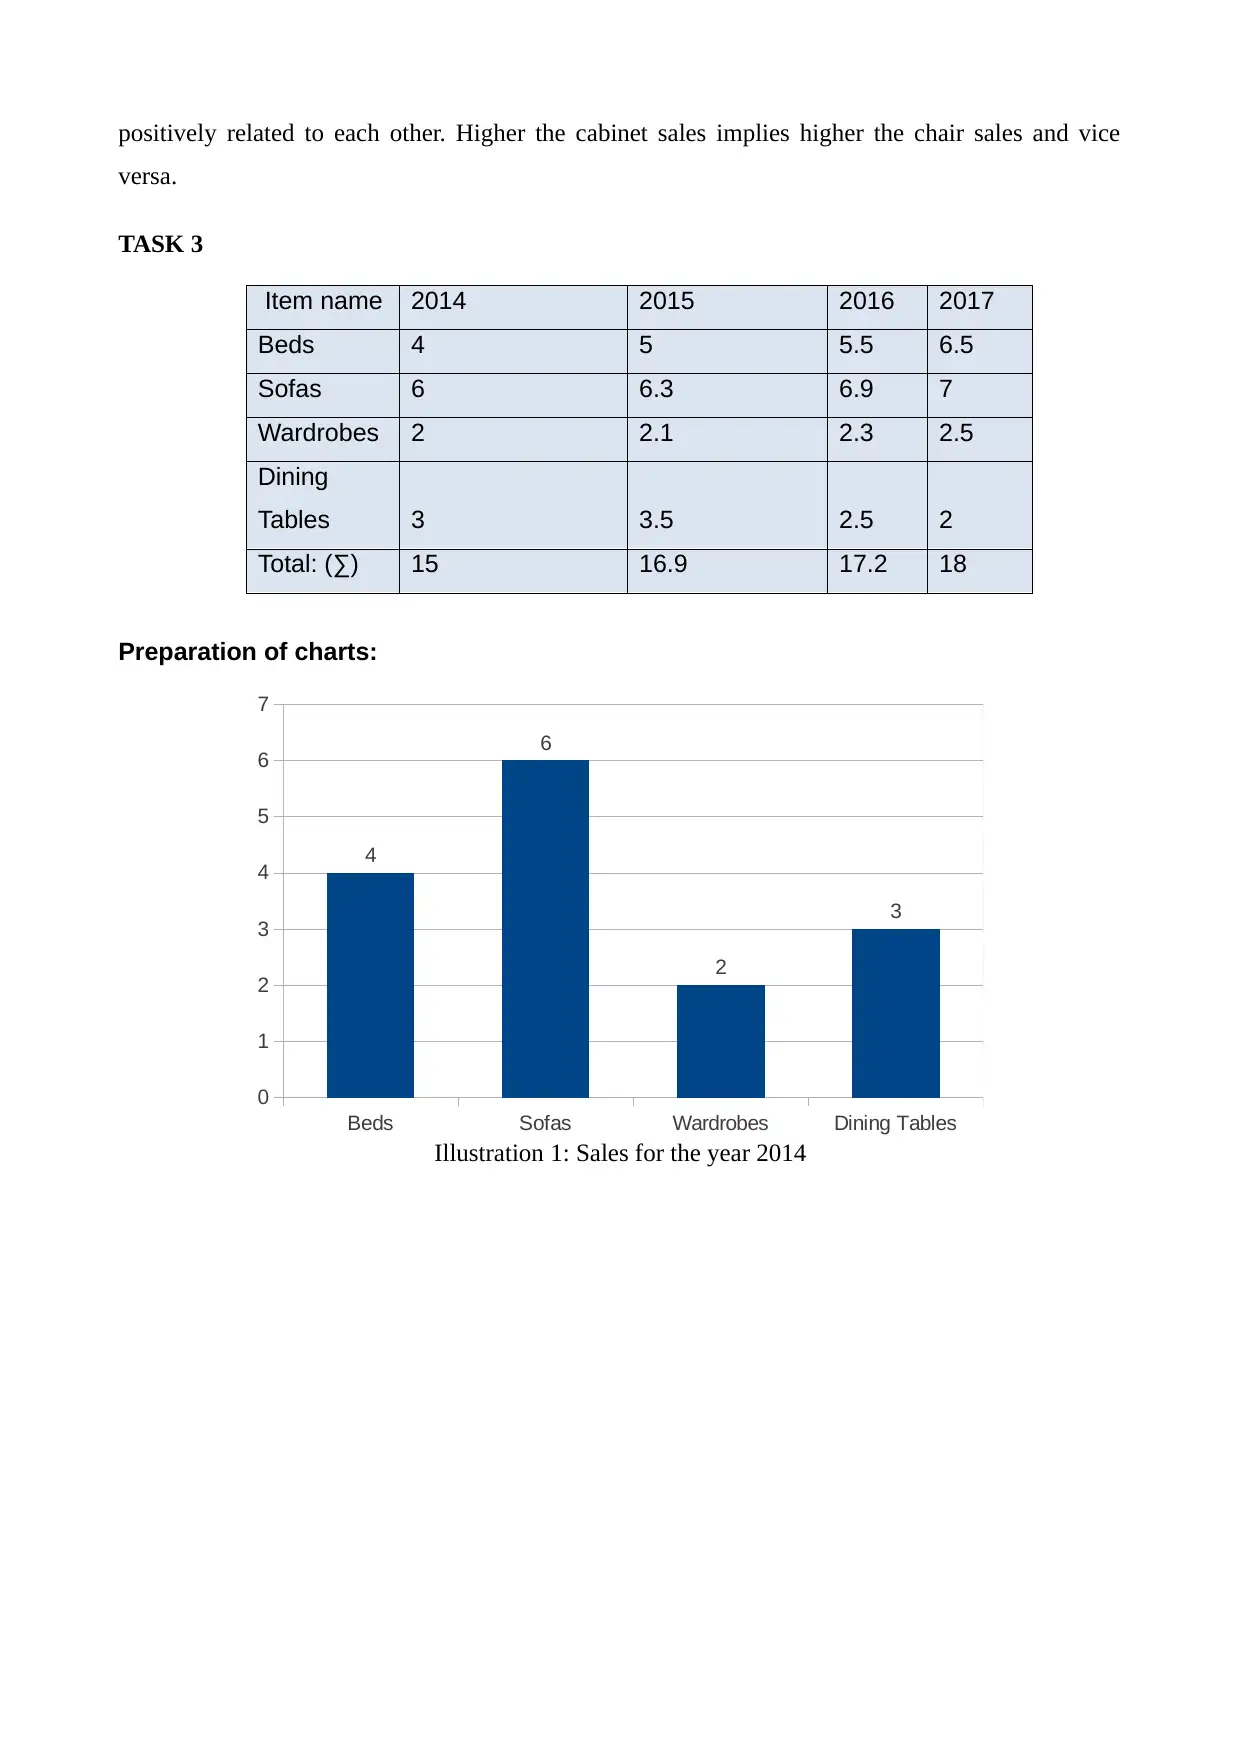
TASK 3
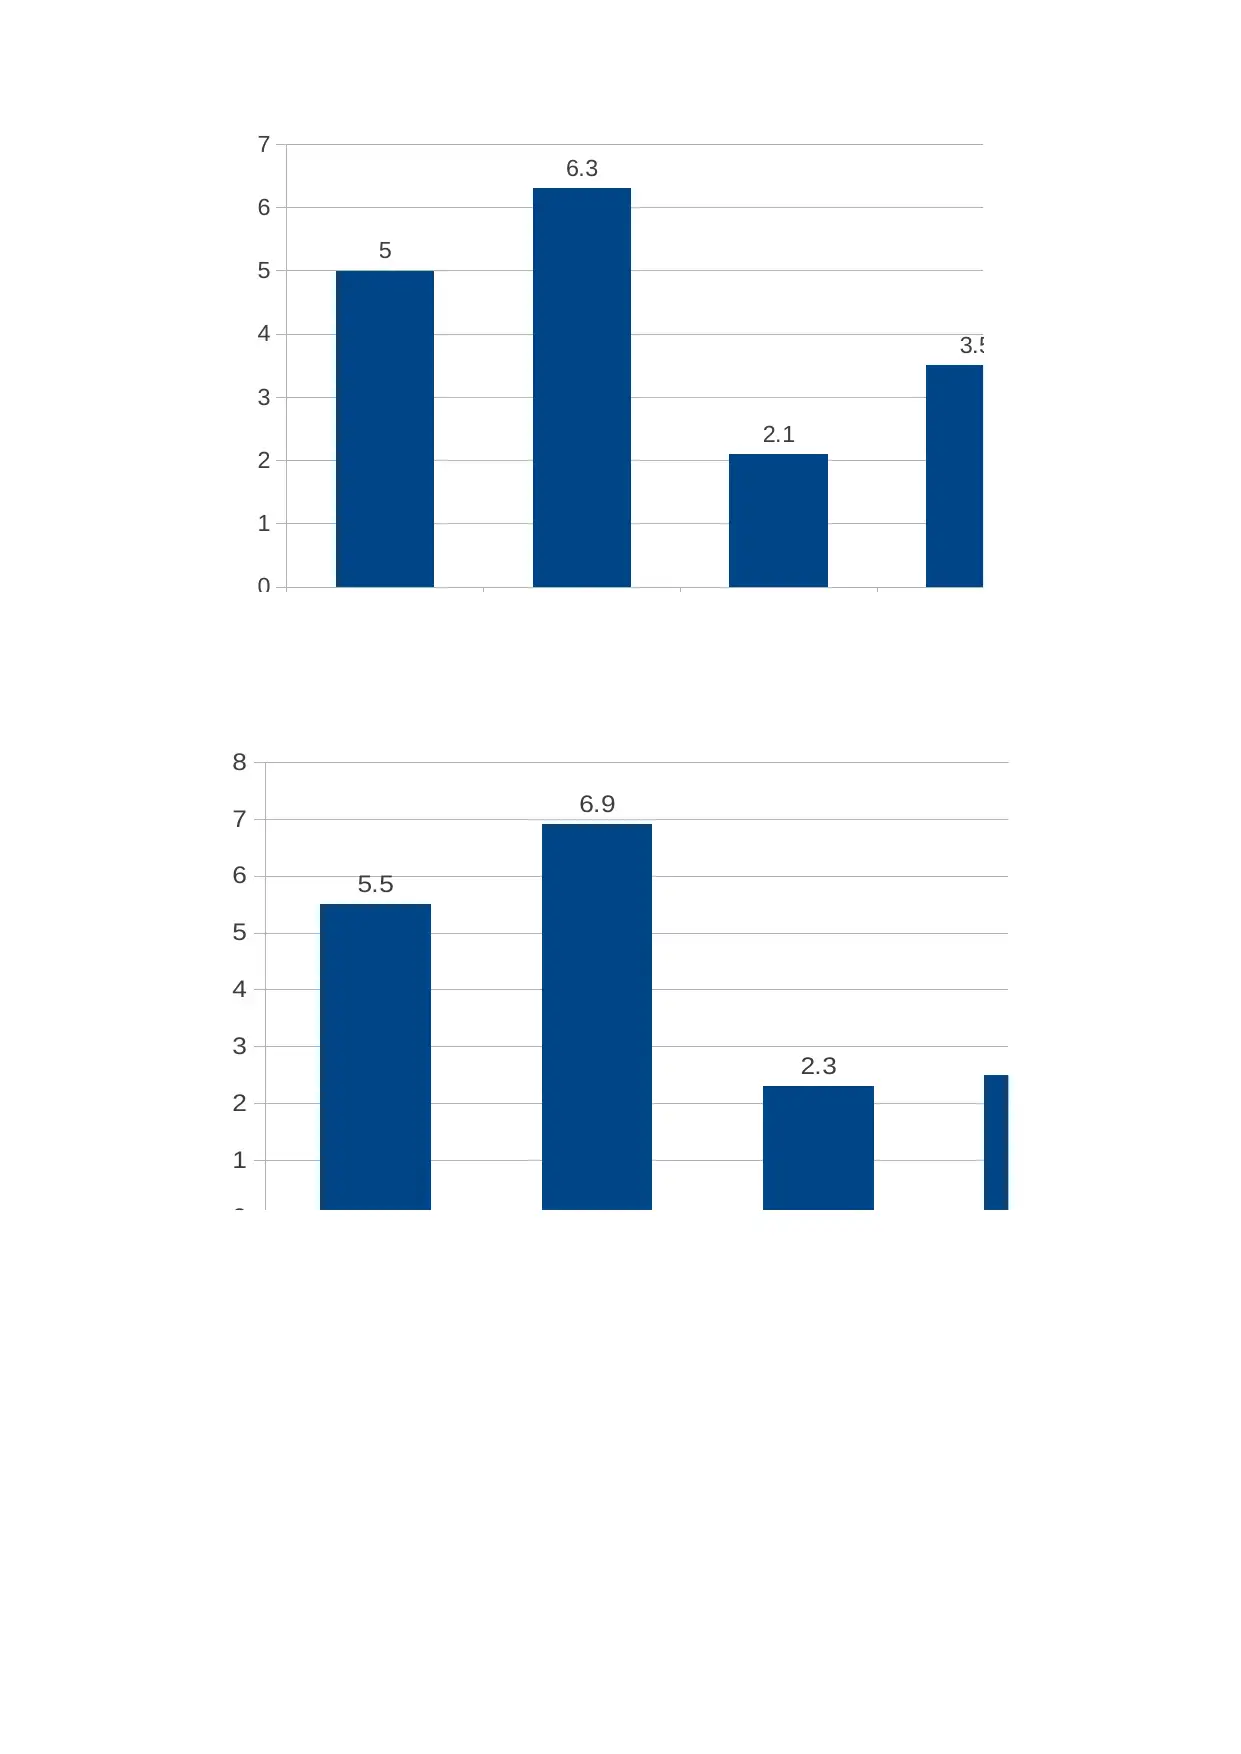
Item name 2014 2015 2016 2017
Beds 4 5 5.5 6.5
Sofas 6 6.3 6.9 7
Wardrobes 2 2.1 2.3 2.5
Dining
Tables 3 3.5 2.5 2
Total: (∑) 15 16.9 17.2 18
Preparation of charts:
Beds Sofas Wardrobes Dining Tables
0
1
2
3
4
5
6
7
4
6
2
3
Illustration 1: Sales for the year 2014
versa.
TASK 3
Item name 2014 2015 2016 2017
Beds 4 5 5.5 6.5
Sofas 6 6.3 6.9 7
Wardrobes 2 2.1 2.3 2.5
Dining
Tables 3 3.5 2.5 2
Total: (∑) 15 16.9 17.2 18
Preparation of charts:
Beds Sofas Wardrobes Dining Tables
0
1
2
3
4
5
6
7
4
6
2
3
Illustration 1: Sales for the year 2014
Beds Sofas Wardrobes Dining Tables
0
1
2
3
4
5
6
7
5
6.3
2.1
3.5
Beds Sofas Wardrobes Dining Tables
0
1
2
3
4
5
6
7
8
5.5
6.9
2.3 2.5
0
1
2
3
4
5
6
7
5
6.3
2.1
3.5
Beds Sofas Wardrobes Dining Tables
0
1
2
3
4
5
6
7
8
5.5
6.9
2.3 2.5
⊘ This is a preview!⊘
Do you want full access?
Subscribe today to unlock all pages.
Trusted by 1+ million students worldwide
1 out of 18