Marketing and Data Analytics: A Case Study of Marks and Spencer Group plc
Added on 2023-01-11
12 Pages3130 Words56 Views
Marketing and Data
Analytics
Analytics
Contents
INTRODUCTION...........................................................................................................................3
MAIN BODY...................................................................................................................................3
Overview of company............................................................................................................3
Financial performance............................................................................................................3
Assessment of marks and spencer risk...................................................................................8
Analyse the company’s competitive environment.................................................................9
Marketing strategy of M&S..................................................................................................10
CONCLUSION..............................................................................................................................10
REEFRENCES..............................................................................................................................12
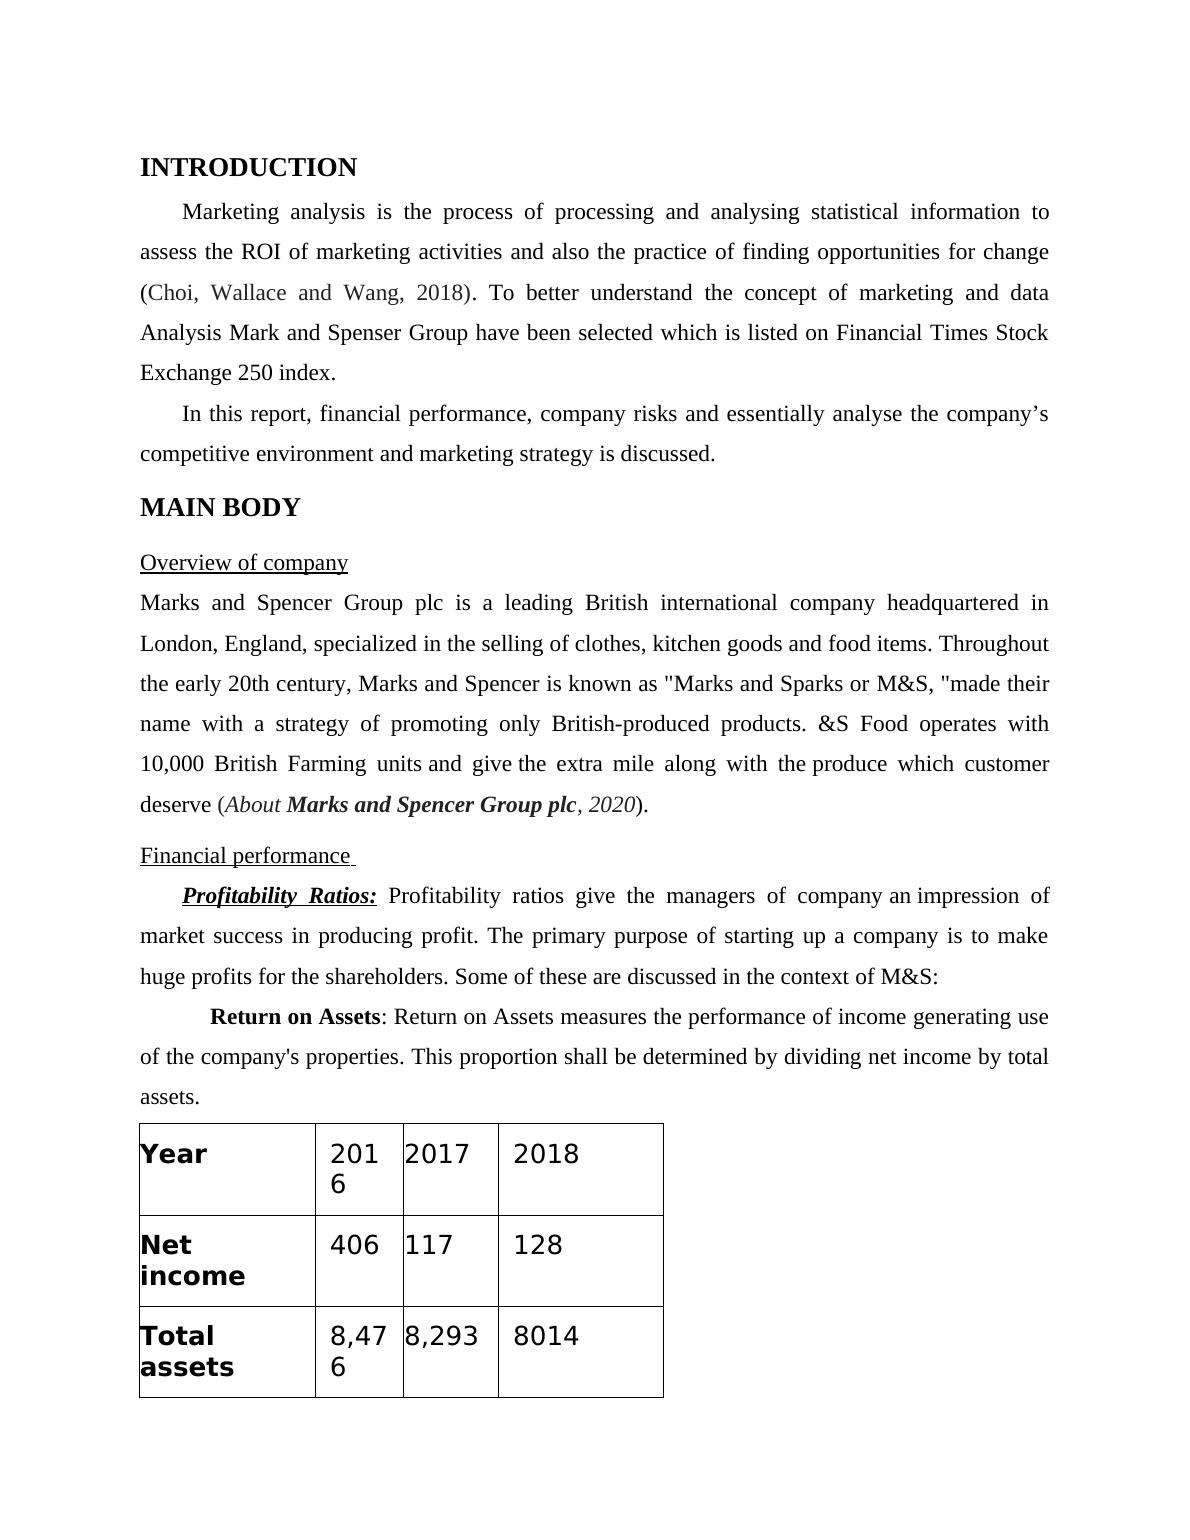
INTRODUCTION
Marketing analysis is the process of processing and analysing statistical information to
assess the ROI of marketing activities and also the practice of finding opportunities for change
(Choi, Wallace and Wang, 2018). To better understand the concept of marketing and data
Analysis Mark and Spenser Group have been selected which is listed on Financial Times Stock
Exchange 250 index.
In this report, financial performance, company risks and essentially analyse the company’s
competitive environment and marketing strategy is discussed.
MAIN BODY
Overview of company
Marks and Spencer Group plc is a leading British international company headquartered in
London, England, specialized in the selling of clothes, kitchen goods and food items. Throughout
the early 20th century, Marks and Spencer is known as "Marks and Sparks or M&S, "made their
name with a strategy of promoting only British-produced products. &S Food operates with
10,000 British Farming units and give the extra mile along with the produce which customer
deserve (About Marks and Spencer Group plc, 2020).
Financial performance
Profitability Ratios: Profitability ratios give the managers of company an impression of
market success in producing profit. The primary purpose of starting up a company is to make
huge profits for the shareholders. Some of these are discussed in the context of M&S:
Return on Assets: Return on Assets measures the performance of income generating use
of the company's properties. This proportion shall be determined by dividing net income by total
assets.
Year 201
6
2017 2018
Net
income
406 117 128
Total
assets
8,47
6
8,293 8014
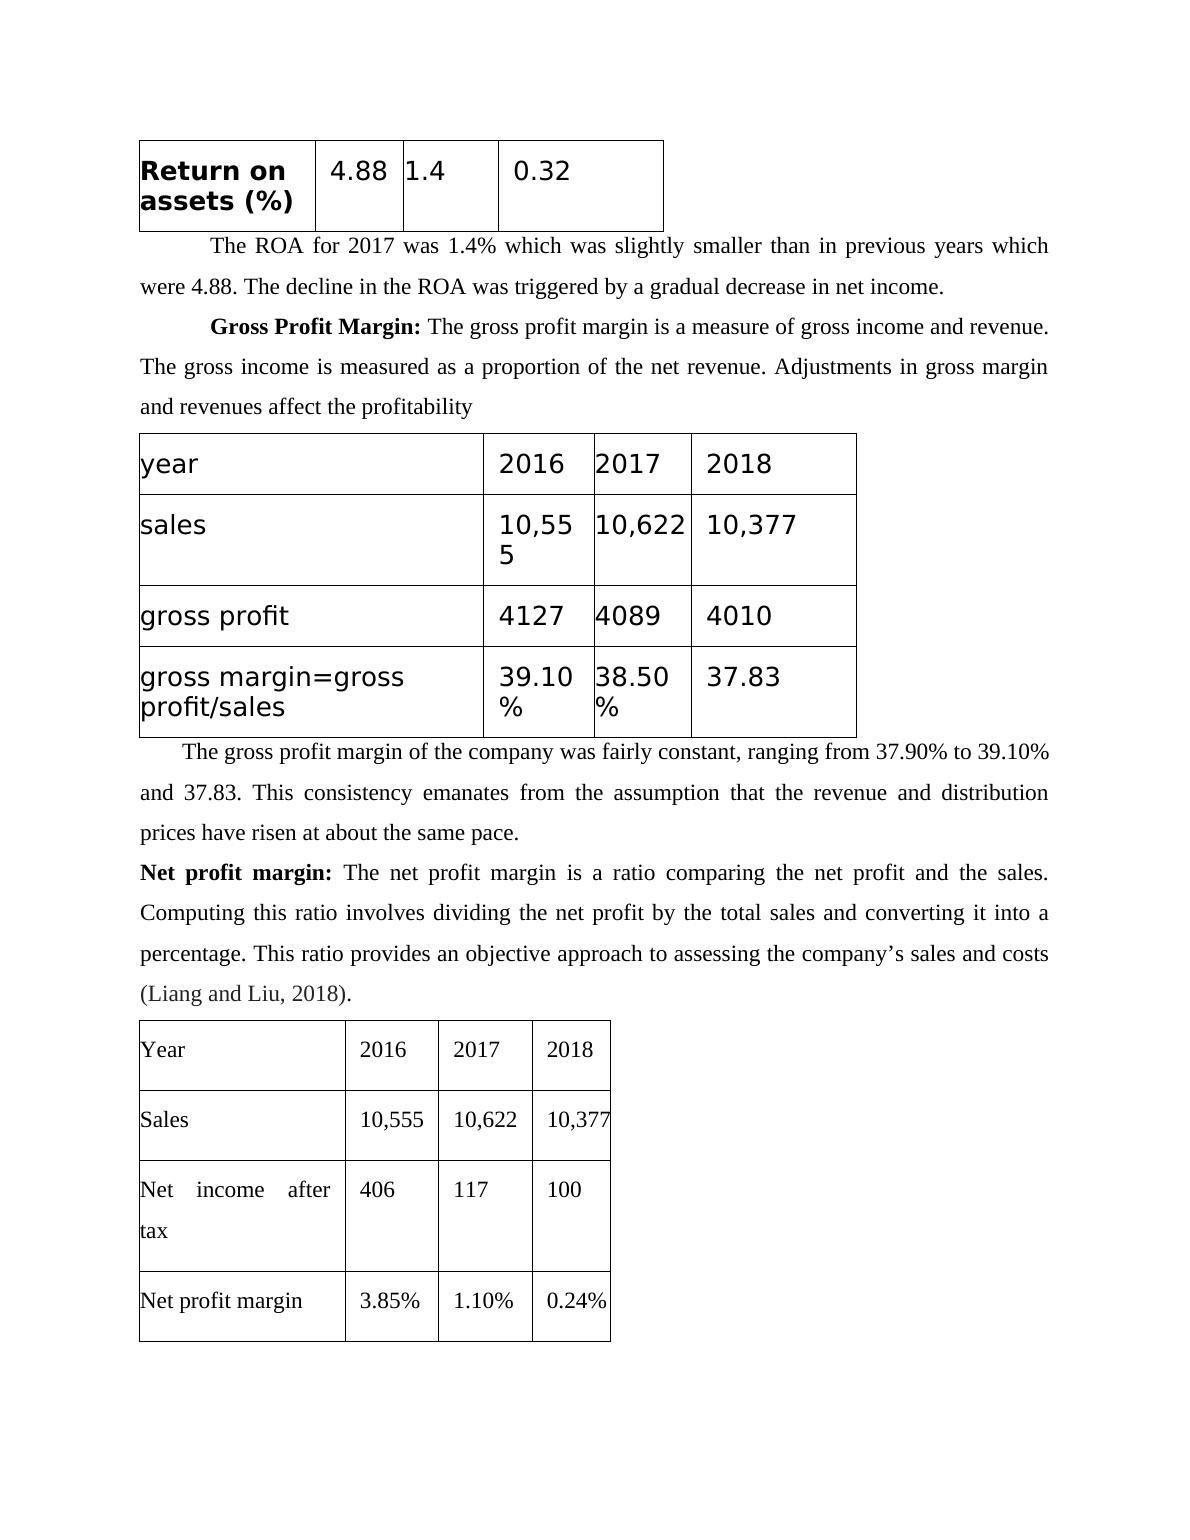
Return on
assets (%)
4.88 1.4 0.32
The ROA for 2017 was 1.4% which was slightly smaller than in previous years which
were 4.88. The decline in the ROA was triggered by a gradual decrease in net income.
Gross Profit Margin: The gross profit margin is a measure of gross income and revenue.
The gross income is measured as a proportion of the net revenue. Adjustments in gross margin
and revenues affect the profitability
year 2016 2017 2018
sales 10,55
5
10,622 10,377
gross profit 4127 4089 4010
gross margin=gross
profit/sales
39.10
%
38.50
%
37.83
The gross profit margin of the company was fairly constant, ranging from 37.90% to 39.10%
and 37.83. This consistency emanates from the assumption that the revenue and distribution
prices have risen at about the same pace.
Net profit margin: The net profit margin is a ratio comparing the net profit and the sales.
Computing this ratio involves dividing the net profit by the total sales and converting it into a
percentage. This ratio provides an objective approach to assessing the company’s sales and costs
(Liang and Liu, 2018).
Year 2016 2017 2018
Sales 10,555 10,622 10,377
Net income after
tax
406 117 100
Net profit margin 3.85% 1.10% 0.24%
End of preview
Want to access all the pages? Upload your documents or become a member.
Related Documents
Financial Analysis and Qualitative Factors of Marks & Spencer'slg...
|18
|3922
|53
Profit Margin Ratio Analysislg...
|4
|606
|15
Accounting for Managers Assignment - Doclg...
|19
|4190
|76
Ratio Analysis for Desklib: Profitability, Efficiency, and Liquidity Ratioslg...
|12
|2287
|407
Strategic Financial Management: Analysis of Marks & Spencer PLClg...
|14
|3324
|95
Business Research and Decision Making - Reportlg...
|9
|2237
|37