Marketing Research Report: Casino Gamer Satisfaction in Singapore
VerifiedAdded on 2022/10/11
|36
|7840
|20
Report
AI Summary
This marketing research report presents an analysis of customer satisfaction among casino gamers in Singapore, utilizing SPSS for data analysis. The study employed a survey technique with a quantitative approach, focusing on demographic data (Age, Gender, Education, Income, Marital Status) and their impact on behavioral intentions, customer satisfaction, perceived value, corporate image, and service quality. The research involved descriptive and inferential statistical analyses, including reliability and validity tests, to draw conclusions and recommendations. Key findings reveal significant differences across age groups, gender, education levels, income levels, and marital statuses concerning various factors. The report also considers the implications of these findings within both academic and managerial contexts, offering valuable insights for the casino industry in Singapore, particularly in light of increased gaming taxes and levies.
Marketing Research 2
Paraphrase This Document
Need a fresh take? Get an instant paraphrase of this document with our AI Paraphraser
Marketing Research 2
Executive Summary
This research report presents the results and findings from the SPSS analysis of casino gamers in
Singapore. The purpose of the report is evaluating the customer satisfaction for casino gamers in
Singapore. We applied the survey technique and the quantitative study approach through the
collection of quantitative data using interviews. The interview method being more preferable to
questionnaires due to accuracy and reduced chances of false information from participants. We
used a convenience sampling technique, which allowed for the achieving sample size numbers
without compromising on the randomness of the sampling process.
We then considered the main issues of importance concerning consumer satisfaction in casinos,
applied descriptive data analysis followed by inferential data analysis on the data collected from
the survey. In the descriptive analysis, we obtained the descriptive statistics of the demographic
data on Age, Gender, Educational Level, Income Level and Marital Status. We the evaluated
demographic data variables in the inferential analysis to establish whether there exist a difference
between their categories with respect to Behavioral Intensions, Customer Satisfaction, Perceived
Value, Corporate Image and Service Quality. Finally, we drew inferences, conclusions and
recommendations from the results of both the descriptive and inferential analyses.
We conclude that the Age groups are significantly different with respect to Behavioural
Intentions, Consumer Satisfaction, Corporate Image and Service Quality. However, for the
Perceived Value, we conclude that the Age groups are not significantly different with respect to
Perceived Value. We also conclude that the gender groups are significantly different with respect
to Behavioural Intentions, Perceived Value, Consumer Satisfaction, Corporate Image and
Service Quality. In addition, we conclude that the Educational Levels are significantly different
with respect to Behavioural Intentions, Perceived Value, Consumer Satisfaction, Corporate
Image and Service Quality. Similarly, we conclude that the Income Levels are significantly
different with respect to Behavioural Intentions, Perceived Value, Consumer Satisfaction,
Corporate Image and Service Quality. The same case applies for the Marital Status as well where
we conclude that the Marital Statuses are significantly different with respect to Behavioural
Intentions, Perceived Value, Consumer Satisfaction, Corporate Image and Service Quality. This
report also considers the implications of the findings in both academic and managerial contexts.
2
Marketing Research 2
Contents
Introduction......................................................................................................................................4
Literature Review............................................................................................................................5
Service Quality.............................................................................................................................5
Behavioural Intentions and Corporate Image..............................................................................5
Conceptual Framework and Hypothesis Development................................................................6
Method.............................................................................................................................................7
Research Content.........................................................................................................................7
Participants...................................................................................................................................8
Measures......................................................................................................................................9
Procedure...................................................................................................................................10
Results............................................................................................................................................11
Descriptive Statistics..................................................................................................................11
Inferential Statistics....................................................................................................................16
Reliability Test.......................................................................................................................16
Validity Test...........................................................................................................................17
Hypothesis Tests.....................................................................................................................18
Discussion......................................................................................................................................27
Conclusion.....................................................................................................................................28
References......................................................................................................................................29
3
⊘ This is a preview!⊘
Do you want full access?
Subscribe today to unlock all pages.
Trusted by 1+ million students worldwide
Marketing Research 2
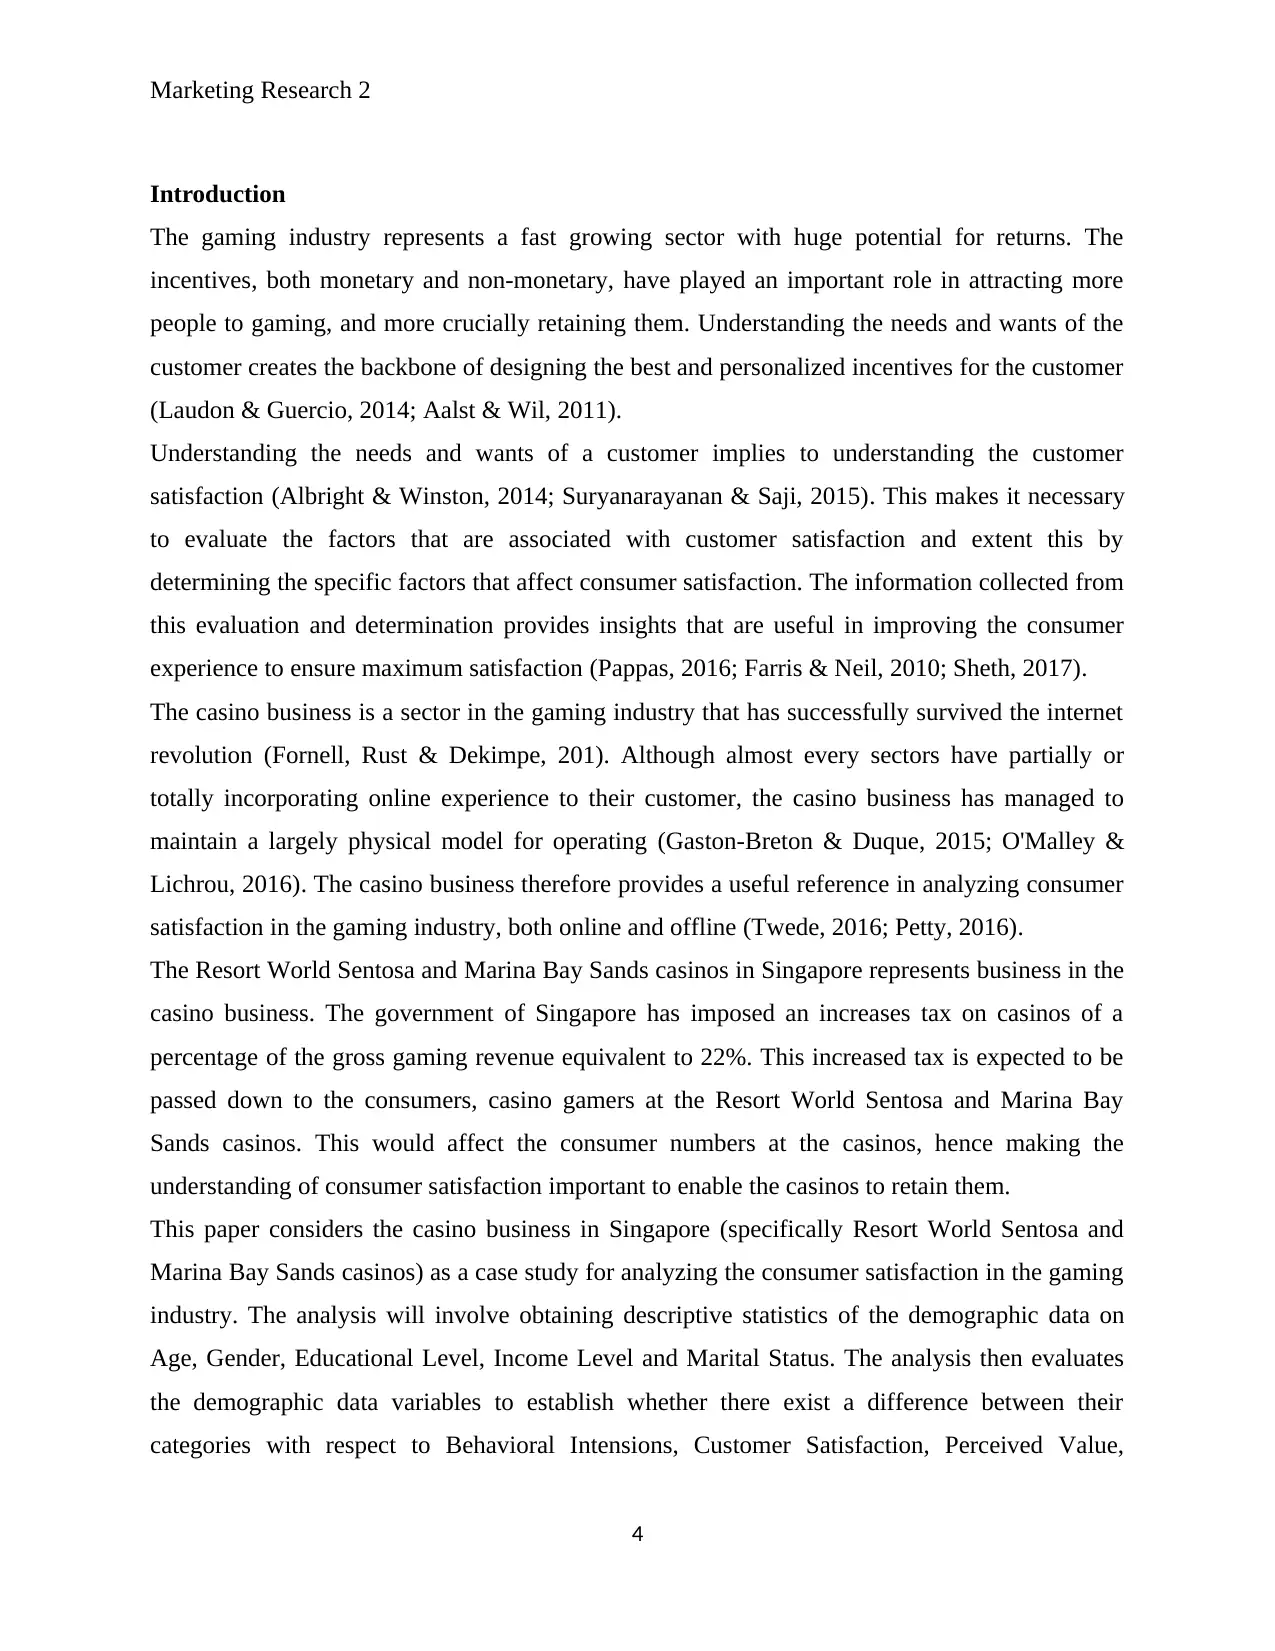
Introduction
The gaming industry represents a fast growing sector with huge potential for returns. The
incentives, both monetary and non-monetary, have played an important role in attracting more
people to gaming, and more crucially retaining them. Understanding the needs and wants of the
customer creates the backbone of designing the best and personalized incentives for the customer
(Laudon & Guercio, 2014; Aalst & Wil, 2011).
Understanding the needs and wants of a customer implies to understanding the customer
satisfaction (Albright & Winston, 2014; Suryanarayanan & Saji, 2015). This makes it necessary
to evaluate the factors that are associated with customer satisfaction and extent this by
determining the specific factors that affect consumer satisfaction. The information collected from
this evaluation and determination provides insights that are useful in improving the consumer
experience to ensure maximum satisfaction (Pappas, 2016; Farris & Neil, 2010; Sheth, 2017).
The casino business is a sector in the gaming industry that has successfully survived the internet
revolution (Fornell, Rust & Dekimpe, 201). Although almost every sectors have partially or
totally incorporating online experience to their customer, the casino business has managed to
maintain a largely physical model for operating (Gaston-Breton & Duque, 2015; O'Malley &
Lichrou, 2016). The casino business therefore provides a useful reference in analyzing consumer
satisfaction in the gaming industry, both online and offline (Twede, 2016; Petty, 2016).
The Resort World Sentosa and Marina Bay Sands casinos in Singapore represents business in the
casino business. The government of Singapore has imposed an increases tax on casinos of a
percentage of the gross gaming revenue equivalent to 22%. This increased tax is expected to be
passed down to the consumers, casino gamers at the Resort World Sentosa and Marina Bay
Sands casinos. This would affect the consumer numbers at the casinos, hence making the
understanding of consumer satisfaction important to enable the casinos to retain them.
This paper considers the casino business in Singapore (specifically Resort World Sentosa and
Marina Bay Sands casinos) as a case study for analyzing the consumer satisfaction in the gaming
industry. The analysis will involve obtaining descriptive statistics of the demographic data on
Age, Gender, Educational Level, Income Level and Marital Status. The analysis then evaluates
the demographic data variables to establish whether there exist a difference between their
categories with respect to Behavioral Intensions, Customer Satisfaction, Perceived Value,
4
Paraphrase This Document
Need a fresh take? Get an instant paraphrase of this document with our AI Paraphraser
Marketing Research 2
Corporate Image and Service Quality. Inferences will then be drawn and generalized for the case
of case of consumer satisfaction in casinos in Singapore.
Literature Review
Service Quality
The area of customer satisfaction among gamers in casinos has been research by several
researchers. Ipkin, Hoi-In & Mathew (2012) focuses on the service delivery of casino operations
in the city of Macau. The research considers the following aspects of service quality at casinos;
food service, service delivery, game service and service environment. The analysis applied by
Ipkin, Hoi-In & Mathew (2012) involved checking whether there exist any significance
difference in the gender of the gamer and the type of the gamer. The type of gamer in this
instance refers to either a hardcore gamer or a leisure gamer. Ipkin, Hoi-In & Mathew (2012)
finds that there exist significance difference on all the aspects of service quality with respect to
the type of gamer. The research also finds interaction in terms of gender and type of gamer
variables.
The research by Ki-Joon & Choong-Ki (2015) also focuses on the service quality of casino
operations in Korea. The analysis applied by Ki-Joon & Choong-Ki (2015) using impact
asymmetry analysis (IAA) and impact-range performance analysis (IRPA). Ki-Joon & Choong-
Ki (2015) is more interested in determining the accuracy of IAA and IRPA in prediction of
customer satisfaction from service quality metrics. The research finds that IAA and IRPA are
more accurate that IPA (importance–performance analysis).
Behavioural Intentions and Corporate Image
Heesup, JungHoon & Jinsoo (2016) applies structural modelling to a wider range of variables
beyond service quality and customer satisfaction considered in Ipkin, Hoi-In & Mathew (2012)
and Ki-Joon & Choong-Ki (2015). The research considers the following variables; revisits
intentions, customer satisfaction, social value and brand prestige for the case of casino gamers in
the United States of America. Heesup, JungHoon & Jinsoo (2016) finds that brand prestige
influences customer satisfaction, revisits intentions and social value positively. The research also
finds that social values influences revisits intentions and customer satisfaction positively.
5
Marketing Research 2
This research build on Ipkin, Hoi-In & Mathew (2012), Ki-Joon & Choong-Ki (2015) and
Heesup, JungHoon & Jinsoo (2016) by considering more variables. This study will consider Age,
Gender, Educational Level, Income Level, Marital Status, Behavioural Intentions, Customer
Satisfaction, Perceived Value, Corporate Image and Service Quality. This increase in number of
variables will enable the derivation of broader and more conclusive inferences.
Conceptual Framework and Hypothesis Development
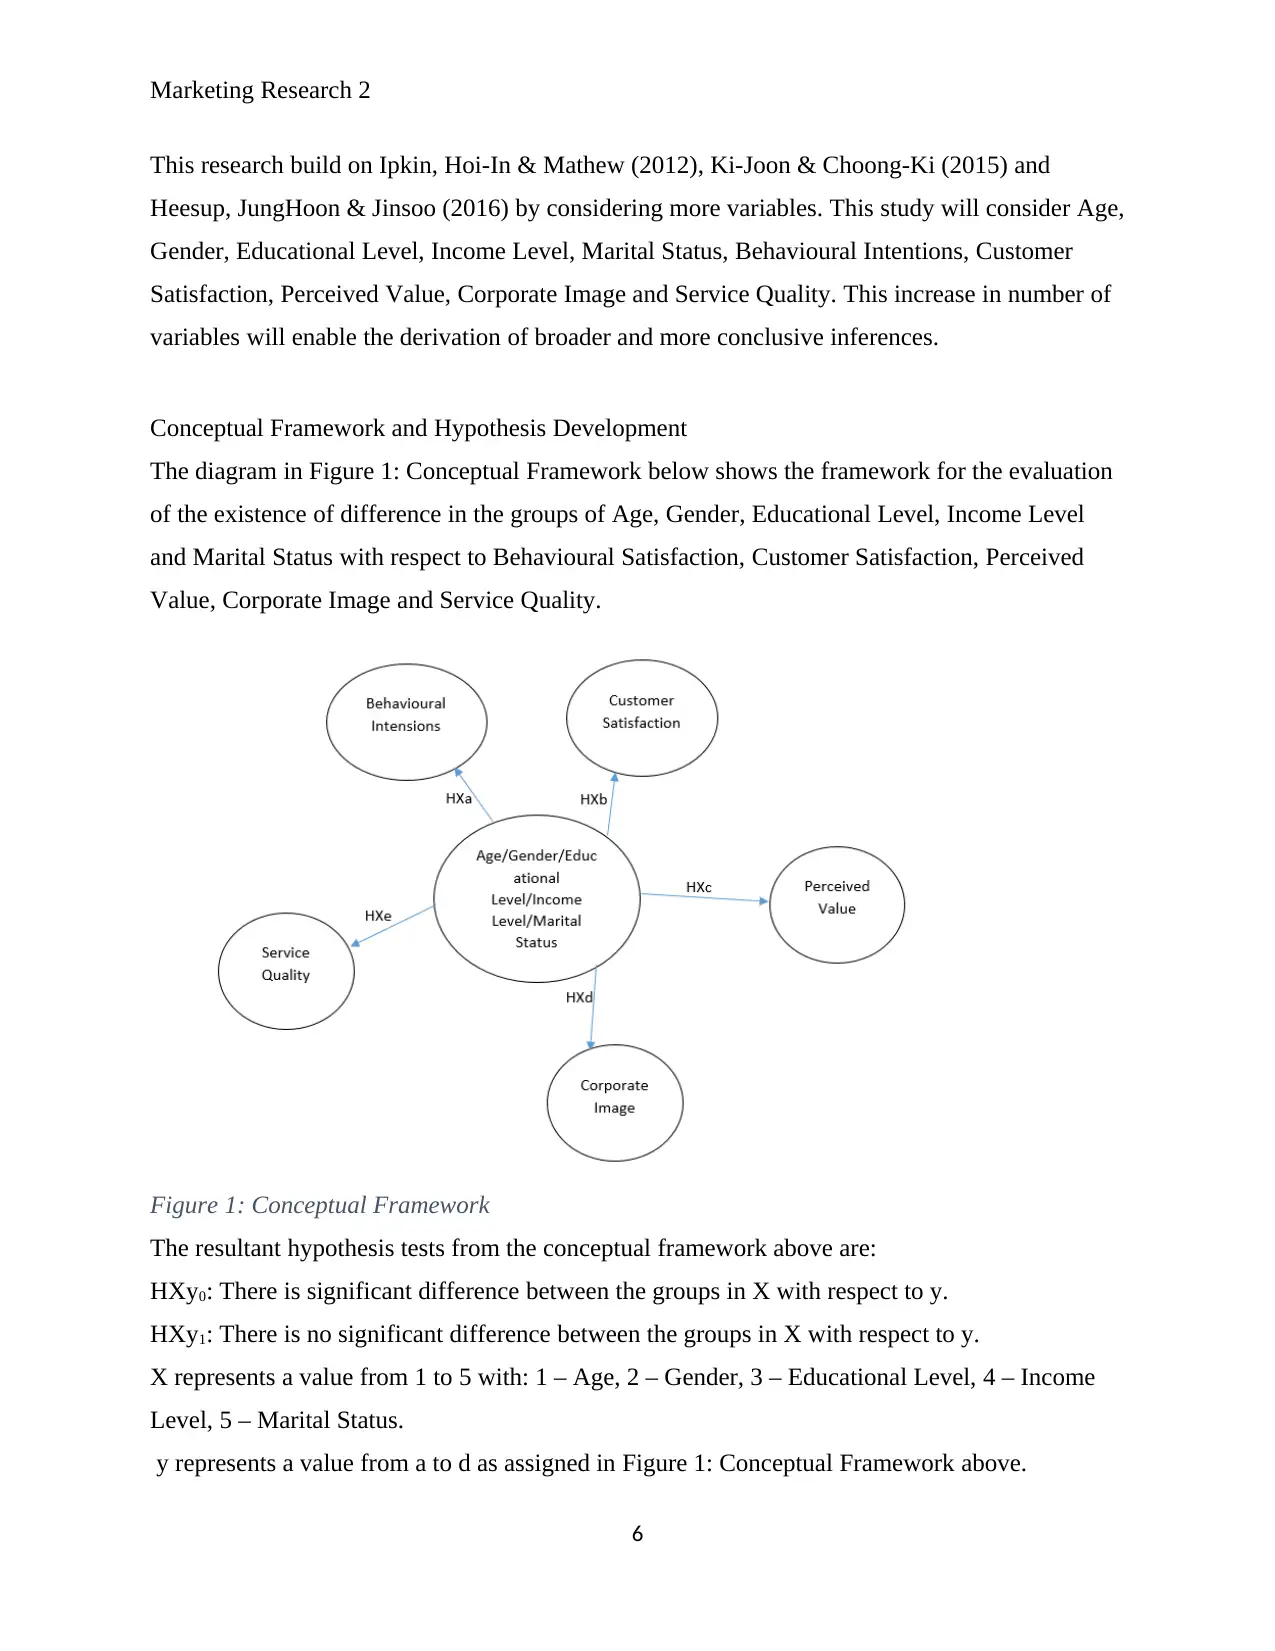
The diagram in Figure 1: Conceptual Framework below shows the framework for the evaluation
of the existence of difference in the groups of Age, Gender, Educational Level, Income Level
and Marital Status with respect to Behavioural Satisfaction, Customer Satisfaction, Perceived
Value, Corporate Image and Service Quality.
Figure 1: Conceptual Framework
The resultant hypothesis tests from the conceptual framework above are:
HXy0: There is significant difference between the groups in X with respect to y.
HXy1: There is no significant difference between the groups in X with respect to y.
X represents a value from 1 to 5 with: 1 – Age, 2 – Gender, 3 – Educational Level, 4 – Income
Level, 5 – Marital Status.
y represents a value from a to d as assigned in Figure 1: Conceptual Framework above.
6
This research build on Ipkin, Hoi-In & Mathew (2012), Ki-Joon & Choong-Ki (2015) and
Heesup, JungHoon & Jinsoo (2016) by considering more variables. This study will consider Age,
Gender, Educational Level, Income Level, Marital Status, Behavioural Intentions, Customer
Satisfaction, Perceived Value, Corporate Image and Service Quality. This increase in number of
variables will enable the derivation of broader and more conclusive inferences.
Conceptual Framework and Hypothesis Development
The diagram in Figure 1: Conceptual Framework below shows the framework for the evaluation
of the existence of difference in the groups of Age, Gender, Educational Level, Income Level
and Marital Status with respect to Behavioural Satisfaction, Customer Satisfaction, Perceived
Value, Corporate Image and Service Quality.
Figure 1: Conceptual Framework
The resultant hypothesis tests from the conceptual framework above are:
HXy0: There is significant difference between the groups in X with respect to y.
HXy1: There is no significant difference between the groups in X with respect to y.
X represents a value from 1 to 5 with: 1 – Age, 2 – Gender, 3 – Educational Level, 4 – Income
Level, 5 – Marital Status.
y represents a value from a to d as assigned in Figure 1: Conceptual Framework above.
6
⊘ This is a preview!⊘
Do you want full access?
Subscribe today to unlock all pages.
Trusted by 1+ million students worldwide
Marketing Research 2
Method
Research Content
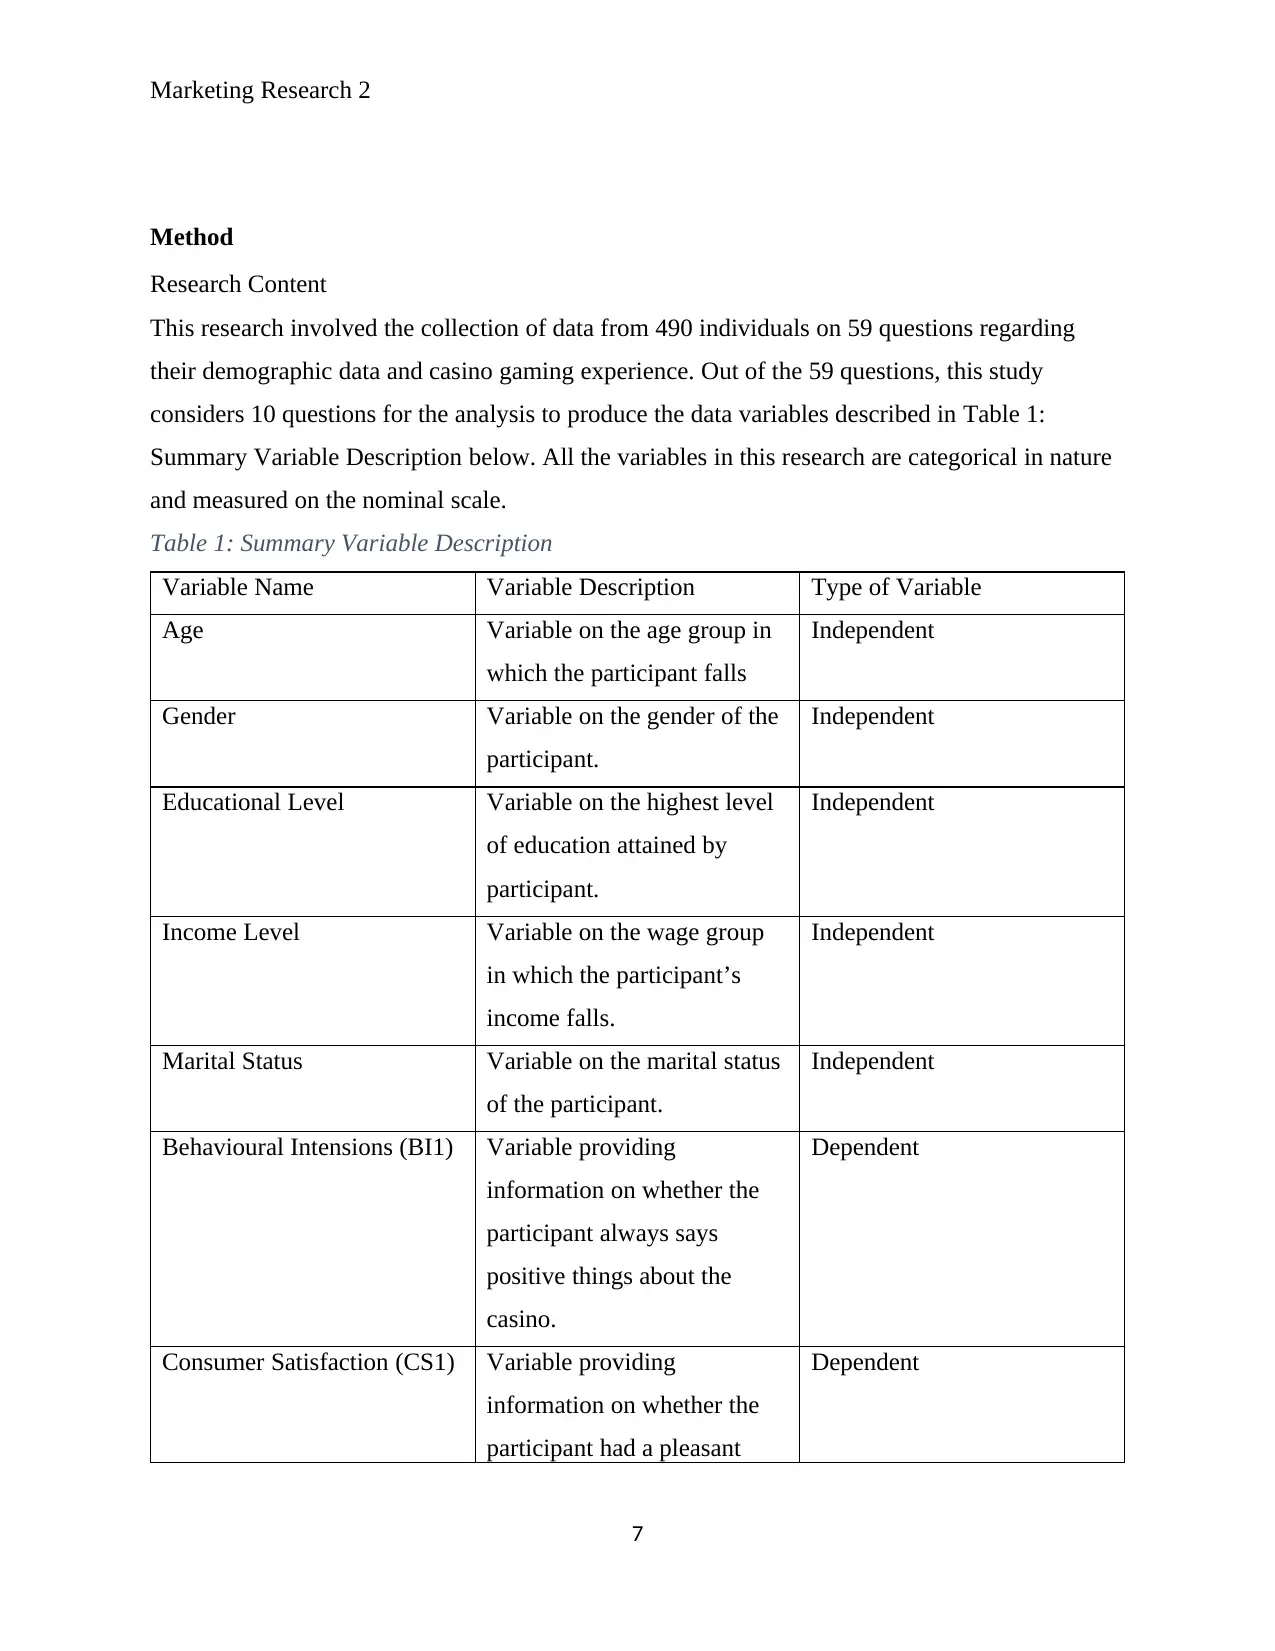
This research involved the collection of data from 490 individuals on 59 questions regarding
their demographic data and casino gaming experience. Out of the 59 questions, this study
considers 10 questions for the analysis to produce the data variables described in Table 1:
Summary Variable Description below. All the variables in this research are categorical in nature
and measured on the nominal scale.
Table 1: Summary Variable Description
Variable Name Variable Description Type of Variable
Age Variable on the age group in
which the participant falls
Independent
Gender Variable on the gender of the
participant.
Independent
Educational Level Variable on the highest level
of education attained by
participant.
Independent
Income Level Variable on the wage group
in which the participant’s
income falls.
Independent
Marital Status Variable on the marital status
of the participant.
Independent
Behavioural Intensions (BI1) Variable providing
information on whether the
participant always says
positive things about the
casino.
Dependent
Consumer Satisfaction (CS1) Variable providing
information on whether the
participant had a pleasant
Dependent
7
Method
Research Content
This research involved the collection of data from 490 individuals on 59 questions regarding
their demographic data and casino gaming experience. Out of the 59 questions, this study
considers 10 questions for the analysis to produce the data variables described in Table 1:
Summary Variable Description below. All the variables in this research are categorical in nature
and measured on the nominal scale.
Table 1: Summary Variable Description
Variable Name Variable Description Type of Variable
Age Variable on the age group in
which the participant falls
Independent
Gender Variable on the gender of the
participant.
Independent
Educational Level Variable on the highest level
of education attained by
participant.
Independent
Income Level Variable on the wage group
in which the participant’s
income falls.
Independent
Marital Status Variable on the marital status
of the participant.
Independent
Behavioural Intensions (BI1) Variable providing
information on whether the
participant always says
positive things about the
casino.
Dependent
Consumer Satisfaction (CS1) Variable providing
information on whether the
participant had a pleasant
Dependent
7
Paraphrase This Document
Need a fresh take? Get an instant paraphrase of this document with our AI Paraphraser
Marketing Research 2
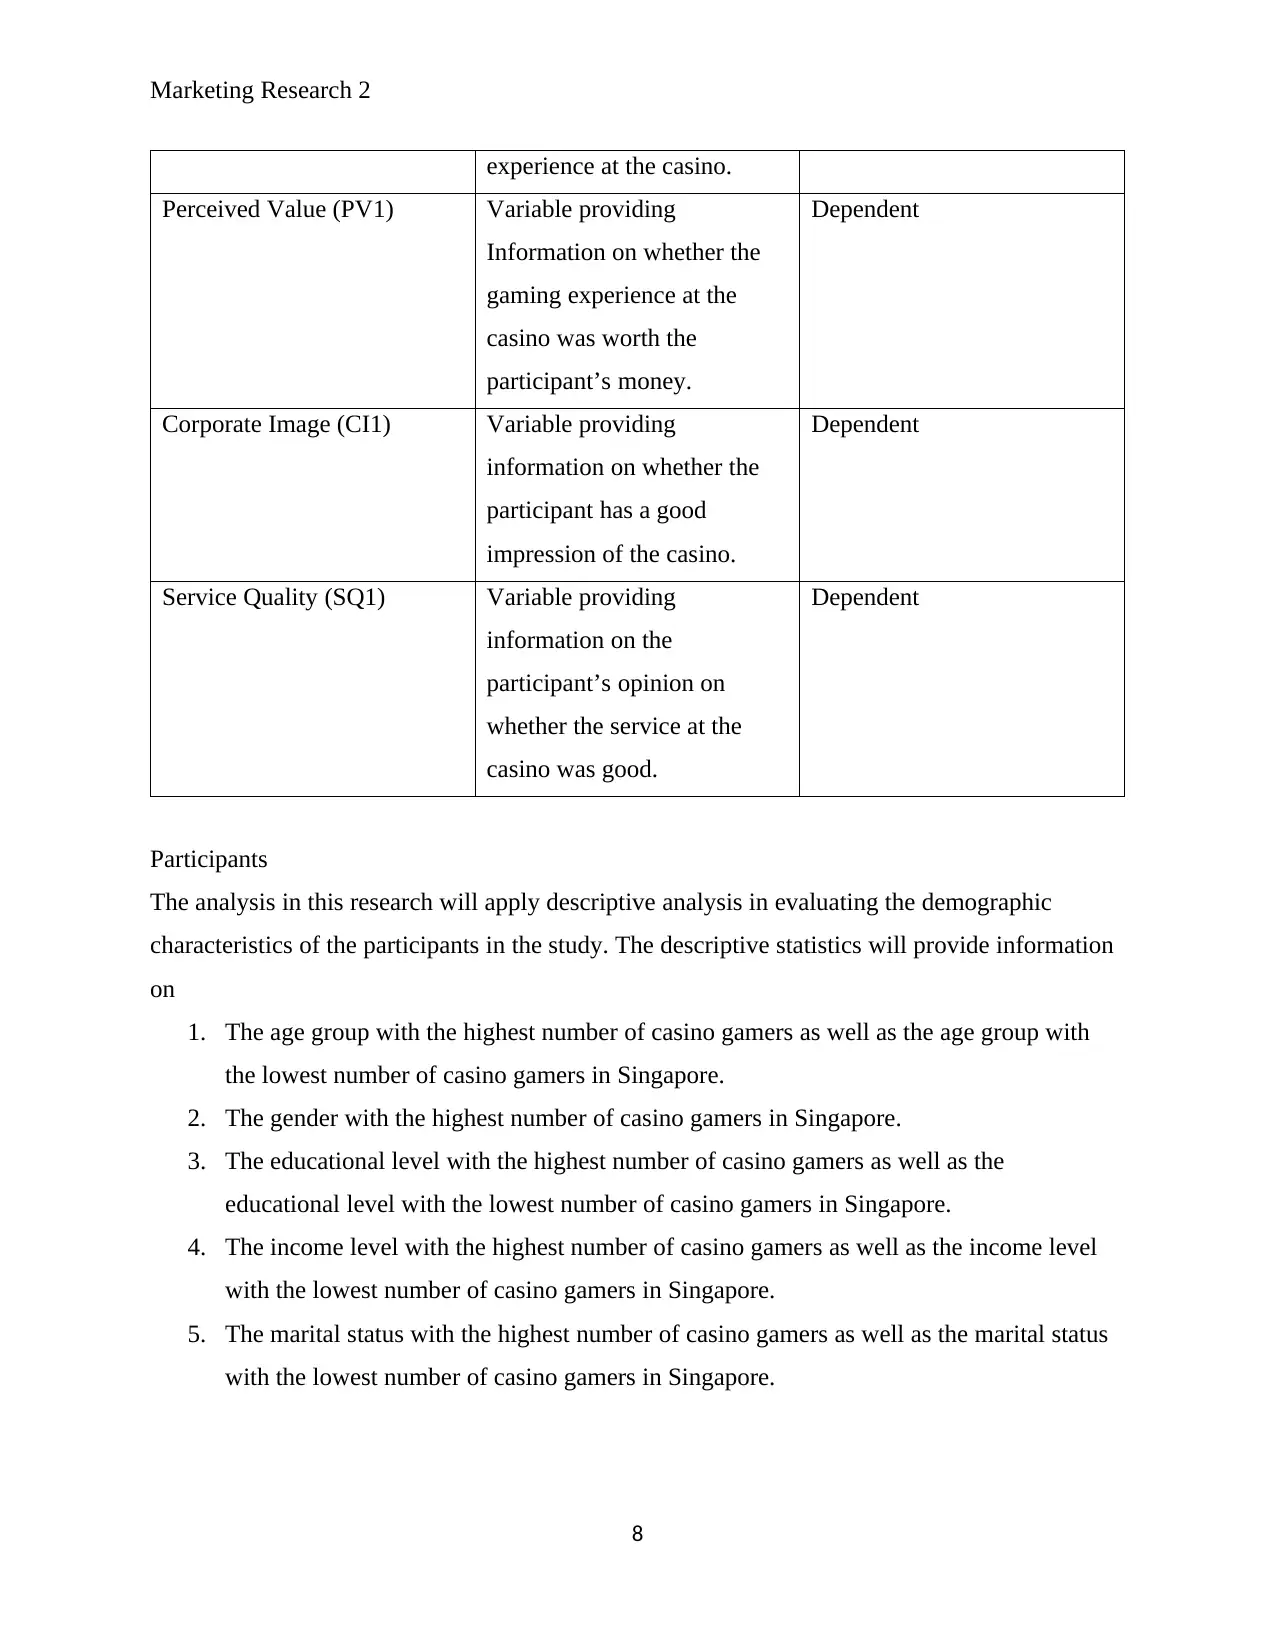
experience at the casino.
Perceived Value (PV1) Variable providing
Information on whether the
gaming experience at the
casino was worth the
participant’s money.
Dependent
Corporate Image (CI1) Variable providing
information on whether the
participant has a good
impression of the casino.
Dependent
Service Quality (SQ1) Variable providing
information on the
participant’s opinion on
whether the service at the
casino was good.
Dependent
Participants
The analysis in this research will apply descriptive analysis in evaluating the demographic
characteristics of the participants in the study. The descriptive statistics will provide information
on
1. The age group with the highest number of casino gamers as well as the age group with
the lowest number of casino gamers in Singapore.
2. The gender with the highest number of casino gamers in Singapore.
3. The educational level with the highest number of casino gamers as well as the
educational level with the lowest number of casino gamers in Singapore.
4. The income level with the highest number of casino gamers as well as the income level
with the lowest number of casino gamers in Singapore.
5. The marital status with the highest number of casino gamers as well as the marital status
with the lowest number of casino gamers in Singapore.
8
Marketing Research 2
Measures
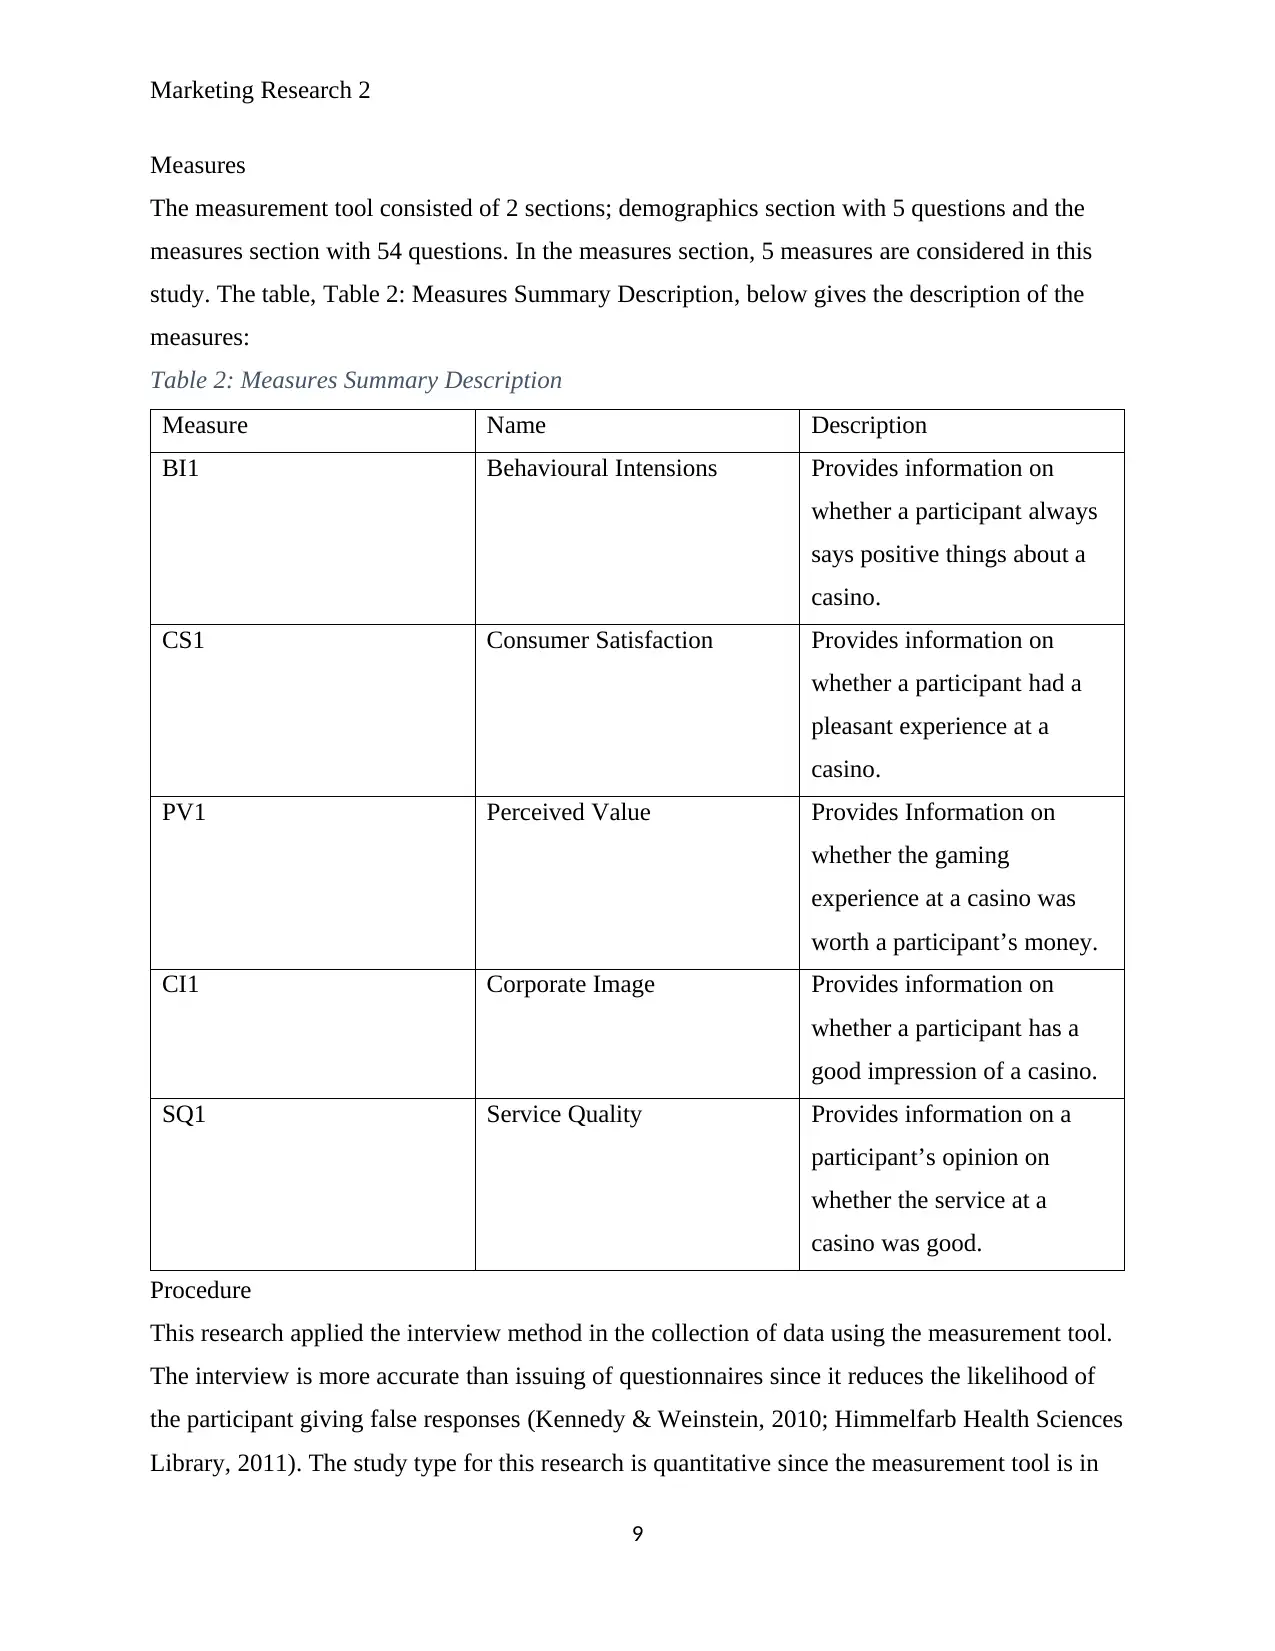
The measurement tool consisted of 2 sections; demographics section with 5 questions and the
measures section with 54 questions. In the measures section, 5 measures are considered in this
study. The table, Table 2: Measures Summary Description, below gives the description of the
measures:
Table 2: Measures Summary Description
Measure Name Description
BI1 Behavioural Intensions Provides information on
whether a participant always
says positive things about a
casino.
CS1 Consumer Satisfaction Provides information on
whether a participant had a
pleasant experience at a
casino.
PV1 Perceived Value Provides Information on
whether the gaming
experience at a casino was
worth a participant’s money.
CI1 Corporate Image Provides information on
whether a participant has a
good impression of a casino.
SQ1 Service Quality Provides information on a
participant’s opinion on
whether the service at a
casino was good.
Procedure
This research applied the interview method in the collection of data using the measurement tool.
The interview is more accurate than issuing of questionnaires since it reduces the likelihood of
the participant giving false responses (Kennedy & Weinstein, 2010; Himmelfarb Health Sciences
Library, 2011). The study type for this research is quantitative since the measurement tool is in
9
Measures
The measurement tool consisted of 2 sections; demographics section with 5 questions and the
measures section with 54 questions. In the measures section, 5 measures are considered in this
study. The table, Table 2: Measures Summary Description, below gives the description of the
measures:
Table 2: Measures Summary Description
Measure Name Description
BI1 Behavioural Intensions Provides information on
whether a participant always
says positive things about a
casino.
CS1 Consumer Satisfaction Provides information on
whether a participant had a
pleasant experience at a
casino.
PV1 Perceived Value Provides Information on
whether the gaming
experience at a casino was
worth a participant’s money.
CI1 Corporate Image Provides information on
whether a participant has a
good impression of a casino.
SQ1 Service Quality Provides information on a
participant’s opinion on
whether the service at a
casino was good.
Procedure
This research applied the interview method in the collection of data using the measurement tool.
The interview is more accurate than issuing of questionnaires since it reduces the likelihood of
the participant giving false responses (Kennedy & Weinstein, 2010; Himmelfarb Health Sciences
Library, 2011). The study type for this research is quantitative since the measurement tool is in
9
⊘ This is a preview!⊘
Do you want full access?
Subscribe today to unlock all pages.
Trusted by 1+ million students worldwide
Marketing Research 2
such a way that the data records are in numeric form. Quantitative study types are study types
that record data in numeric or integer form (Brians, 2011; Bernard, 2012).
The research applied the convenience sampling technique. Convenience sampling technique is a
sampling method in which involves data collection from participants that are available at the
time of data collection (Creswell, 2014; Punch, 2013). Convenience sampling has a degree of
randomness since no predefined preference are considered (Ahmed, 2009; Lance & A, 2016).
The study will apply the reliability test, correlation analysis and chi square tests. The reliability
test evaluates the reliability of the measures in the measurement tool in this study. Reliability
refers to the ability of a measure to produce same outcomes when used repeatedly for the same
sample (Chakrabartty, 2013). The statistic for the reliability test is the Cronbach’s Alpha value
(Freedman, 2009). If the Cronbach’s Alpha value exceeds 0.6, then the measure is reliable
(Barbara & Susan, 2014; Witten, 2011).
Correlation analysis evaluates the validity of the measures in the measurement tool in this study.
Validity refers to the ability of a measure to be representative of the aspect it is intended to
measure (Mohajan, 2017). Correlation analysis is an analysis that checks on the level and type of
association that exists between two given variables (Everitt & Skrondal, 2010; Howitt & Cramer,
2010). If the p-value of the correlation analysis of the score total of a measure is less than the
significance level (0.05 is the standard), then the measure is valid (Kirk, 2016).
The Chi-square test evaluates the hypothesis tests in the conceptual framework in this study
shown in Figure 1: Conceptual Framework above. The chi-square test is a test that is applied for
instances when both the dependent and the independent variables are categorical in nature
(Vicenc, 2017; Neil, 2016). The interest in application of the Chi-square is in determining
whether there exist a difference between the groups of the independent variable with respect to
the dependent variable (O'Neil & Schutt, 2013). If the p-value of the chi-square test is less than
the significance level (0.05 is the standard), then we reject the null hypothesis and conclude that
there is no significant difference between the groups of the independent variable with respect to
the dependent variable (Oscar, 2009; Han & Jaiwei, 2011).
Results
10
Paraphrase This Document
Need a fresh take? Get an instant paraphrase of this document with our AI Paraphraser
Marketing Research 2
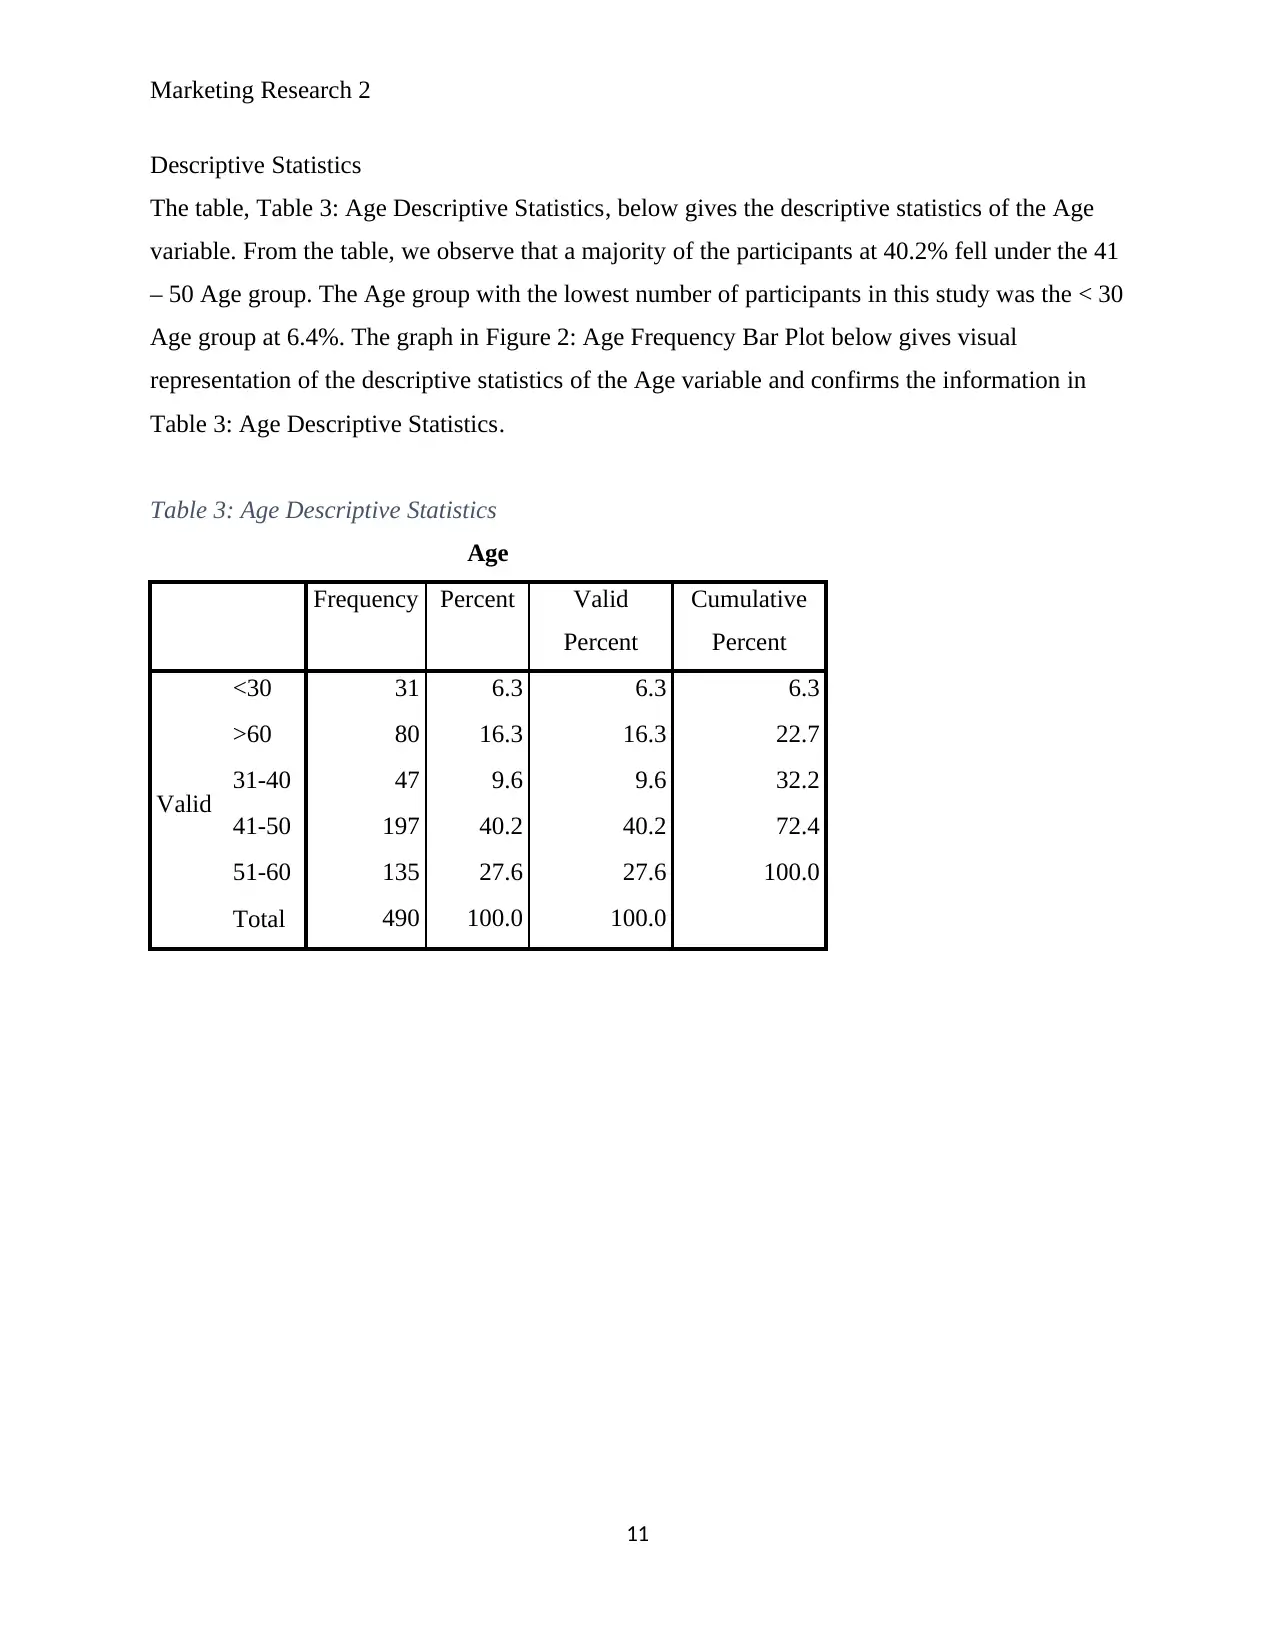
Descriptive Statistics
The table, Table 3: Age Descriptive Statistics, below gives the descriptive statistics of the Age
variable. From the table, we observe that a majority of the participants at 40.2% fell under the 41
– 50 Age group. The Age group with the lowest number of participants in this study was the < 30
Age group at 6.4%. The graph in Figure 2: Age Frequency Bar Plot below gives visual
representation of the descriptive statistics of the Age variable and confirms the information in
Table 3: Age Descriptive Statistics.
Table 3: Age Descriptive Statistics
Age
Frequency Percent Valid
Percent
Cumulative
Percent
Valid
<30 31 6.3 6.3 6.3
>60 80 16.3 16.3 22.7
31-40 47 9.6 9.6 32.2
41-50 197 40.2 40.2 72.4
51-60 135 27.6 27.6 100.0
Total 490 100.0 100.0
11
Marketing Research 2
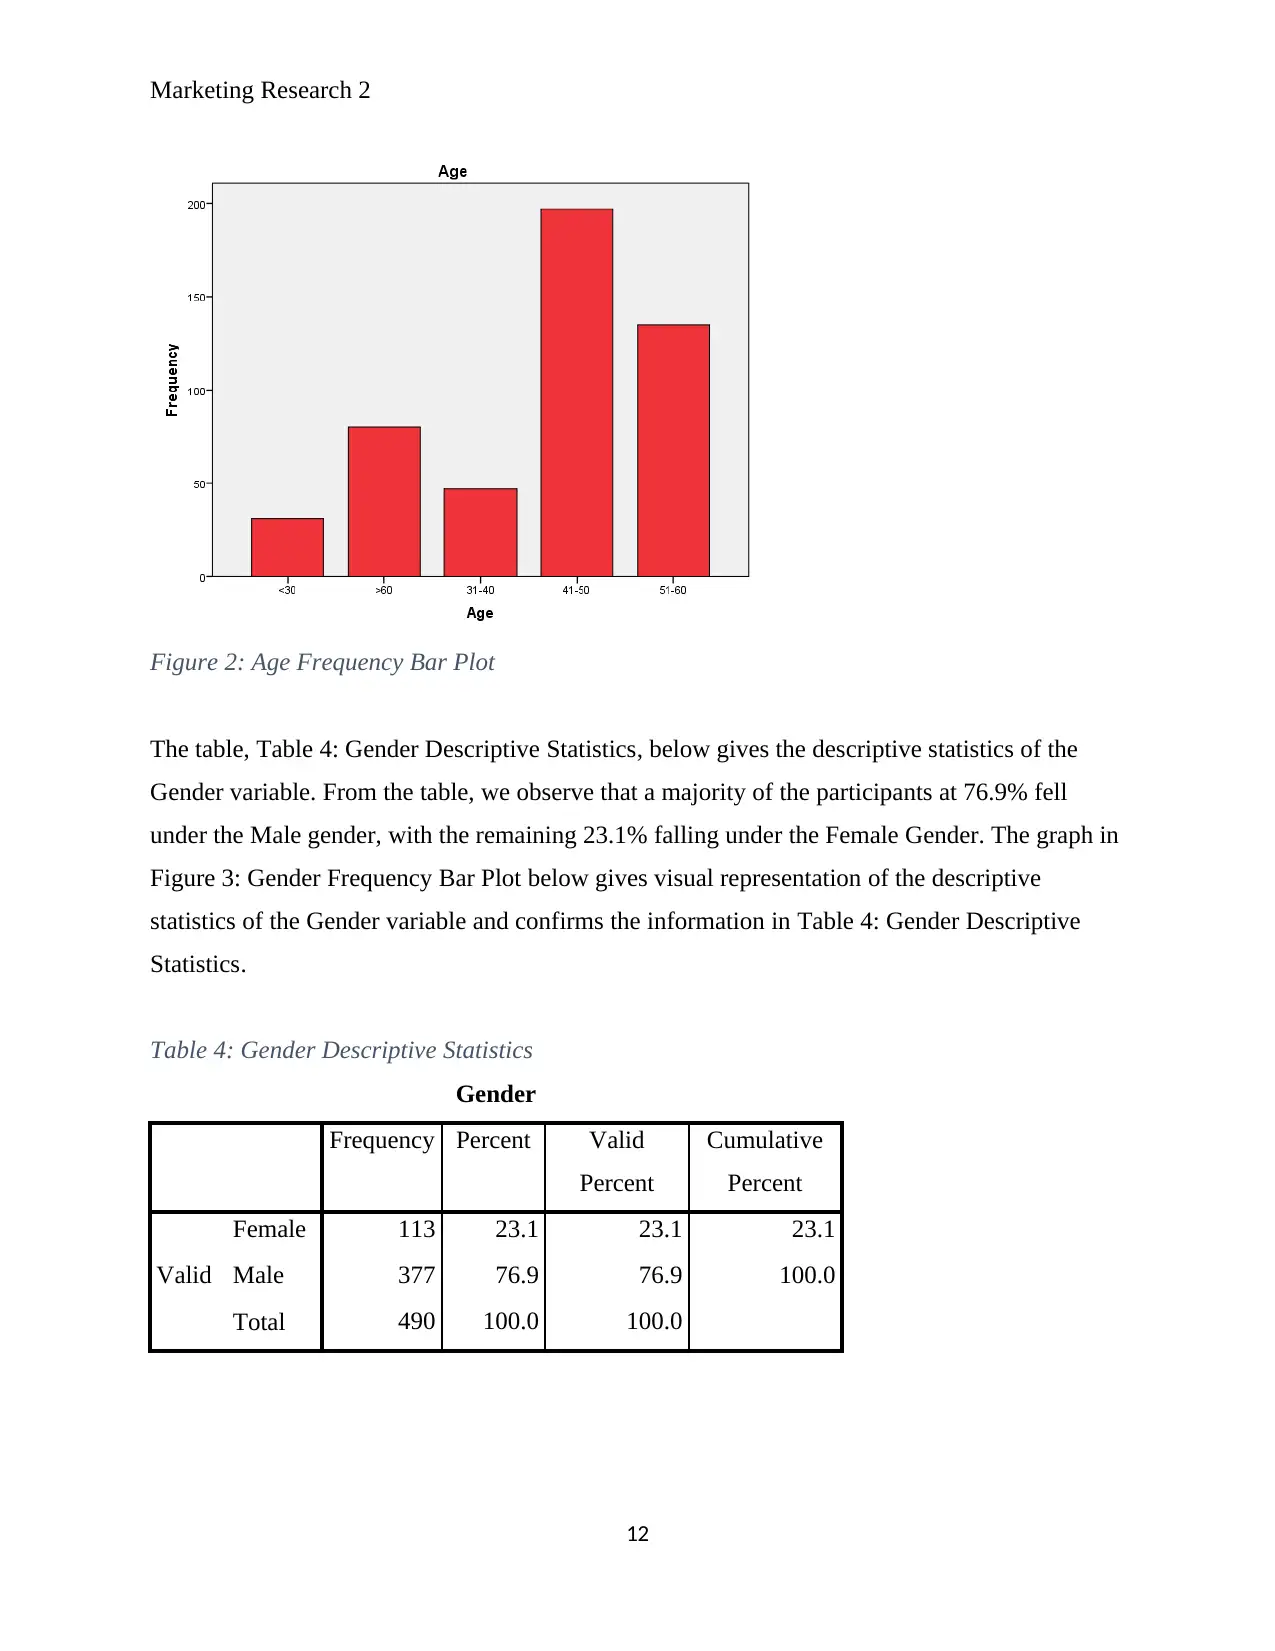
Figure 2: Age Frequency Bar Plot
The table, Table 4: Gender Descriptive Statistics, below gives the descriptive statistics of the
Gender variable. From the table, we observe that a majority of the participants at 76.9% fell
under the Male gender, with the remaining 23.1% falling under the Female Gender. The graph in
Figure 3: Gender Frequency Bar Plot below gives visual representation of the descriptive
statistics of the Gender variable and confirms the information in Table 4: Gender Descriptive
Statistics.
Table 4: Gender Descriptive Statistics
Gender
Frequency Percent Valid
Percent
Cumulative
Percent
Valid
Female 113 23.1 23.1 23.1
Male 377 76.9 76.9 100.0
Total 490 100.0 100.0
12
⊘ This is a preview!⊘
Do you want full access?
Subscribe today to unlock all pages.
Trusted by 1+ million students worldwide
1 out of 36
Related Documents


Your All-in-One AI-Powered Toolkit for Academic Success.
+13062052269
info@desklib.com
Available 24*7 on WhatsApp / Email
![[object Object]](/_next/static/media/star-bottom.7253800d.svg)
Unlock your academic potential
Copyright © 2020–2026 A2Z Services. All Rights Reserved. Developed and managed by ZUCOL.