MAT3000 Statistics Homework: Soda Bottle Weight Analysis & Testing
VerifiedAdded on 2021/04/17
|7
|763
|148
Homework Assignment
AI Summary
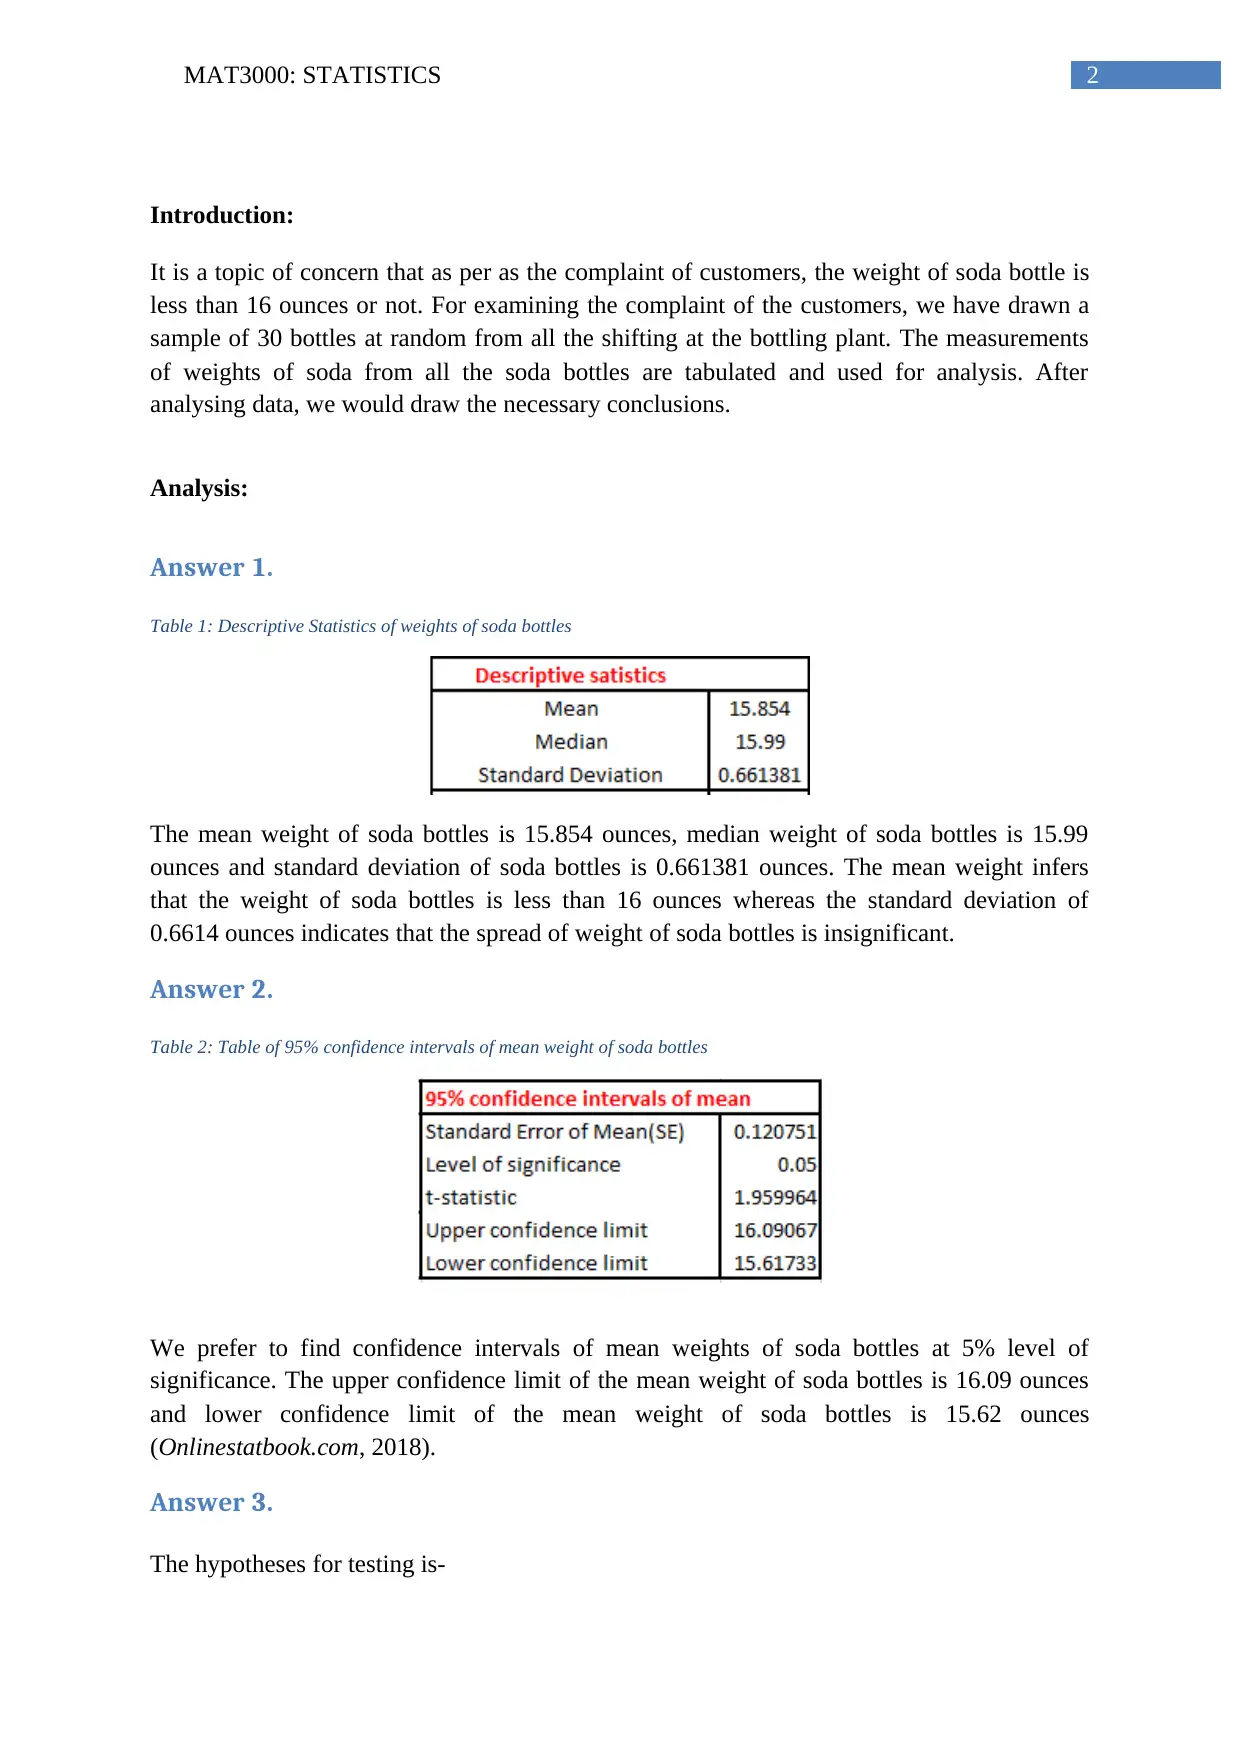
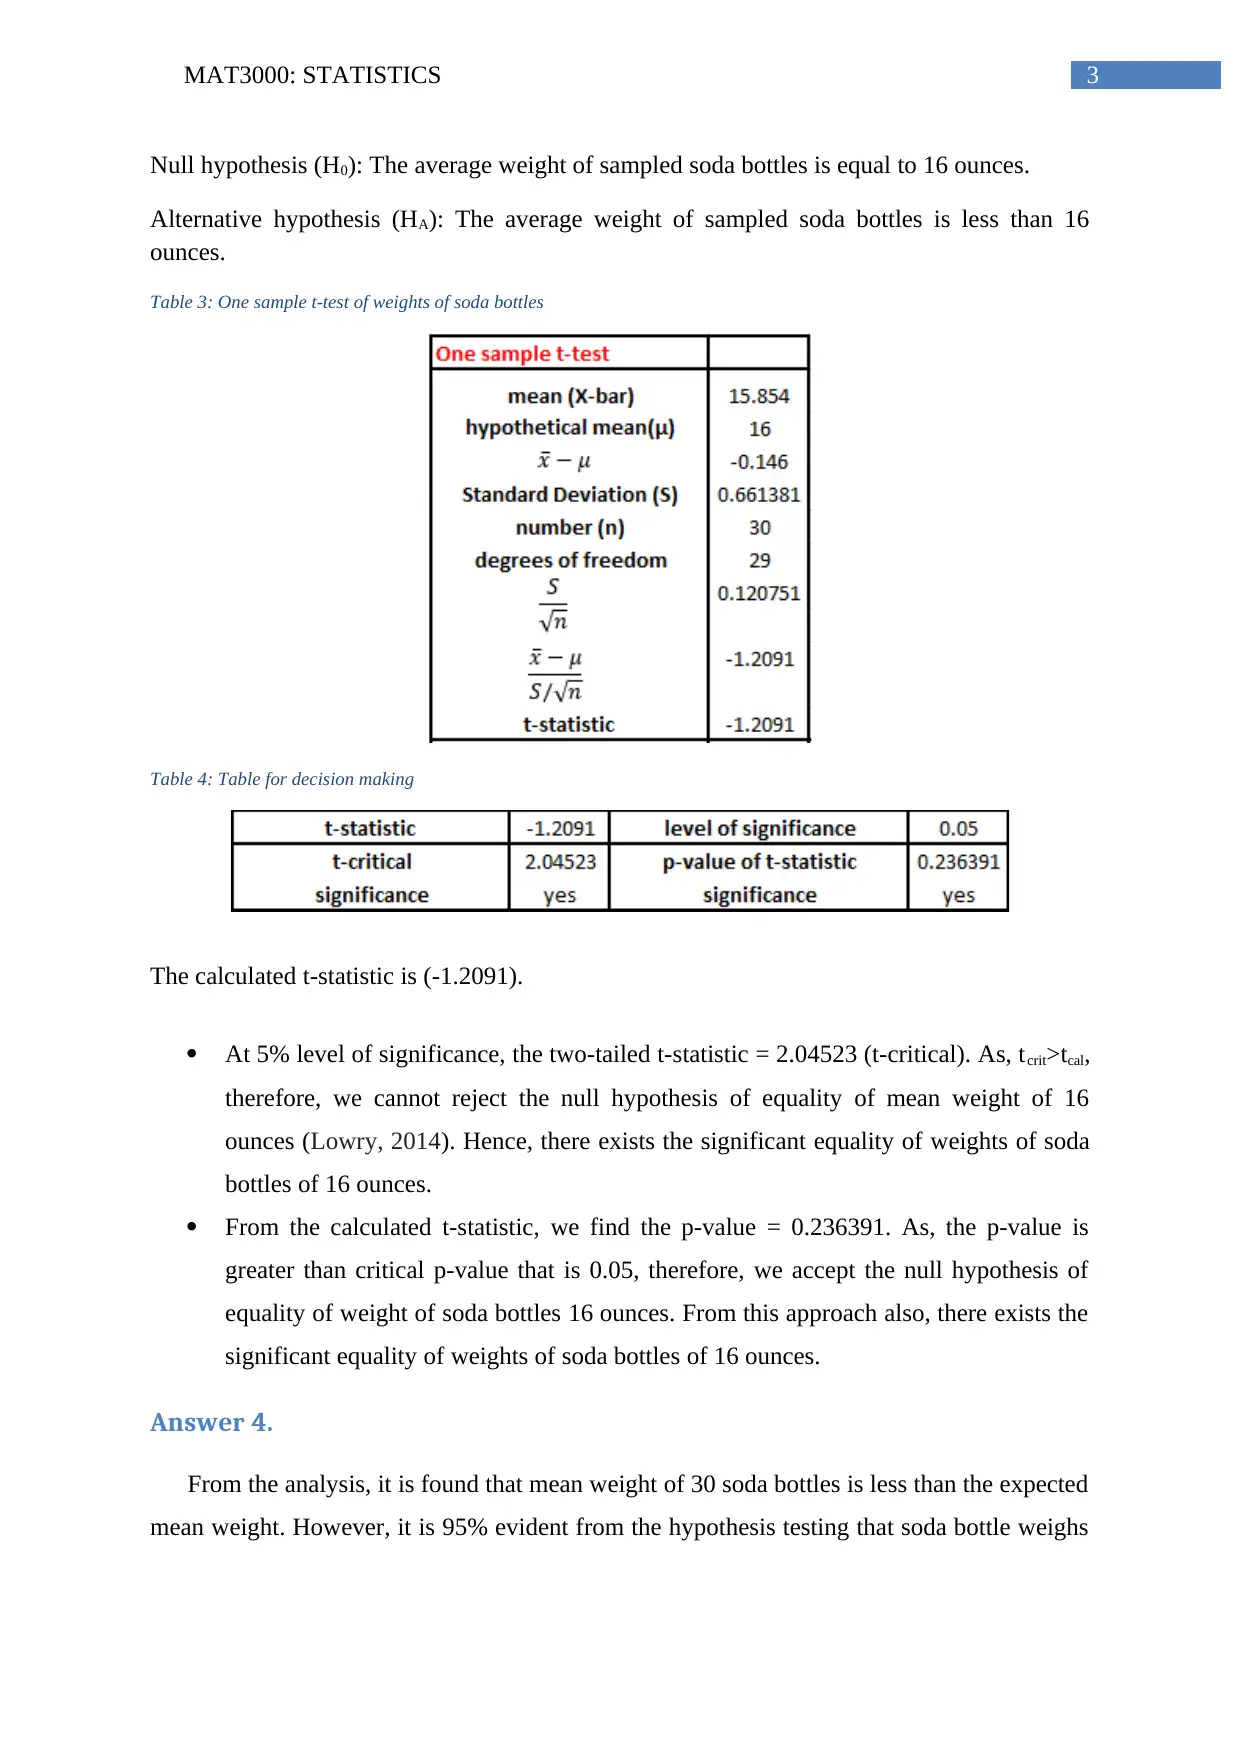
This statistics assignment, focusing on MAT3000, examines customer complaints regarding soda bottle weights. The student analyzed a sample of 30 soda bottles, calculating descriptive statistics such as mean and standard deviation, and constructed a 95% confidence interval for the mean weight. Hypothesis testing was performed to determine if the average weight of the bottles was equal to 16 ounces, using a one-sample t-test. The analysis revealed that although the sample mean was less than 16 ounces, the null hypothesis could not be rejected, indicating that the claim of underweight bottles was not strongly supported. Recommendations were made to reduce variability in the bottling process, including addressing assignable causes, correcting machine errors, and retesting material quality to ensure customer satisfaction and maintain the company's reputation. The assignment includes tables of statistical data, the t-test results, and references to relevant statistical resources.
1 out of 7
Related Documents


Your All-in-One AI-Powered Toolkit for Academic Success.
+13062052269
info@desklib.com
Available 24*7 on WhatsApp / Email
![[object Object]](/_next/static/media/star-bottom.7253800d.svg)
Copyright © 2020–2026 A2Z Services. All Rights Reserved. Developed and managed by ZUCOL.