logo

Lab Assignment #1: Data Visualization

Create and interpret graphs using the Introductory to Statistics Excel Lab Manual.

9 Pages863 Words389 Views
   

Added on  2023-04-08

About This Document

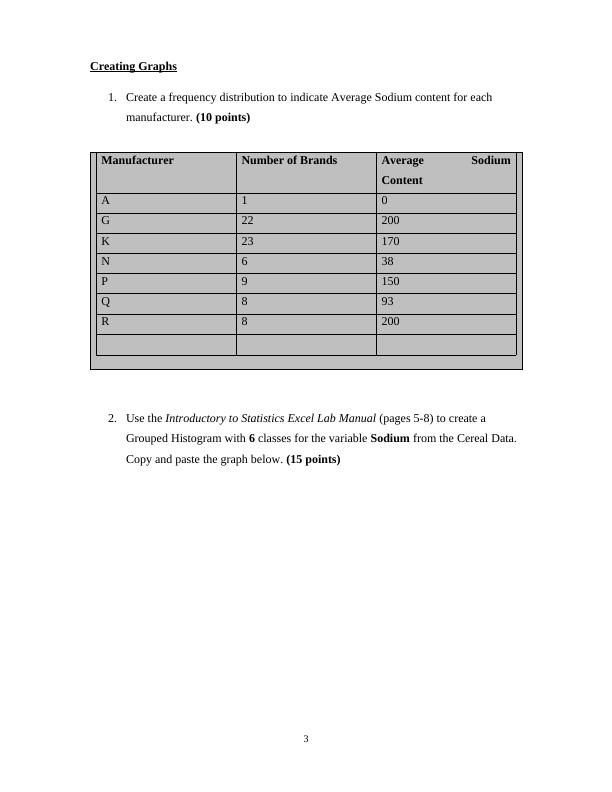
This lab assignment focuses on data visualization in the context of MATH 2610 Survey of Statistics. It covers creating frequency distributions, graphing histograms and box-and-whisker plots, and interpreting the shape of distributions. The assignment also includes short answer questions related to the histograms and descriptive statistics.

Lab Assignment #1: Data Visualization

Create and interpret graphs using the Introductory to Statistics Excel Lab Manual.

   Added on 2023-04-08

ShareRelated Documents
MATH 2610 Survey of Statistics
Lab Assignment #1: Data Visualization
Statistical concepts used in this lab: Using the Introductory to Statistics Excel Lab Manual
Creating Frequency Distributions
Graphing Frequency Histograms
Graphing Box-n-whisker Plots
Identifying the shape of distributions
LAB INSTRUCTIONS
Use the Introductory to Statistics Excel Lab Manual to help you understand how to
create and interpret the graphs in this lab assignment.
The data set for this course has already been formatted, entered into an Excel
worksheet and posted in Blackboard.
The names of each variable are in the first row of the Worksheet. This row has a
background color of gray to identify it as the variable names. All other rows of the
Worksheet represent a brand of cereal. Therefore, the rows are called observations
and the columns are called variables.
Follow the directions below and then paste the graphs from Excel in the gray areas
for question 1 through 5. Type your answers to questions 6 through 10 where noted in
the gray areas. When asked for explanations, please give thorough, multi-sentence or
paragraph length explanations.
This completed Lab Word Document with your responses to the 10 questions will be
the ONLY document you will upload in Blackboard.
Lab Assignment #1: Data Visualization_1
2
Lab Assignment #1: Data Visualization_2
Creating Graphs
1. Create a frequency distribution to indicate Average Sodium content for each
manufacturer. (10 points)
Manufacturer Number of Brands Average Sodium
Content
A 1 0
G 22 200
K 23 170
N 6 38
P 9 150
Q 8 93
R 8 200
2. Use the Introductory to Statistics Excel Lab Manual (pages 5-8) to create a
Grouped Histogram with 6 classes for the variable Sodium from the Cereal Data.
Copy and paste the graph below. (15 points)
3
Lab Assignment #1: Data Visualization_3

End of preview

Want to access all the pages? Upload your documents or become a member.

Related Documents
Statistics for Decision Making Week
|5
|1378
|15