Final Exam: NUR 627 Advanced Epidemiology and Biostatistics
VerifiedAdded on 2023/06/10
|5
|923
|266
Quiz and Exam
AI Summary
This document presents the solutions to a final exam for NUR 627: Advanced Epidemiology and Biostatistics for Nursing. The exam covers a range of topics including study designs (case-control, cohort), statistical tests (Kruskal-Wallis), measures of association (relative risk, odds ratio, risk difference), a...
Mathematics
Student Name:
Instructor Name:
Course Number:
6 August 2018
Student Name:
Instructor Name:
Course Number:
6 August 2018
Paraphrase This Document
Need a fresh take? Get an instant paraphrase of this document with our AI Paraphraser
Answers
Q1: C
Q2:
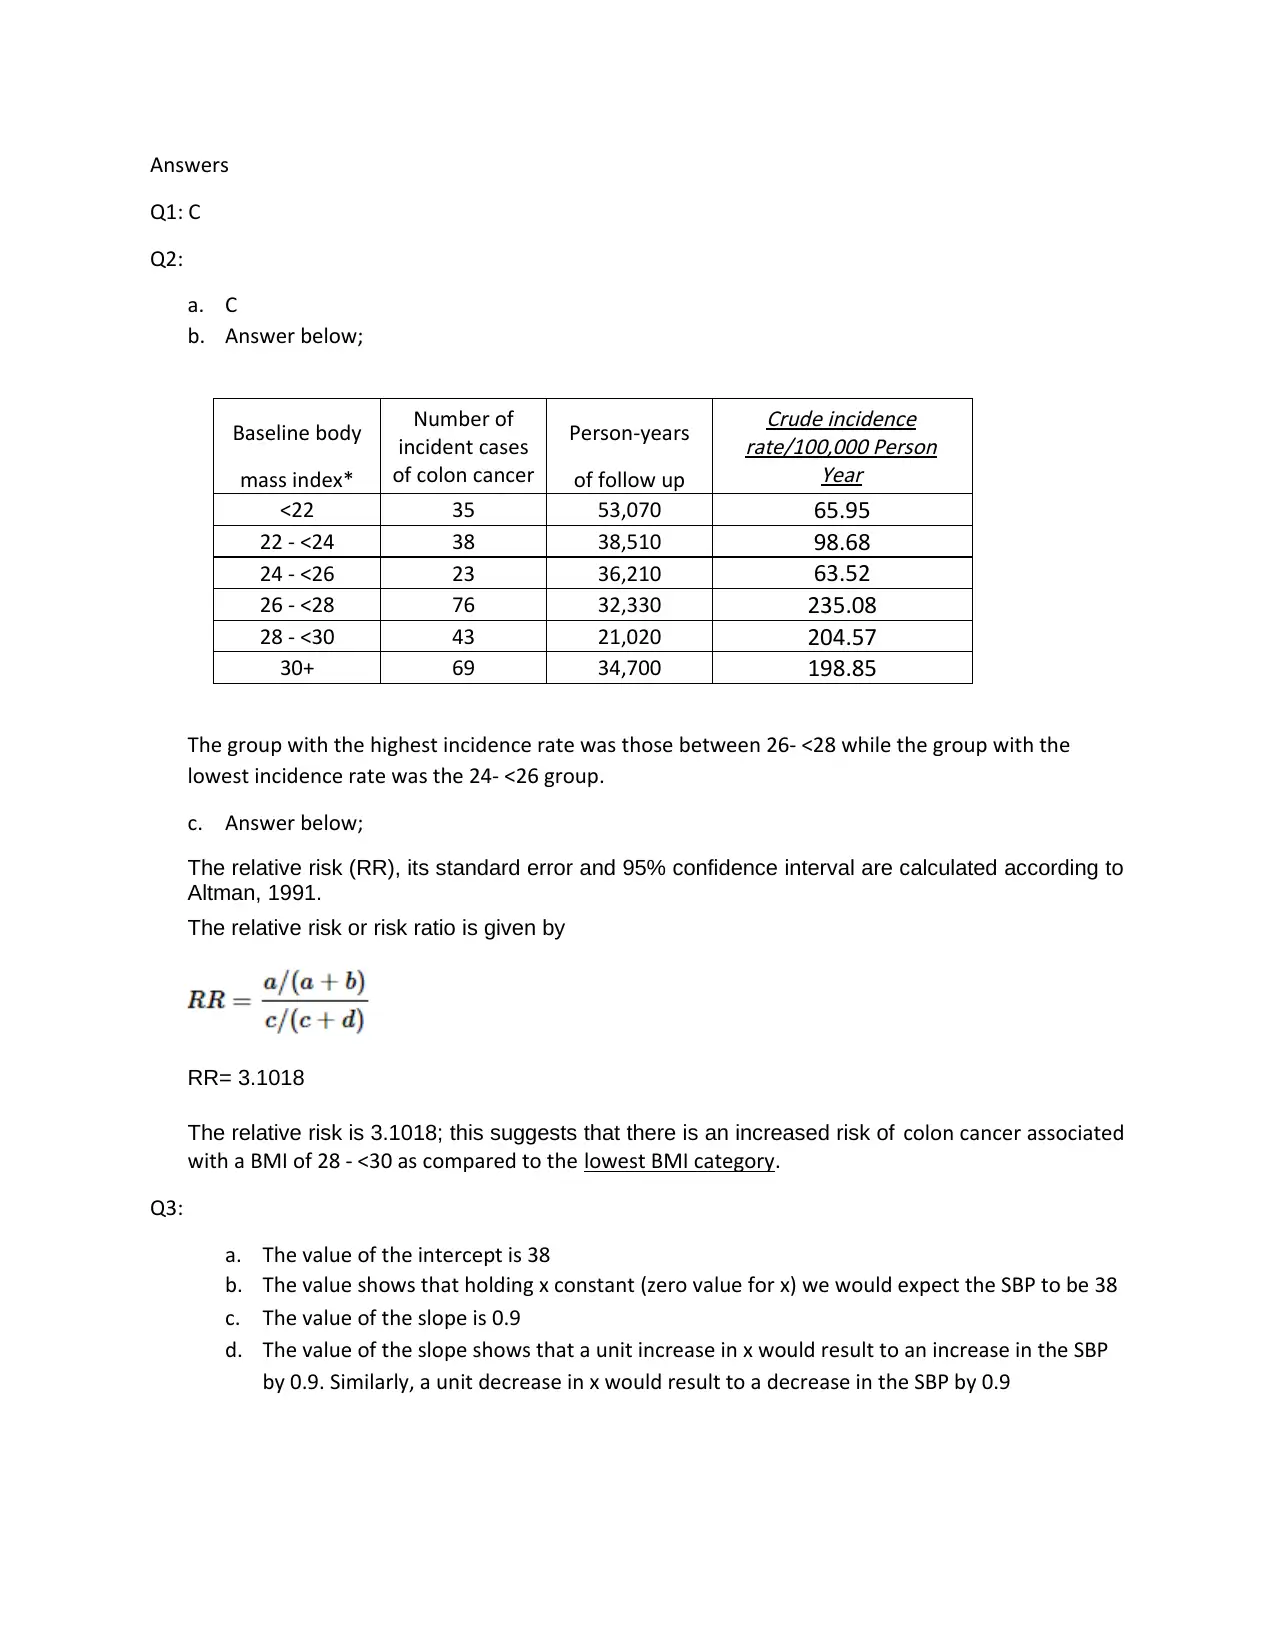
a. C
b. Answer below;
Baseline body Number of
incident cases
of colon cancer
Person-years
Crude incidence
rate/100,000 Person
Yearmass index* of follow up
<22 35 53,070 65.95
22 - <24 38 38,510 98.68
24 - <26 23 36,210 63.52
26 - <28 76 32,330 235.08
28 - <30 43 21,020 204.57
30+ 69 34,700 198.85
The group with the highest incidence rate was those between 26- <28 while the group with the
lowest incidence rate was the 24- <26 group.
c. Answer below;
The relative risk (RR), its standard error and 95% confidence interval are calculated according to
Altman, 1991.
The relative risk or risk ratio is given by
RR= 3.1018
The relative risk is 3.1018; this suggests that there is an increased risk of colon cancer associated
with a BMI of 28 - <30 as compared to the lowest BMI category.
Q3:
a. The value of the intercept is 38
b. The value shows that holding x constant (zero value for x) we would expect the SBP to be 38
c. The value of the slope is 0.9
d. The value of the slope shows that a unit increase in x would result to an increase in the SBP
by 0.9. Similarly, a unit decrease in x would result to a decrease in the SBP by 0.9
Q1: C
Q2:
a. C
b. Answer below;
Baseline body Number of
incident cases
of colon cancer
Person-years
Crude incidence
rate/100,000 Person
Yearmass index* of follow up
<22 35 53,070 65.95
22 - <24 38 38,510 98.68
24 - <26 23 36,210 63.52
26 - <28 76 32,330 235.08
28 - <30 43 21,020 204.57
30+ 69 34,700 198.85
The group with the highest incidence rate was those between 26- <28 while the group with the
lowest incidence rate was the 24- <26 group.
c. Answer below;
The relative risk (RR), its standard error and 95% confidence interval are calculated according to
Altman, 1991.
The relative risk or risk ratio is given by
RR= 3.1018
The relative risk is 3.1018; this suggests that there is an increased risk of colon cancer associated
with a BMI of 28 - <30 as compared to the lowest BMI category.
Q3:
a. The value of the intercept is 38
b. The value shows that holding x constant (zero value for x) we would expect the SBP to be 38
c. The value of the slope is 0.9
d. The value of the slope shows that a unit increase in x would result to an increase in the SBP
by 0.9. Similarly, a unit decrease in x would result to a decrease in the SBP by 0.9
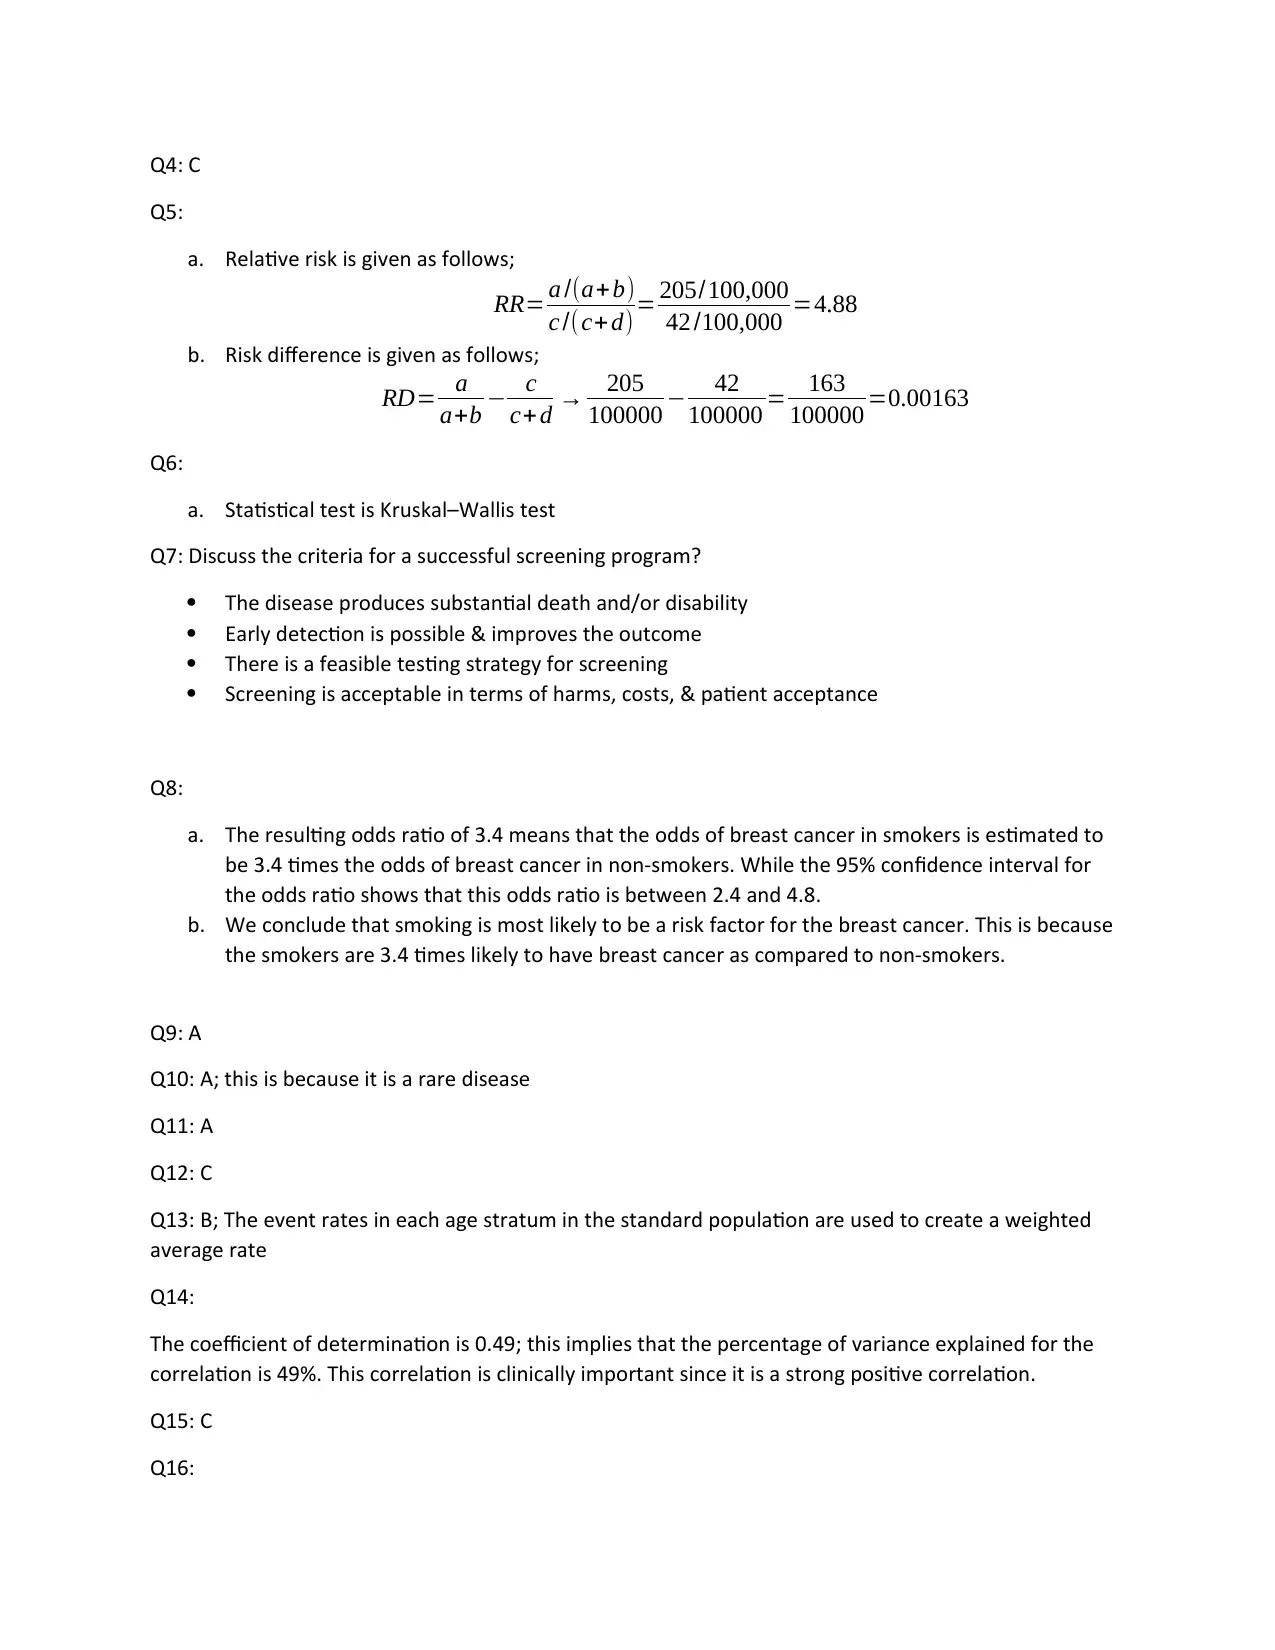
Q4: C
Q5:
a. Relative risk is given as follows;
RR= a /(a+b)
c /(c+ d)= 205/100,000
42 /100,000 =4.88
b. Risk difference is given as follows;
RD= a
a+b − c
c+ d → 205
100000 − 42
100000 = 163
100000 =0.00163
Q6:
a. Statistical test is Kruskal–Wallis test
Q7: Discuss the criteria for a successful screening program?
The disease produces substantial death and/or disability
Early detection is possible & improves the outcome
There is a feasible testing strategy for screening
Screening is acceptable in terms of harms, costs, & patient acceptance
Q8:
a. The resulting odds ratio of 3.4 means that the odds of breast cancer in smokers is estimated to
be 3.4 times the odds of breast cancer in non-smokers. While the 95% confidence interval for
the odds ratio shows that this odds ratio is between 2.4 and 4.8.
b. We conclude that smoking is most likely to be a risk factor for the breast cancer. This is because
the smokers are 3.4 times likely to have breast cancer as compared to non-smokers.
Q9: A
Q10: A; this is because it is a rare disease
Q11: A
Q12: C
Q13: B; The event rates in each age stratum in the standard population are used to create a weighted
average rate
Q14:
The coefficient of determination is 0.49; this implies that the percentage of variance explained for the
correlation is 49%. This correlation is clinically important since it is a strong positive correlation.
Q15: C
Q16:
⊘ This is a preview!⊘
Do you want full access?
Subscribe today to unlock all pages.
Trusted by 1+ million students worldwide
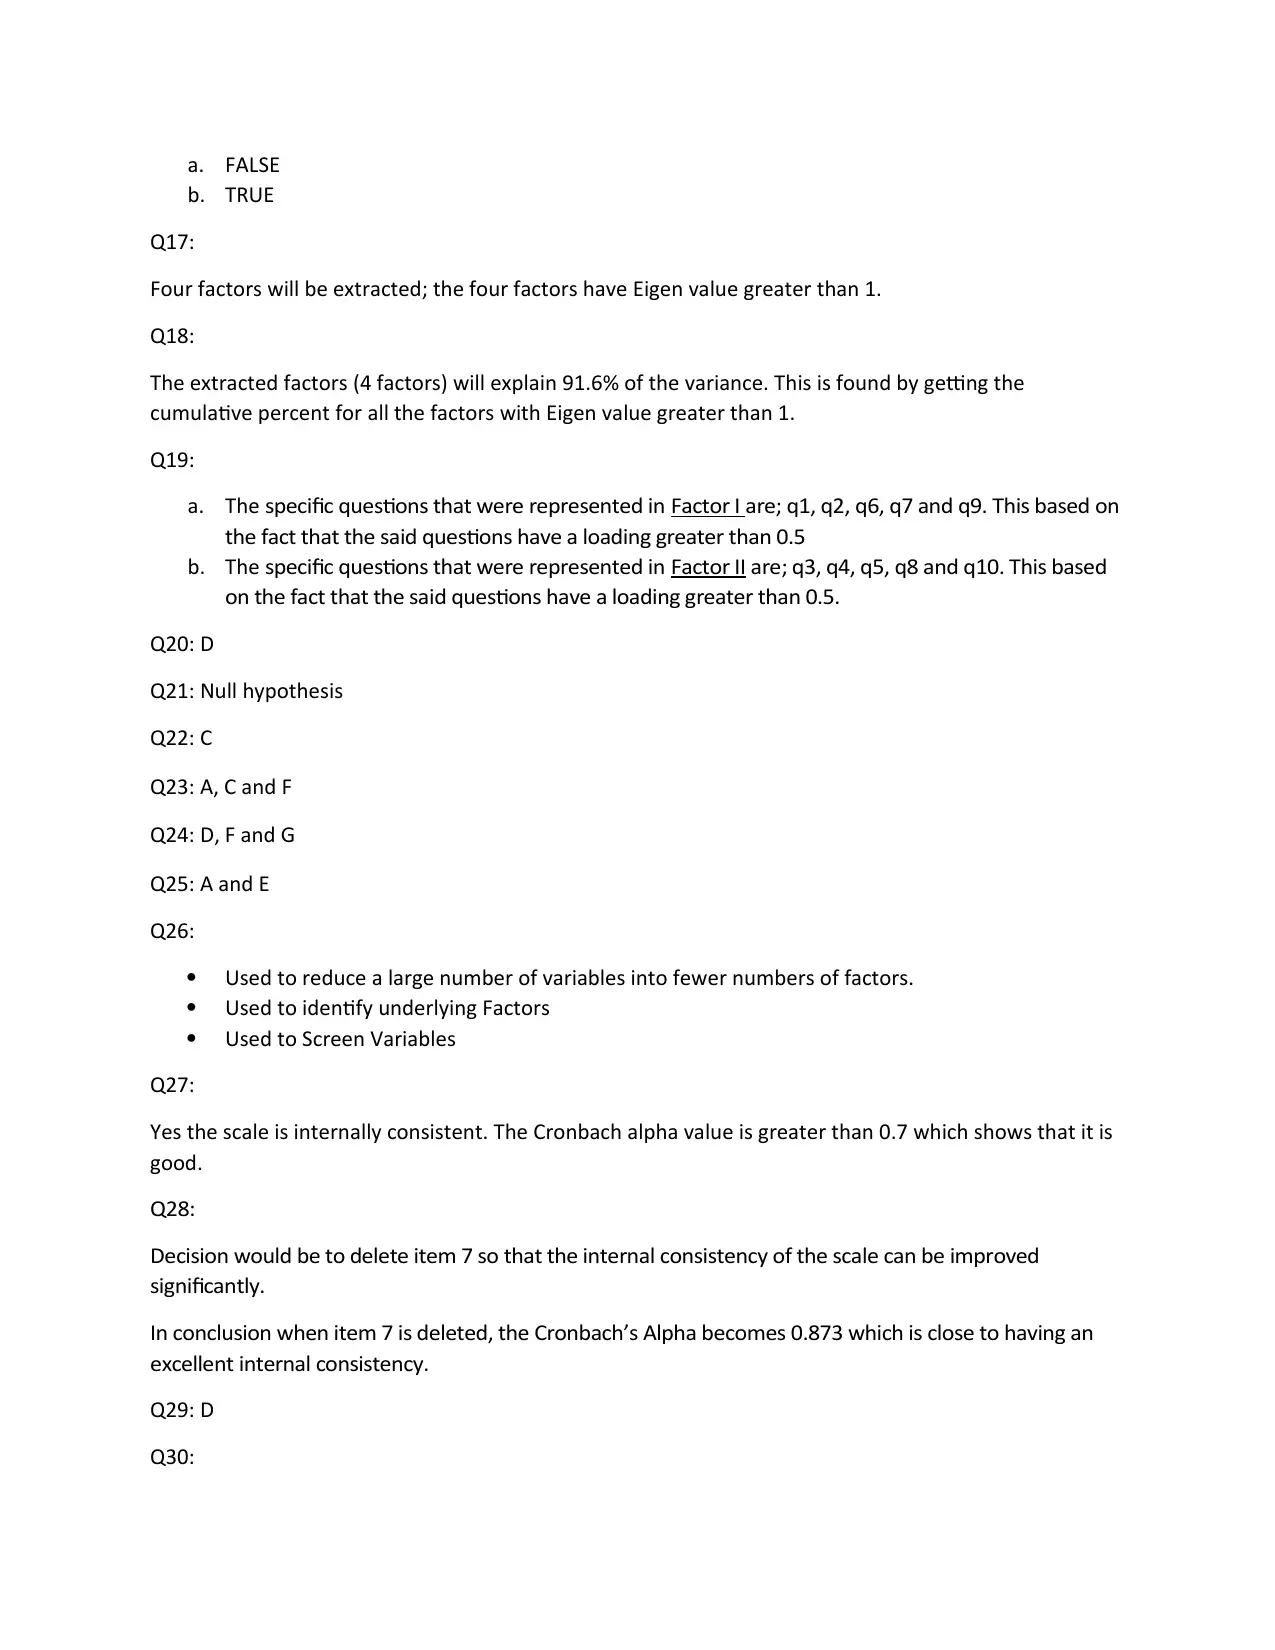
a. FALSE
b. TRUE
Q17:
Four factors will be extracted; the four factors have Eigen value greater than 1.
Q18:
The extracted factors (4 factors) will explain 91.6% of the variance. This is found by getting the
cumulative percent for all the factors with Eigen value greater than 1.
Q19:
a. The specific questions that were represented in Factor I are; q1, q2, q6, q7 and q9. This based on
the fact that the said questions have a loading greater than 0.5
b. The specific questions that were represented in Factor II are; q3, q4, q5, q8 and q10. This based
on the fact that the said questions have a loading greater than 0.5.
Q20: D
Q21: Null hypothesis
Q22: C
Q23: A, C and F
Q24: D, F and G
Q25: A and E
Q26:
Used to reduce a large number of variables into fewer numbers of factors.
Used to identify underlying Factors
Used to Screen Variables
Q27:
Yes the scale is internally consistent. The Cronbach alpha value is greater than 0.7 which shows that it is
good.
Q28:
Decision would be to delete item 7 so that the internal consistency of the scale can be improved
significantly.
In conclusion when item 7 is deleted, the Cronbach’s Alpha becomes 0.873 which is close to having an
excellent internal consistency.
Q29: D
Q30:
Paraphrase This Document
Need a fresh take? Get an instant paraphrase of this document with our AI Paraphraser
The above shows that 84% of lung cancer cases is attributable to exposure (asbestos). The implication is
that this proportion (84%) would have been avoided if asbestos was not in the picture.
Q31: A
Q32: A
Q33: C
Q34:
With R-square being 0.70 it implies that 70% of the variation in the dependent variable (diastolic blood
pressure) is explained by height (independent variable) in the model.
Q35: B
Q36: A
1 out of 5

Your All-in-One AI-Powered Toolkit for Academic Success.
+13062052269
info@desklib.com
Available 24*7 on WhatsApp / Email
![[object Object]](/_next/static/media/star-bottom.7253800d.svg)
Unlock your academic potential
© 2024 | Zucol Services PVT LTD | All rights reserved.