Mathematics Assignment: Data Analysis, Equations, and Graphs
VerifiedAdded on 2022/11/14
|13
|1378
|245
Homework Assignment
AI Summary
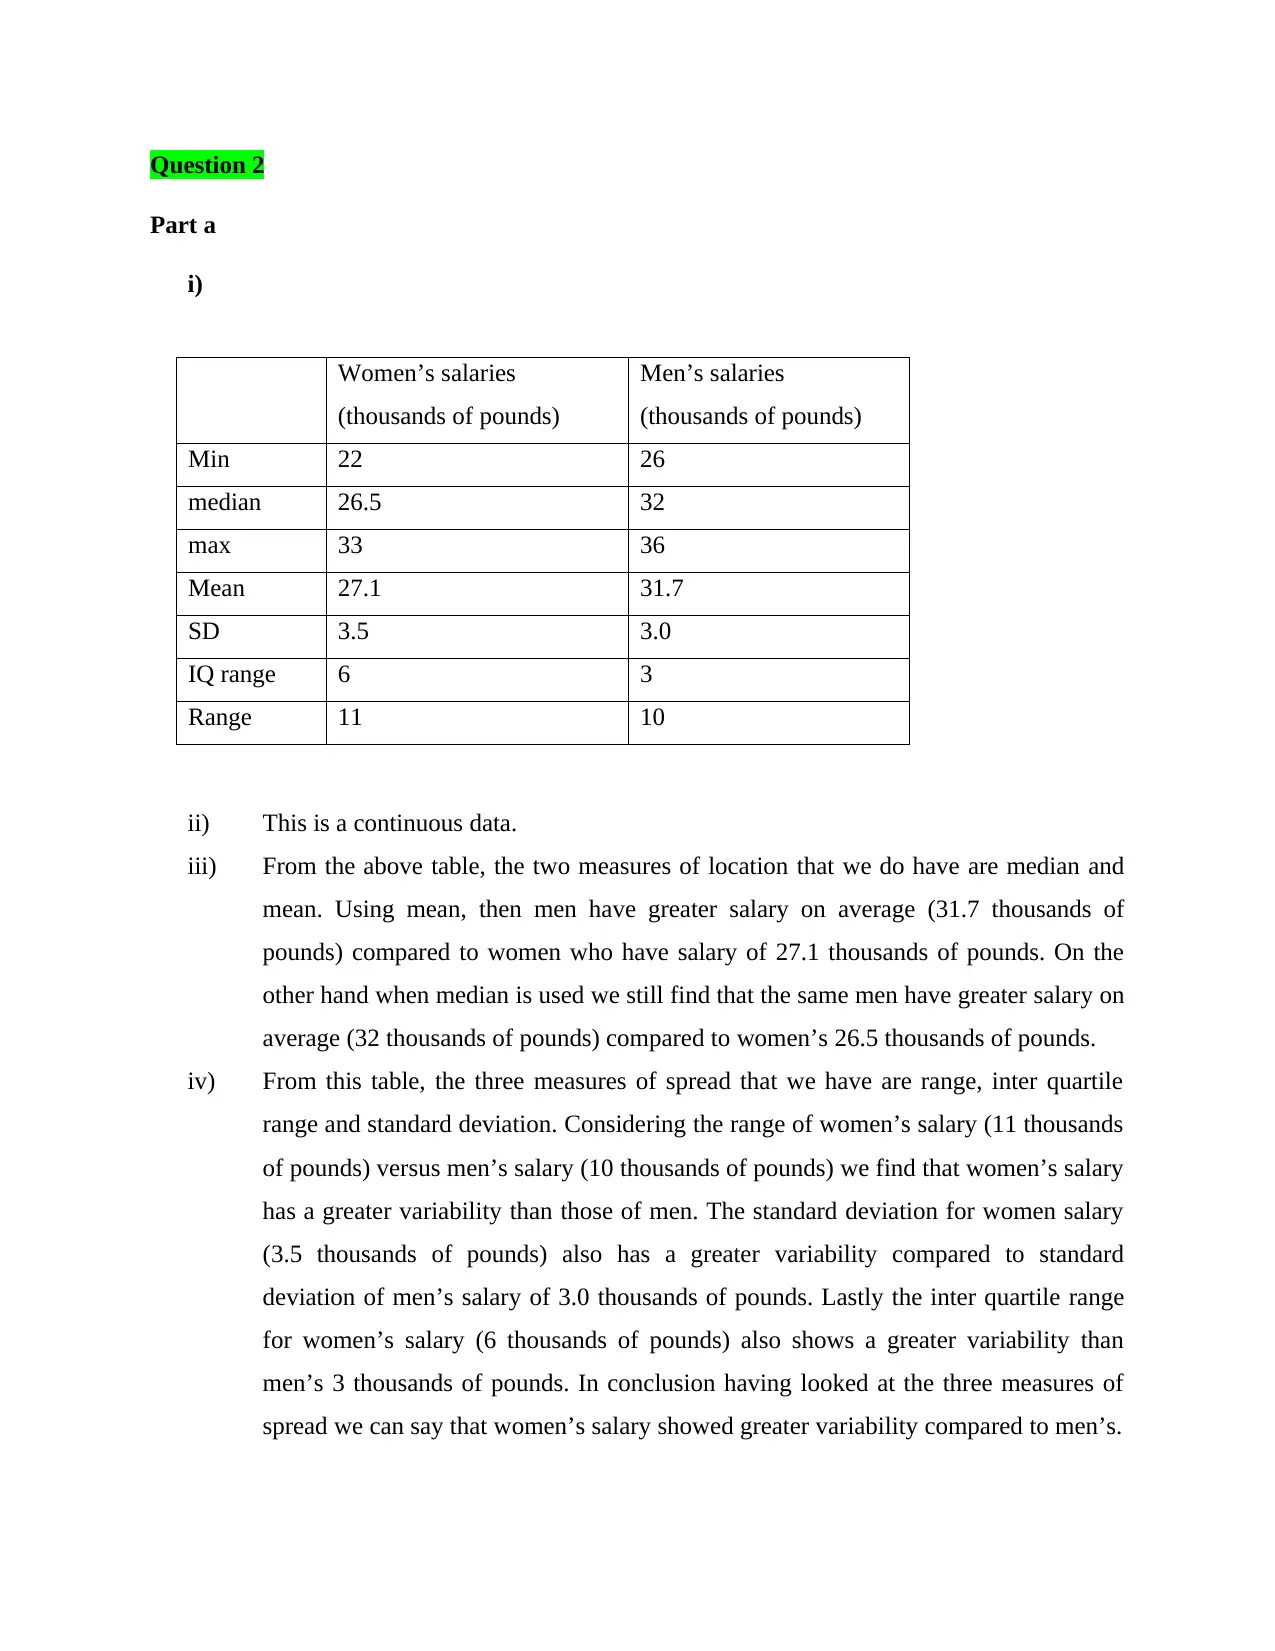
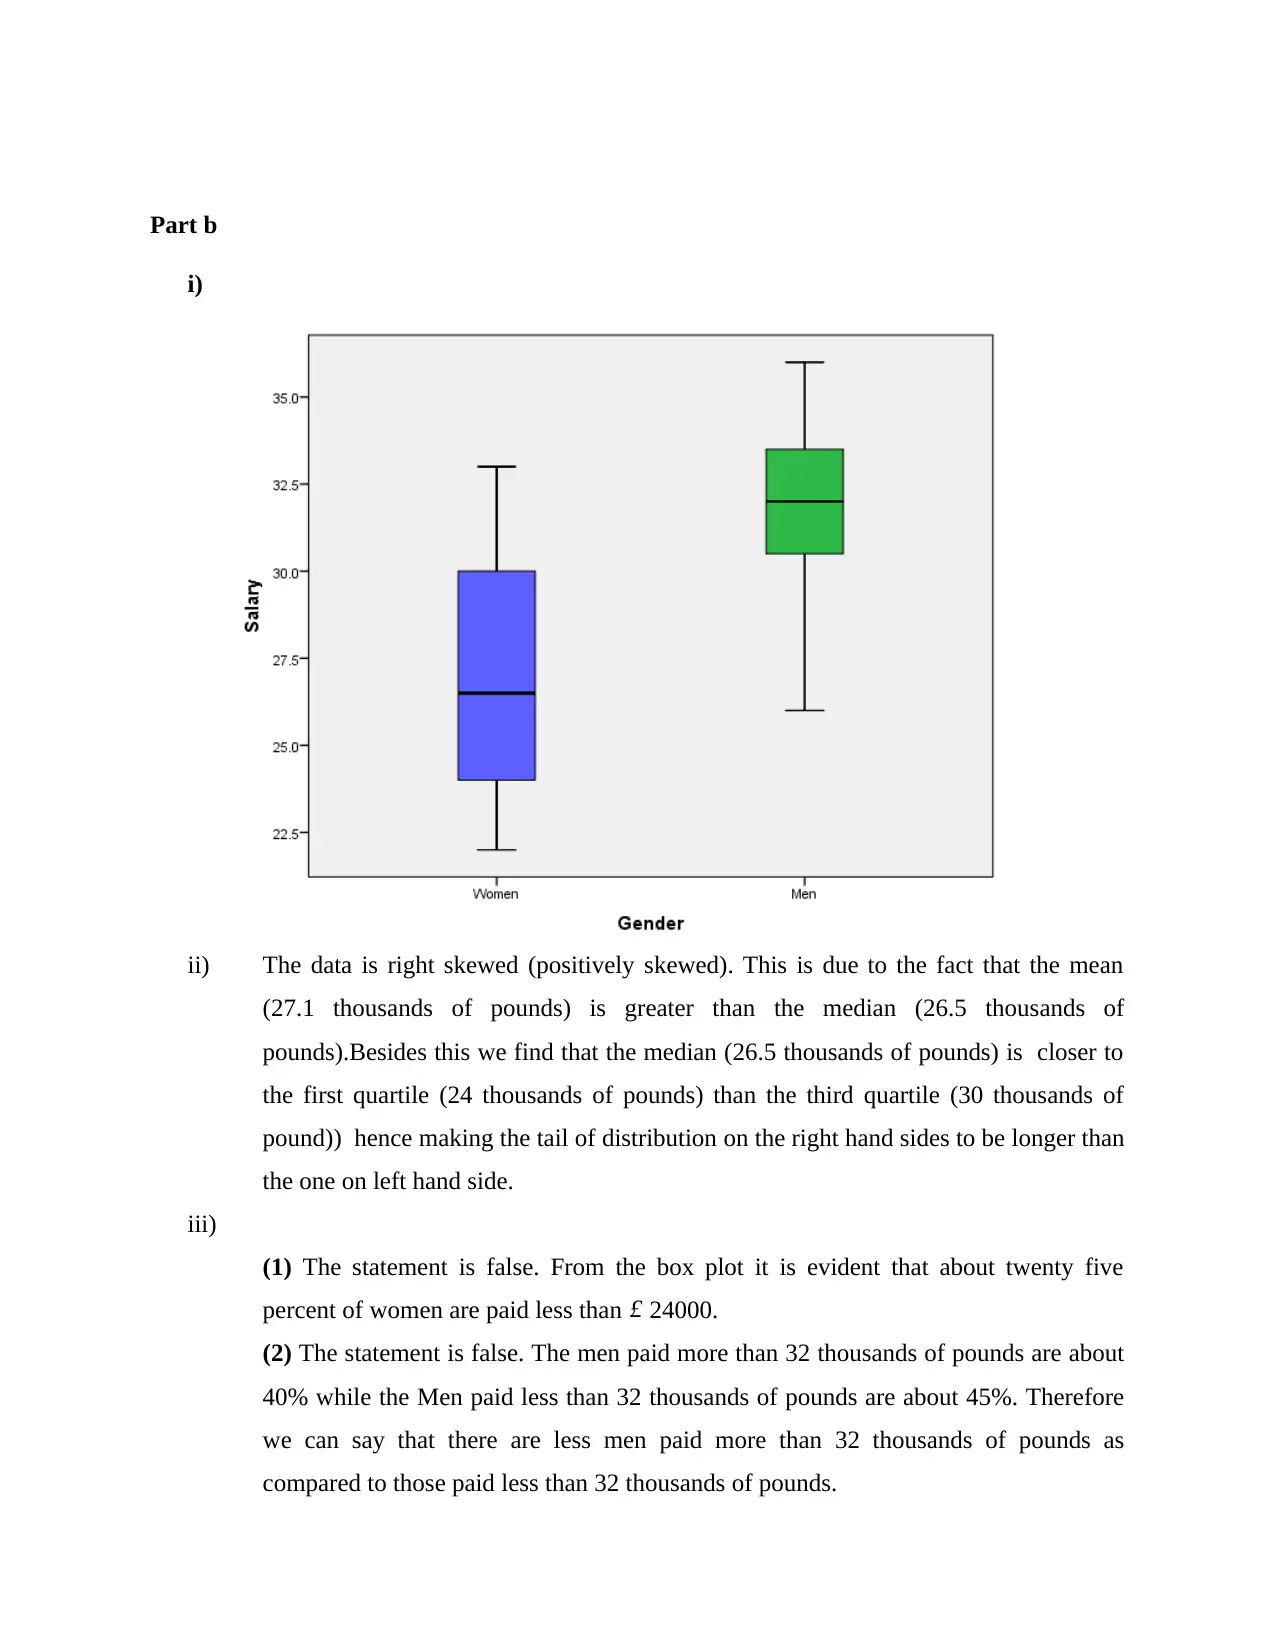
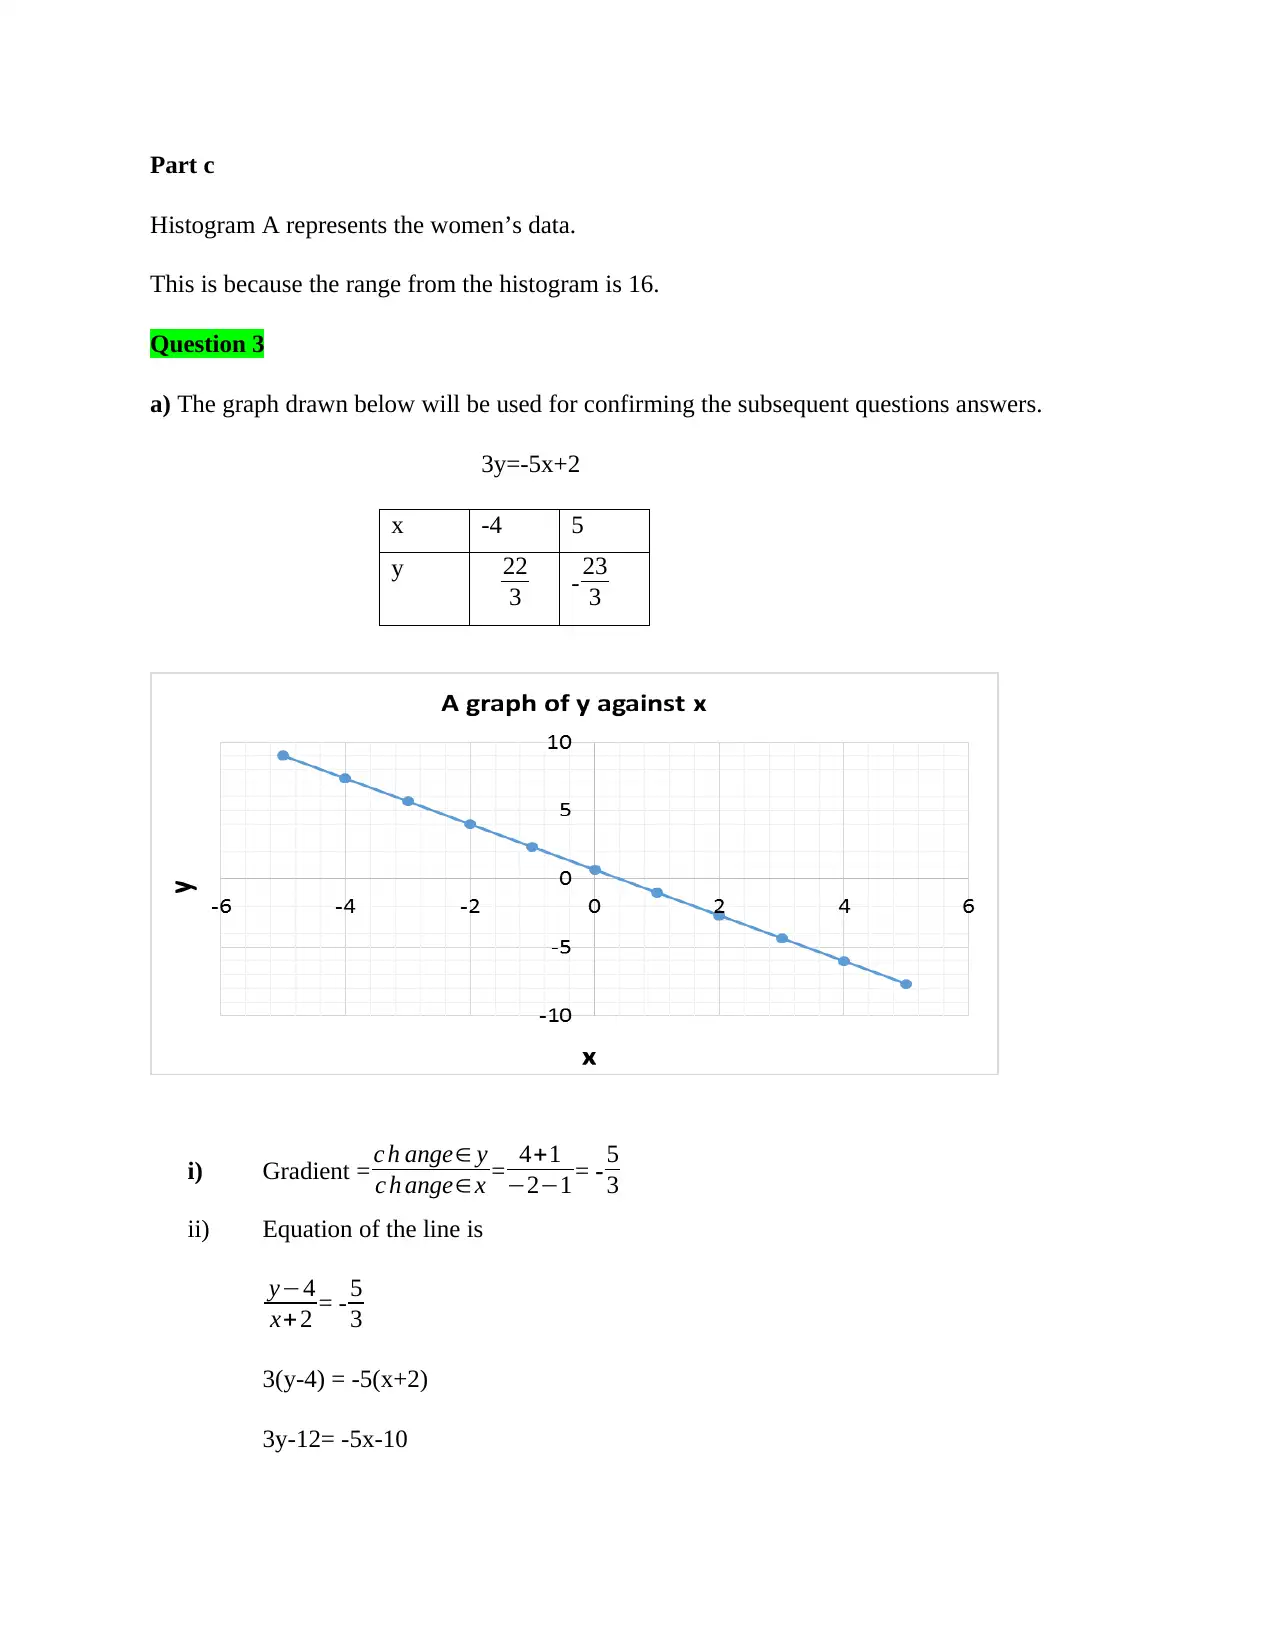
This mathematics assignment presents a comprehensive analysis of various mathematical concepts. The assignment begins with a statistical analysis of salary data, comparing men's and women's salaries using measures of central tendency (mean and median) and dispersion (range, interquartile range, and standard deviation). It also includes an assessment of data skewness and interpretation of box plots. The assignment then delves into solving linear and quadratic equations, including graphical representations and the determination of intercepts. Furthermore, it explores exponential equations and their applications. The document provides detailed solutions, including step-by-step calculations and interpretations, making it a valuable resource for students studying mathematics and statistics. Finally, the assignment covers geometric problems involving circumference, area, and volume calculations, including applications of the Pythagorean theorem, trigonometry, and the cosine and sine rules.
1 out of 13
Related Documents


Your All-in-One AI-Powered Toolkit for Academic Success.
+13062052269
info@desklib.com
Available 24*7 on WhatsApp / Email
![[object Object]](/_next/static/media/star-bottom.7253800d.svg)
Copyright © 2020–2026 A2Z Services. All Rights Reserved. Developed and managed by ZUCOL.