Math Assignment: Statistical Analysis of Littleneck Clams
VerifiedAdded on 2023/06/07
|9
|761
|61
Homework Assignment
AI Summary
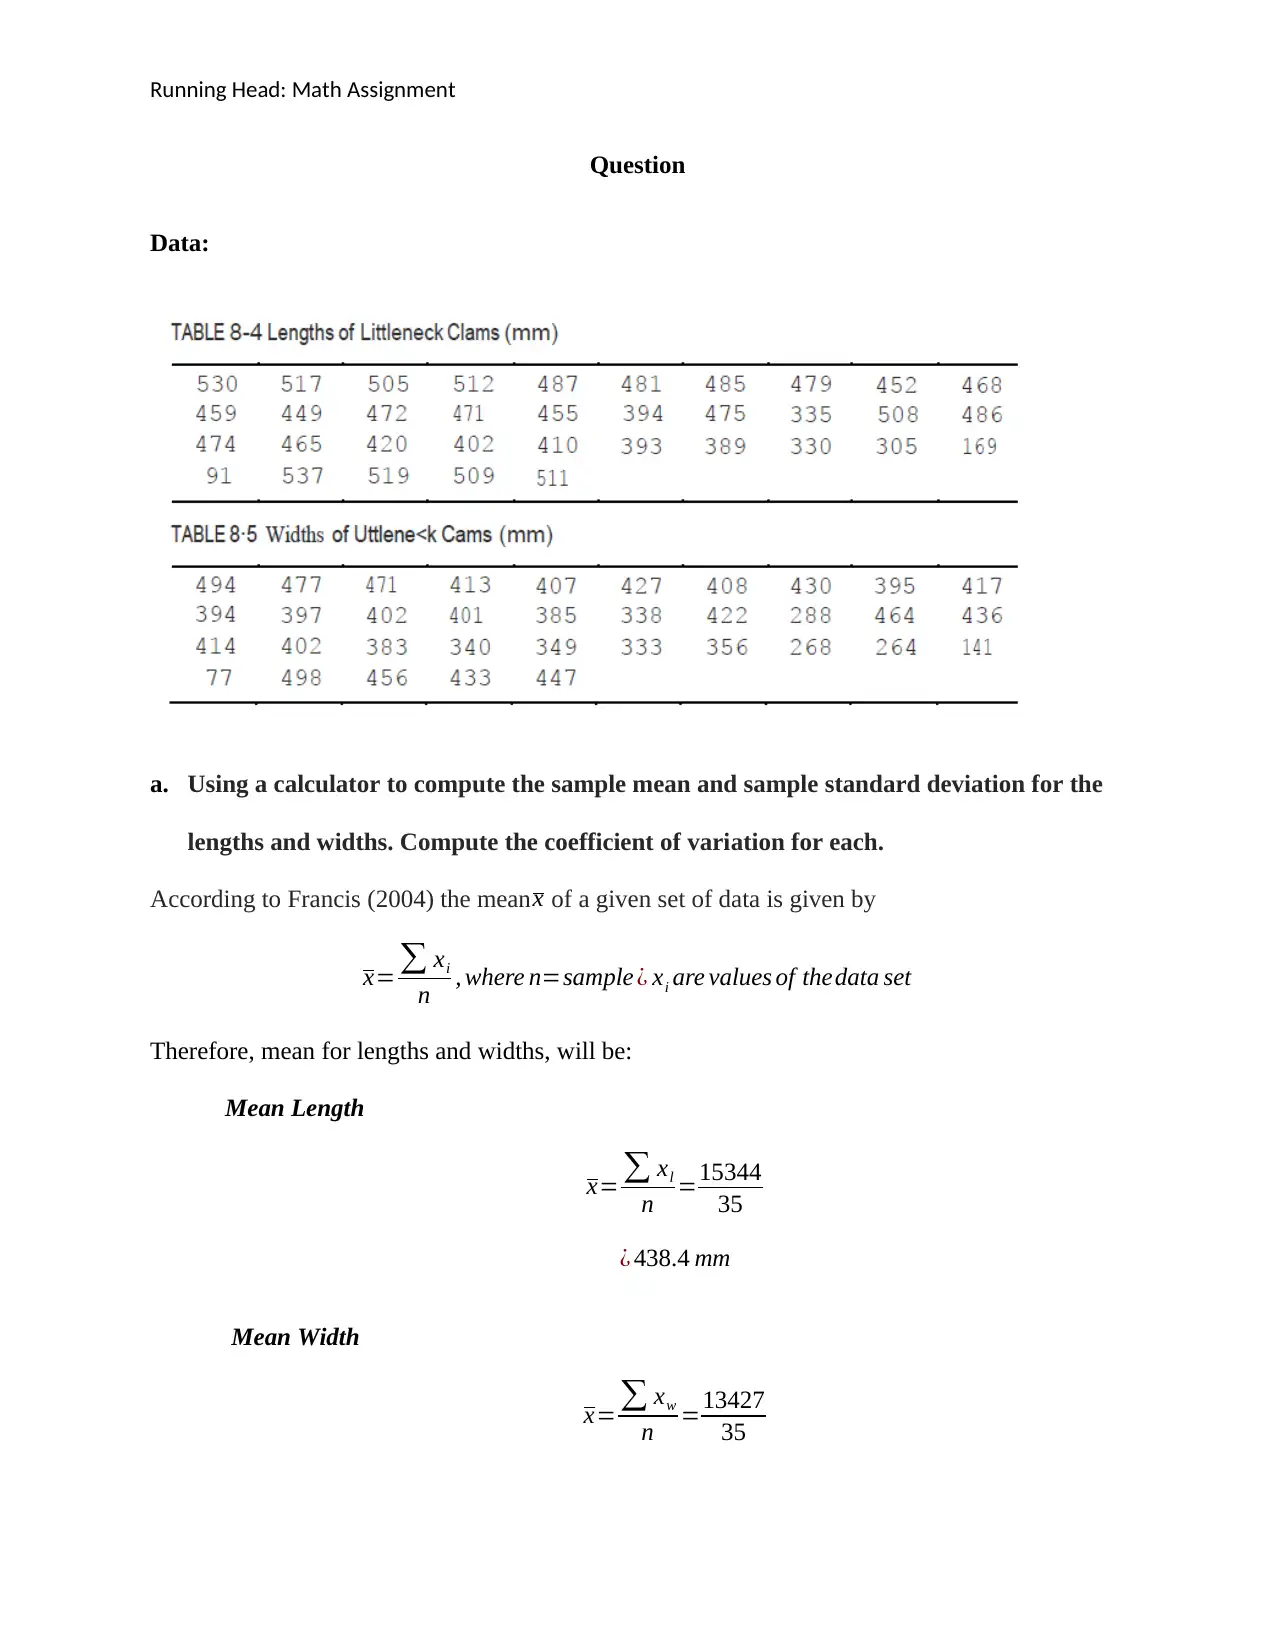
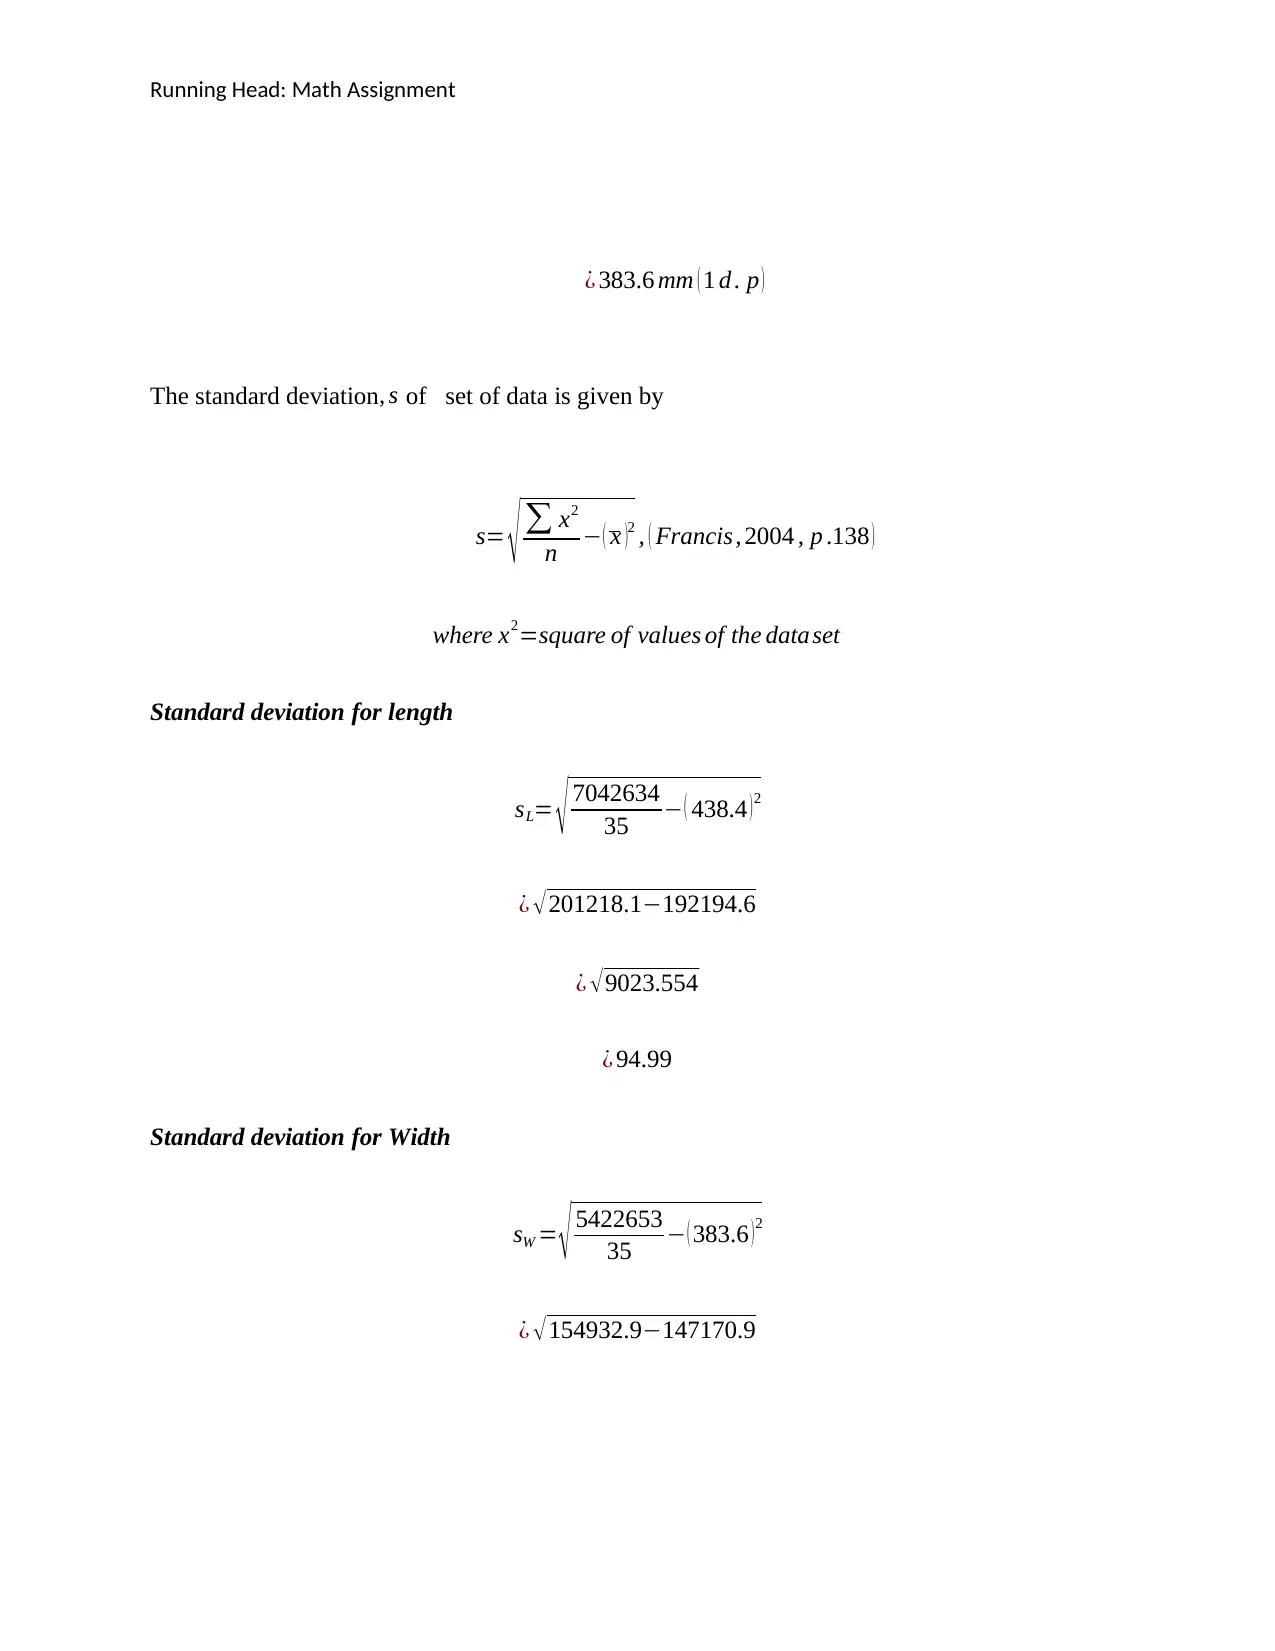
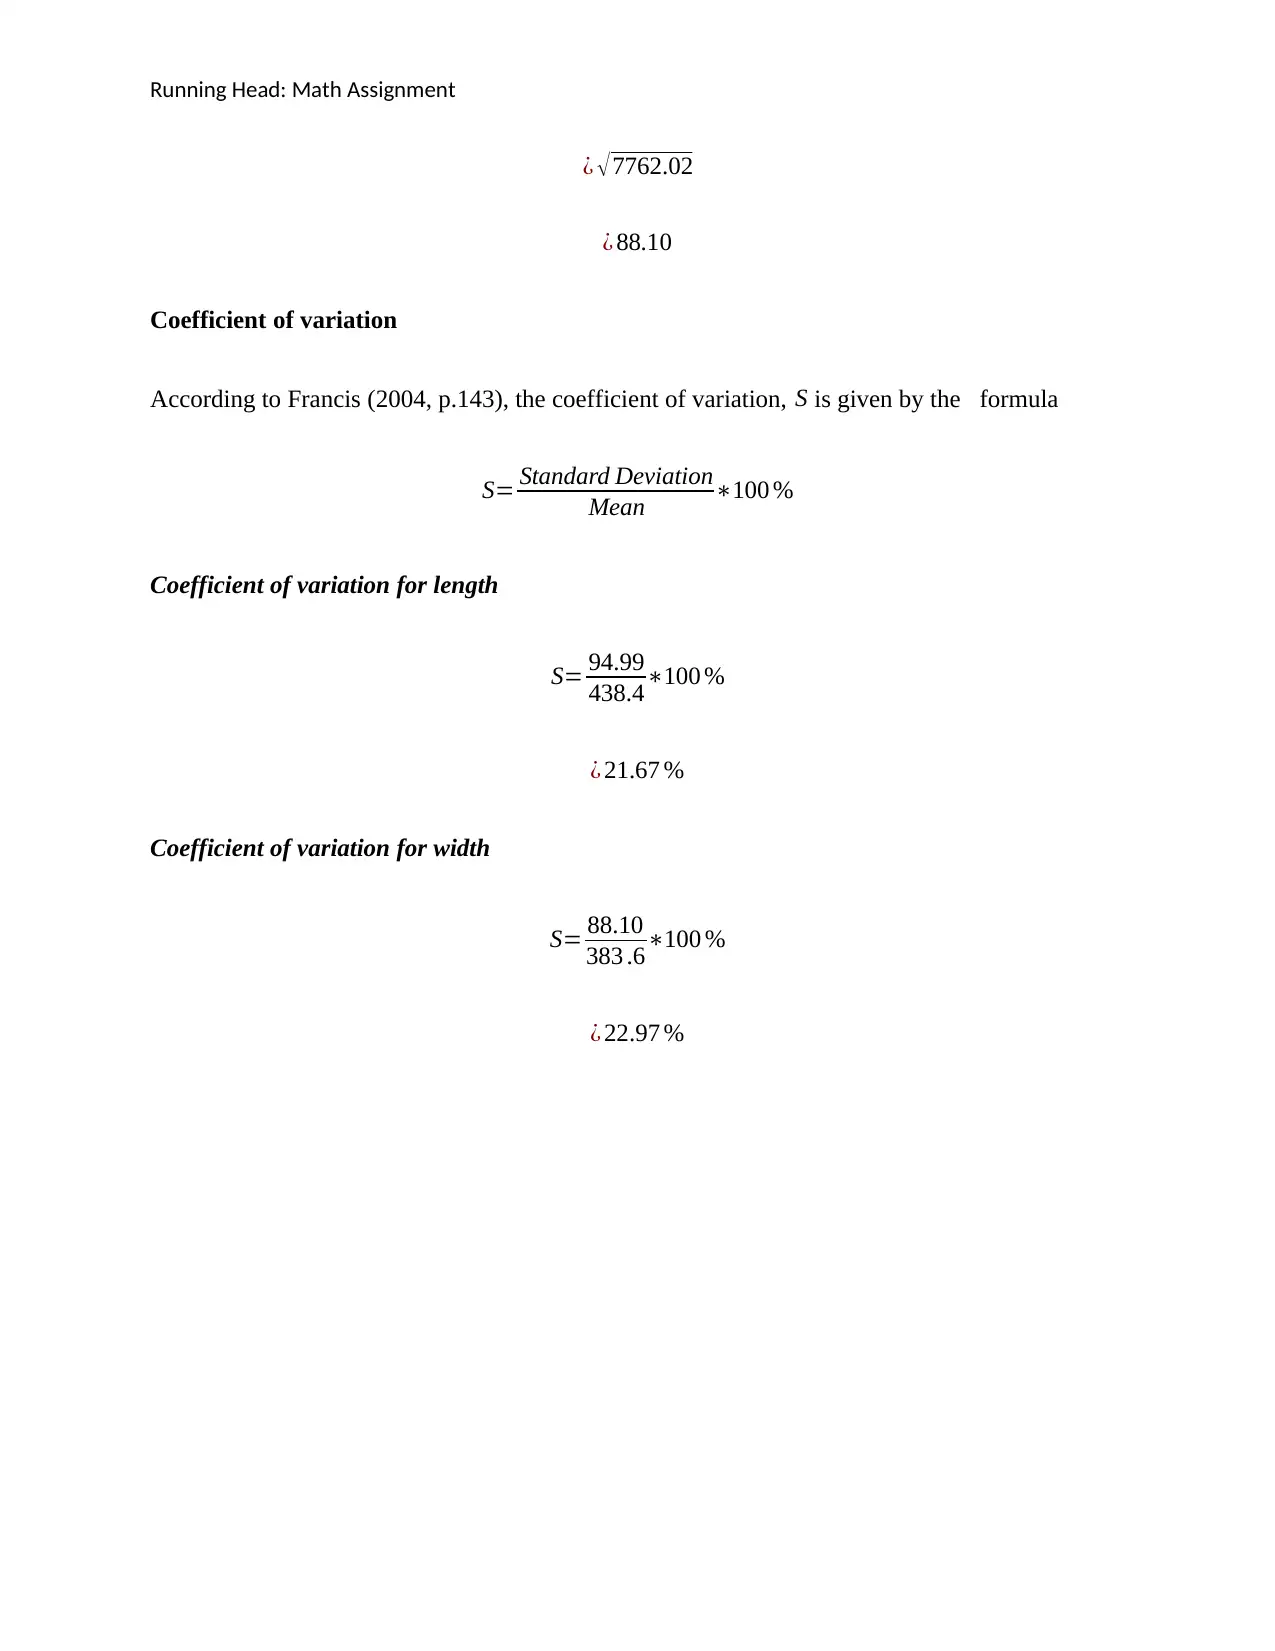
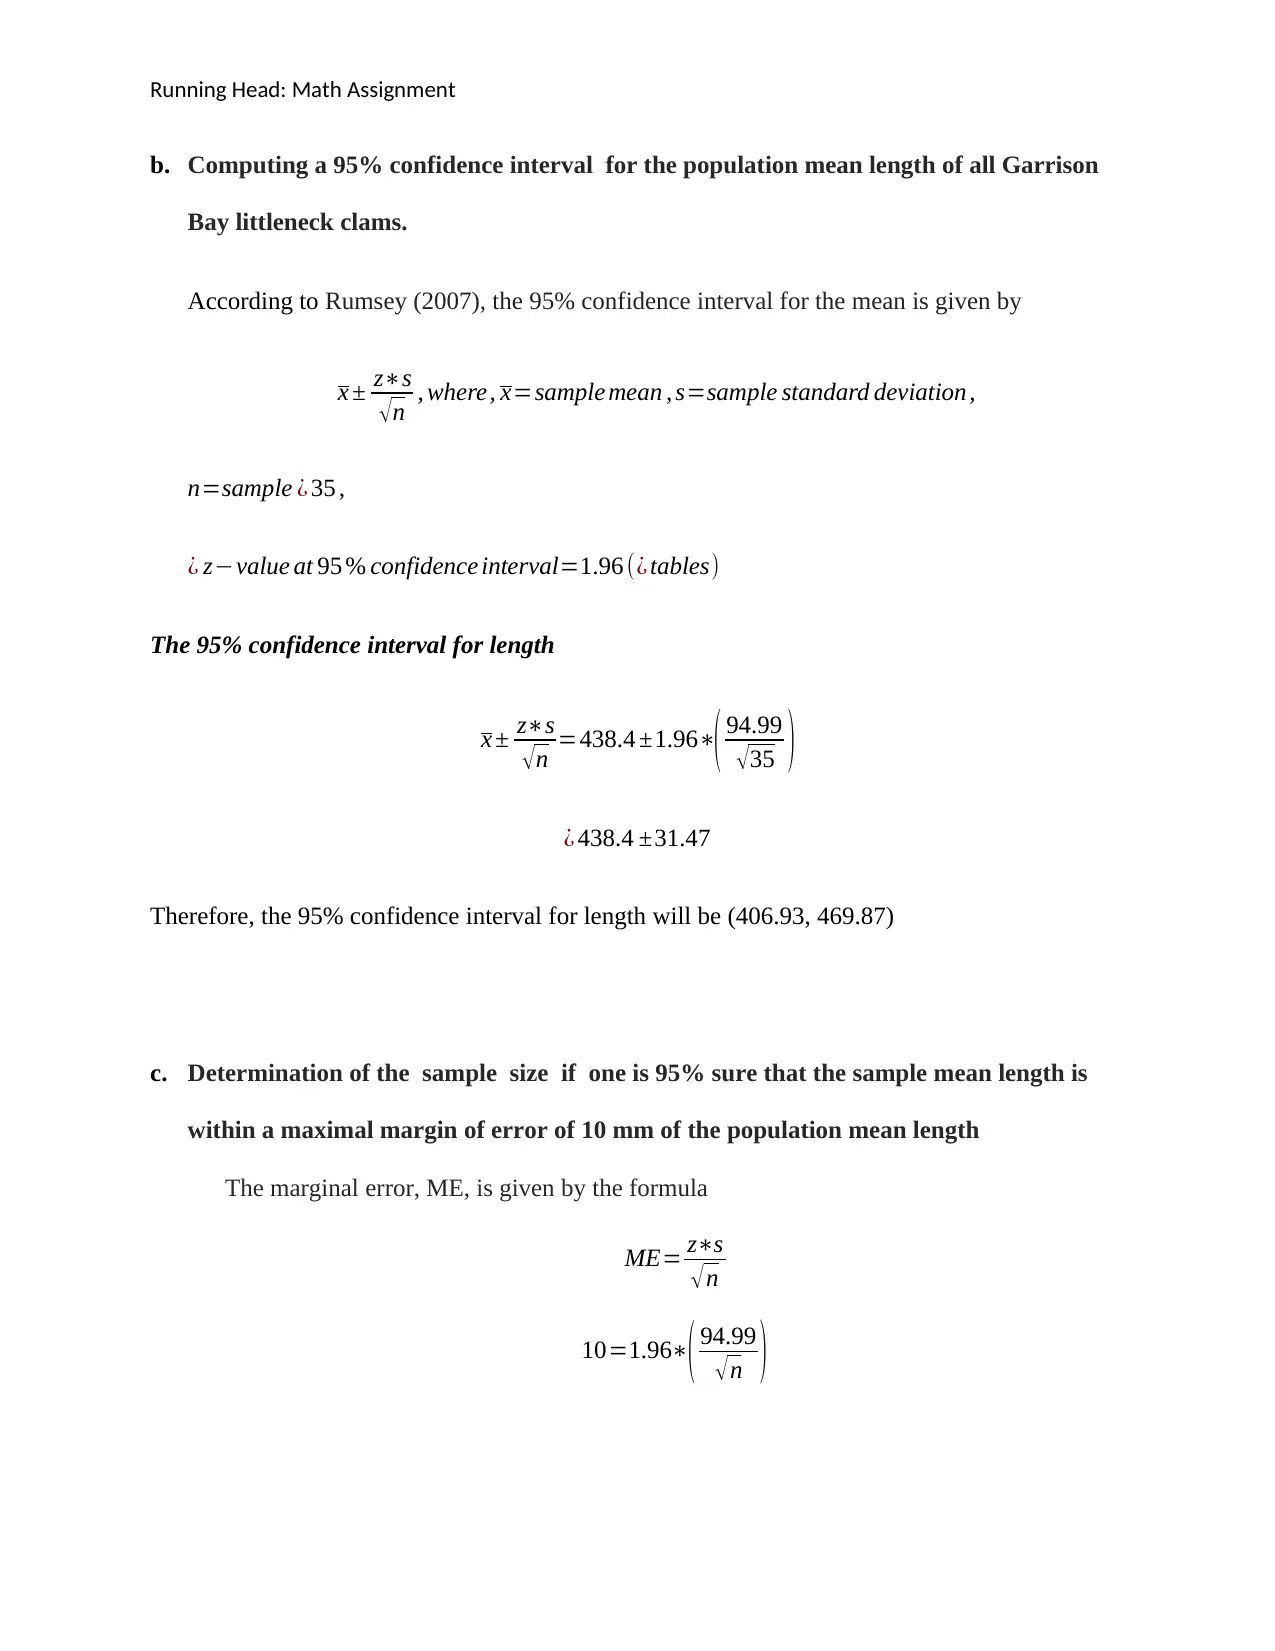
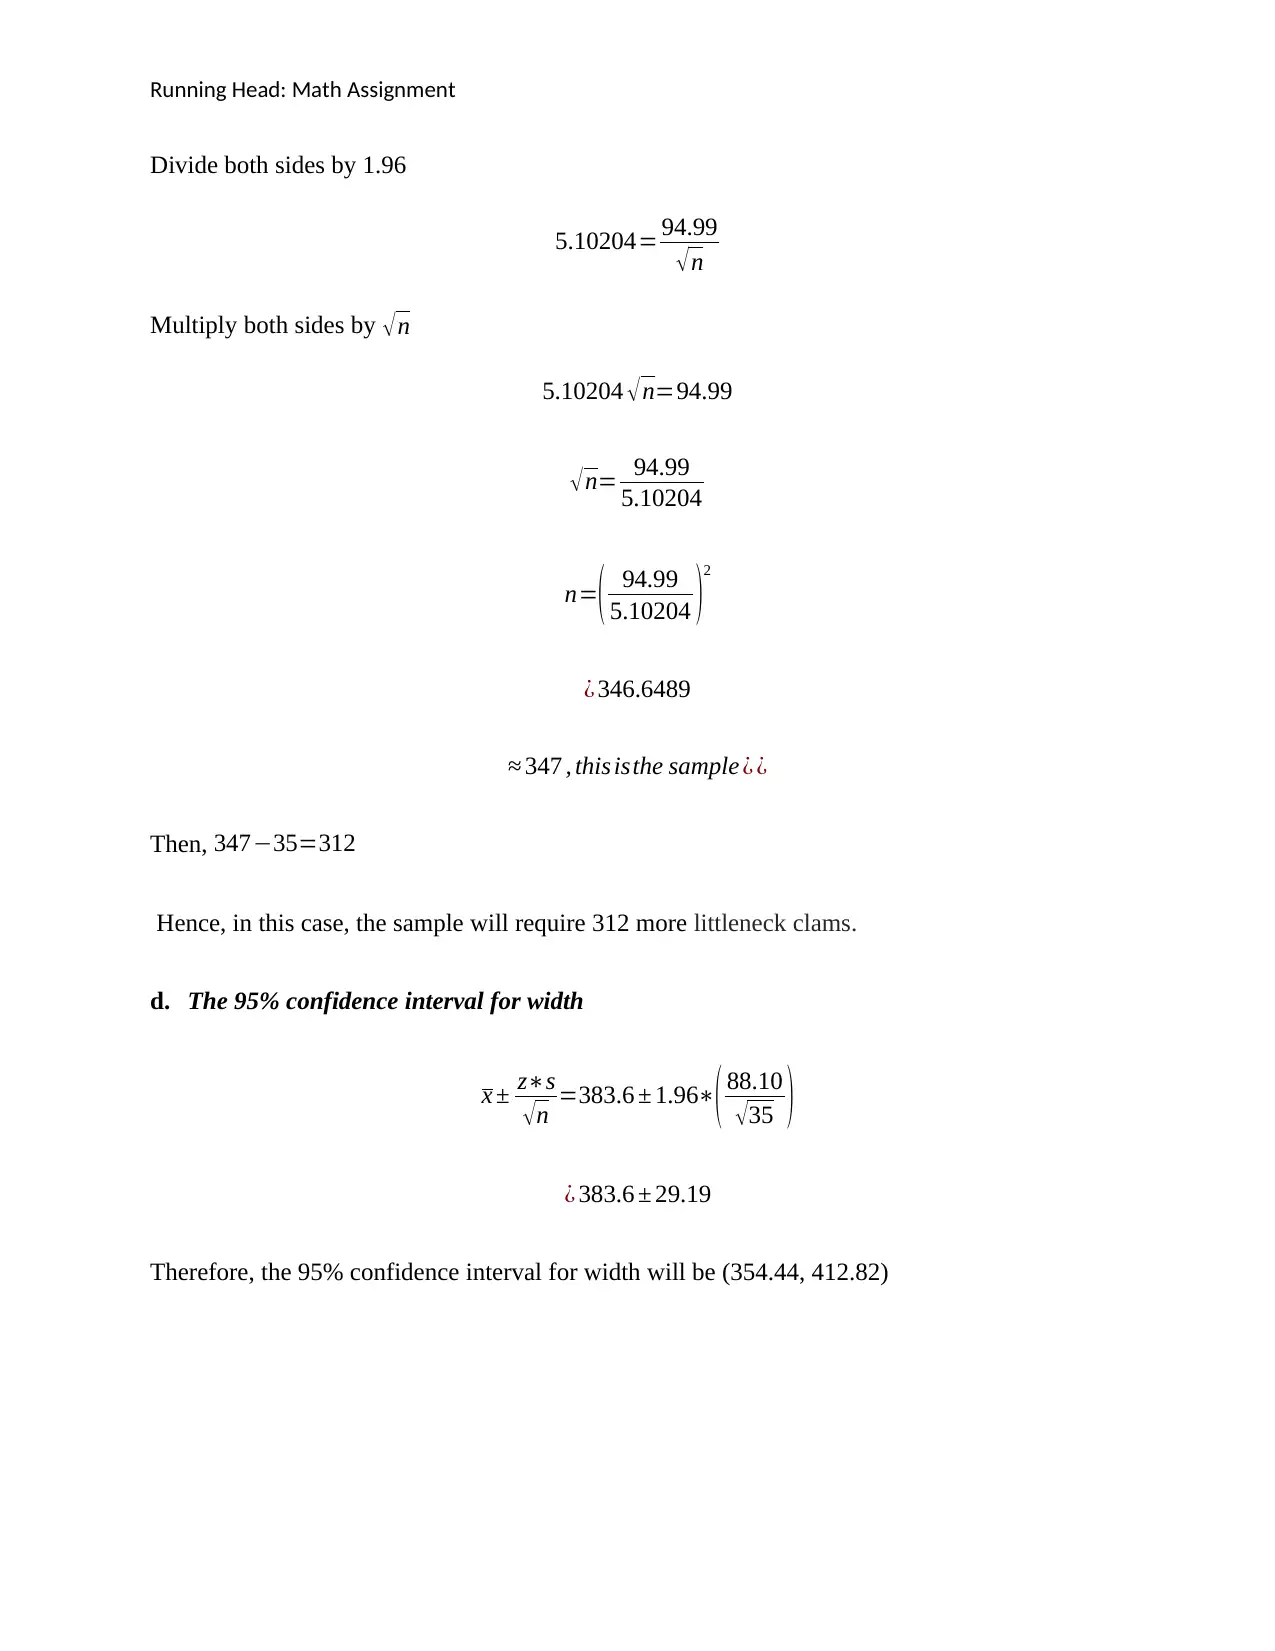
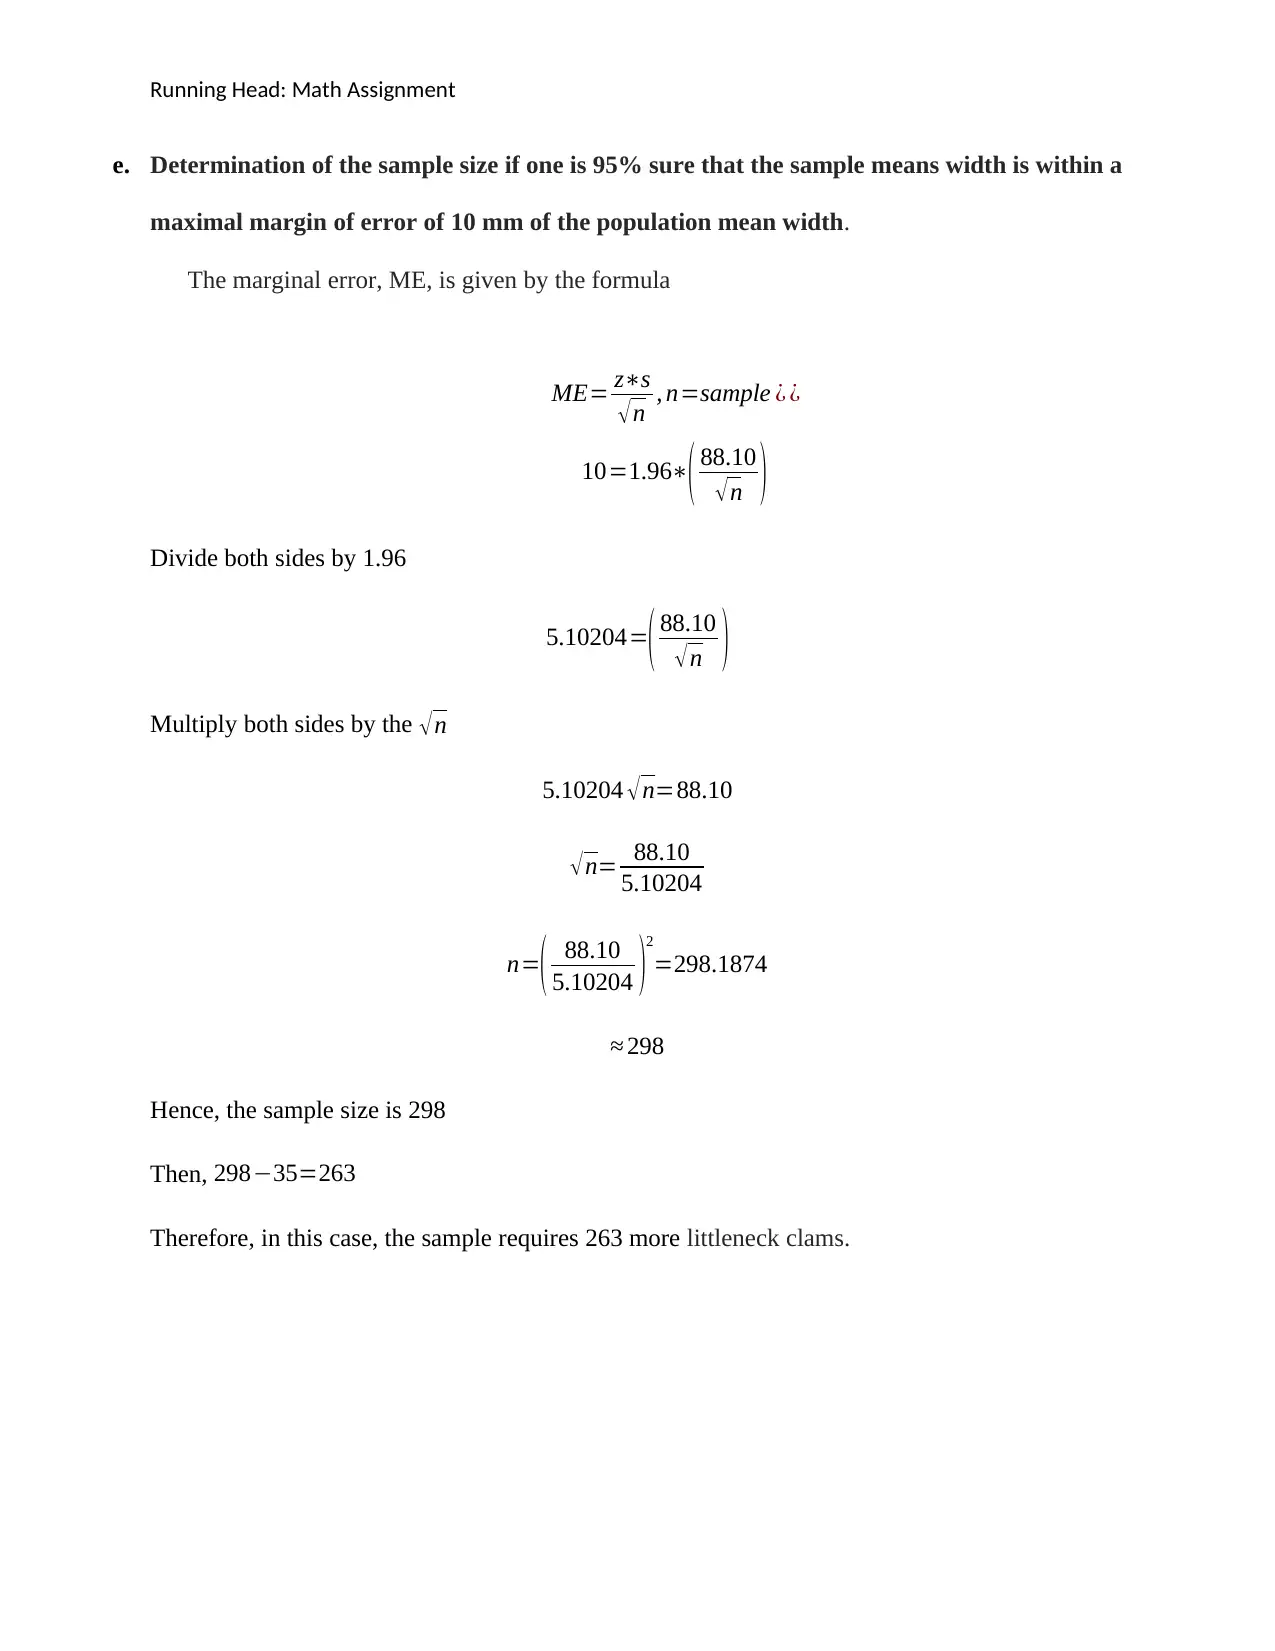
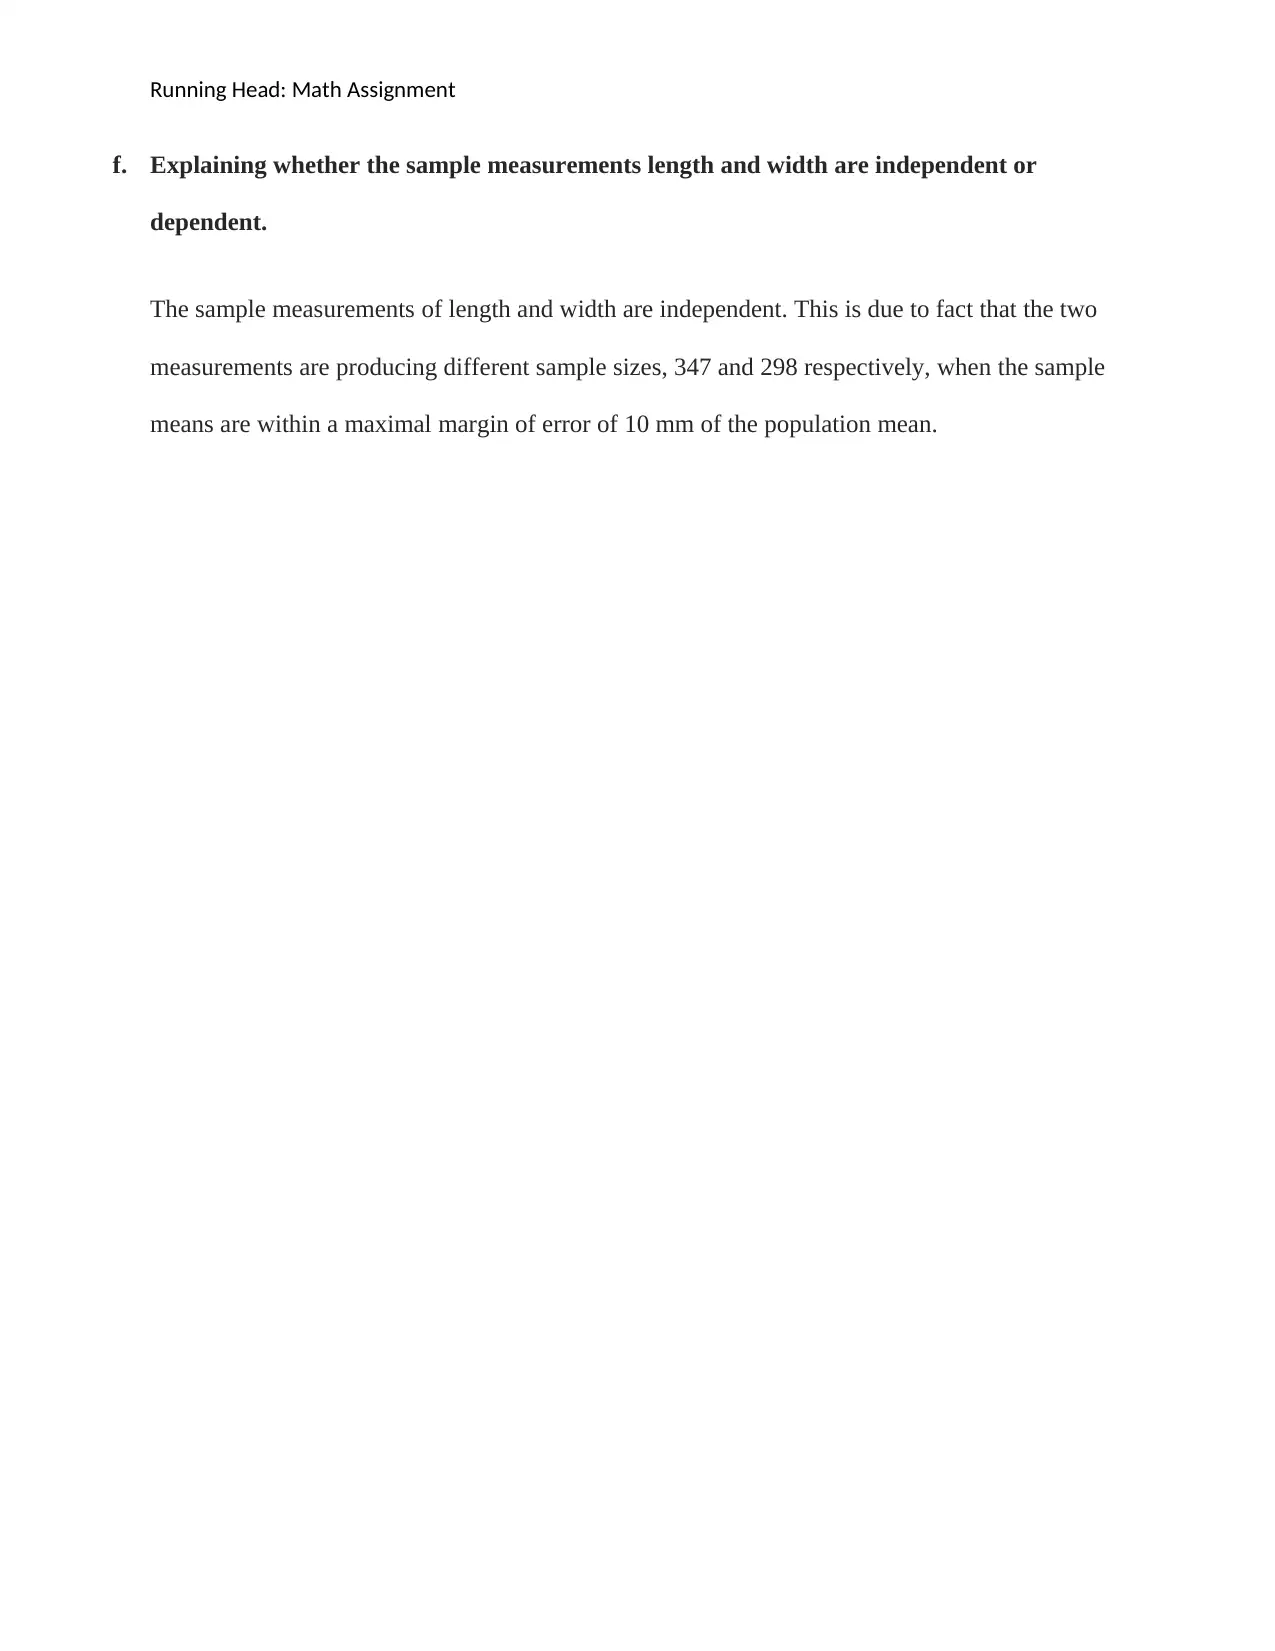
This math assignment focuses on statistical analysis using data related to littleneck clams. The solution begins by calculating the sample mean, standard deviation, and coefficient of variation for both length and width measurements. It then proceeds to determine 95% confidence intervals for the population mean length and width. The assignment further explores the calculation of required sample sizes to achieve a specific margin of error for the sample mean length and width. Finally, the assignment concludes with an explanation of the independence of the sample measurements of length and width. The solution utilizes relevant statistical formulas and concepts to address the problems presented.

Running Head: Math Assignment
Mathematics assignment
Student’s name
Institution Affiliation
Mathematics assignment
Student’s name
Institution Affiliation
Paraphrase This Document
Need a fresh take? Get an instant paraphrase of this document with our AI Paraphraser

Running Head: Math Assignment
Question
Data:
a. Using a calculator to compute the sample mean and sample standard deviation for the
lengths and widths. Compute the coefficient of variation for each.
According to Francis (2004) the mean x of a given set of data is given by
x= ∑ xi
n , where n=sample ¿ xi are values of thedata set
Therefore, mean for lengths and widths, will be:
Mean Length
x= ∑ xl
n =15344
35
¿ 438.4 mm
Mean Width
x= ∑ xw
n =13427
35

Running Head: Math Assignment
¿ 383.6 mm ( 1 d . p )
The standard deviation , s of set of data is given by
s= √ ∑ x2
n − ( x )2 , ( Francis, 2004 , p .138 )
where x2=square of values of the data set
Standard deviation for length
sL= √ 7042634
35 − ( 438.4 )2
¿ √ 201218.1−192194.6
¿ √ 9023.554
¿ 94.99
Standard deviation for Width
sW = √ 5422653
35 − ( 383.6 )2
¿ √ 154932.9−147170.9
⊘ This is a preview!⊘
Do you want full access?
Subscribe today to unlock all pages.

Trusted by 1+ million students worldwide

Running Head: Math Assignment
¿ √7762.02
¿ 88.10
Coefficient of variation
According to Francis (2004, p.143), the coefficient of variation, S is given by the formula
S= Standard Deviation
Mean ∗100 %
Coefficient of variation for length
S= 94.99
438.4∗100 %
¿ 21.67 %
Coefficient of variation for width
S= 88.10
383 .6∗100 %
¿ 22.97 %
Paraphrase This Document
Need a fresh take? Get an instant paraphrase of this document with our AI Paraphraser

Running Head: Math Assignment
b. Computing a 95% confidence interval for the population mean length of all Garrison
Bay littleneck clams.
According to Rumsey (2007), the 95% confidence interval for the mean is given by
x ± z∗s
√n , where, x=sample mean , s=sample standard deviation ,
n=sample ¿ 35 ,
¿ z−value at 95 % confidence interval=1.96 (¿ tables)
The 95% confidence interval for length
x ± z∗s
√n =438.4 ±1.96∗( 94.99
√35 )
¿ 438.4 ±31.47
Therefore, the 95% confidence interval for length will be (406.93, 469.87)
c. Determination of the sample size if one is 95% sure that the sample mean length is
within a maximal margin of error of 10 mm of the population mean length
The marginal error, ME, is given by the formula
ME= z∗s
√n
10=1.96∗
( 94.99
√n )

Running Head: Math Assignment
Divide both sides by 1.96
5.10204= 94.99
√ n
Multiply both sides by √n
5.10204 √n=94.99
√n= 94.99
5.10204
n=( 94.99
5.10204 )
2
¿ 346.6489
≈ 347 , this isthe sample ¿ ¿
Then, 347−35=312
Hence, in this case, the sample will require 312 more littleneck clams.
d. The 95% confidence interval for width
x ± z∗s
√ n =383.6 ± 1.96∗
( 88.10
√ 35 )
¿ 383.6 ± 29.19
Therefore, the 95% confidence interval for width will be (354.44, 412.82)
⊘ This is a preview!⊘
Do you want full access?
Subscribe today to unlock all pages.

Trusted by 1+ million students worldwide

Running Head: Math Assignment
e. Determination of the sample size if one is 95% sure that the sample means width is within a
maximal margin of error of 10 mm of the population mean width.
The marginal error, ME, is given by the formula
ME= z∗s
√n , n=sample ¿ ¿
10=1.96∗
( 88.10
√n )
Divide both sides by 1.96
5.10204=( 88.10
√n )
Multiply both sides by the √n
5.10204 √n=88.10
√n= 88.10
5.10204
n=( 88.10
5.10204 )
2
=298.1874
≈ 298
Hence, the sample size is 298
Then, 298−35=263
Therefore, in this case, the sample requires 263 more littleneck clams.
Paraphrase This Document
Need a fresh take? Get an instant paraphrase of this document with our AI Paraphraser

Running Head: Math Assignment
f. Explaining whether the sample measurements length and width are independent or
dependent.
The sample measurements of length and width are independent. This is due to fact that the two
measurements are producing different sample sizes, 347 and 298 respectively, when the sample
means are within a maximal margin of error of 10 mm of the population mean.

Running Head: Math Assignment
References
Francis, A. (2004). Business mathematics and statistics. Cengage Learning EMEA.
Rumsey, D. J. (2007). Intermediate statistics for dummies. John Wiley & Sons.
References
Francis, A. (2004). Business mathematics and statistics. Cengage Learning EMEA.
Rumsey, D. J. (2007). Intermediate statistics for dummies. John Wiley & Sons.
⊘ This is a preview!⊘
Do you want full access?
Subscribe today to unlock all pages.

Trusted by 1+ million students worldwide
1 out of 9
Related Documents

Your All-in-One AI-Powered Toolkit for Academic Success.
+13062052269
info@desklib.com
Available 24*7 on WhatsApp / Email
Unlock your academic potential
Copyright © 2020–2025 A2Z Services. All Rights Reserved. Developed and managed by ZUCOL.