Statistics Assignment: Mean, Standard Deviation, Quartiles

Verified

Added on  2019/12/28

|16
|2450
|273
Homework Assignment
AI Summary
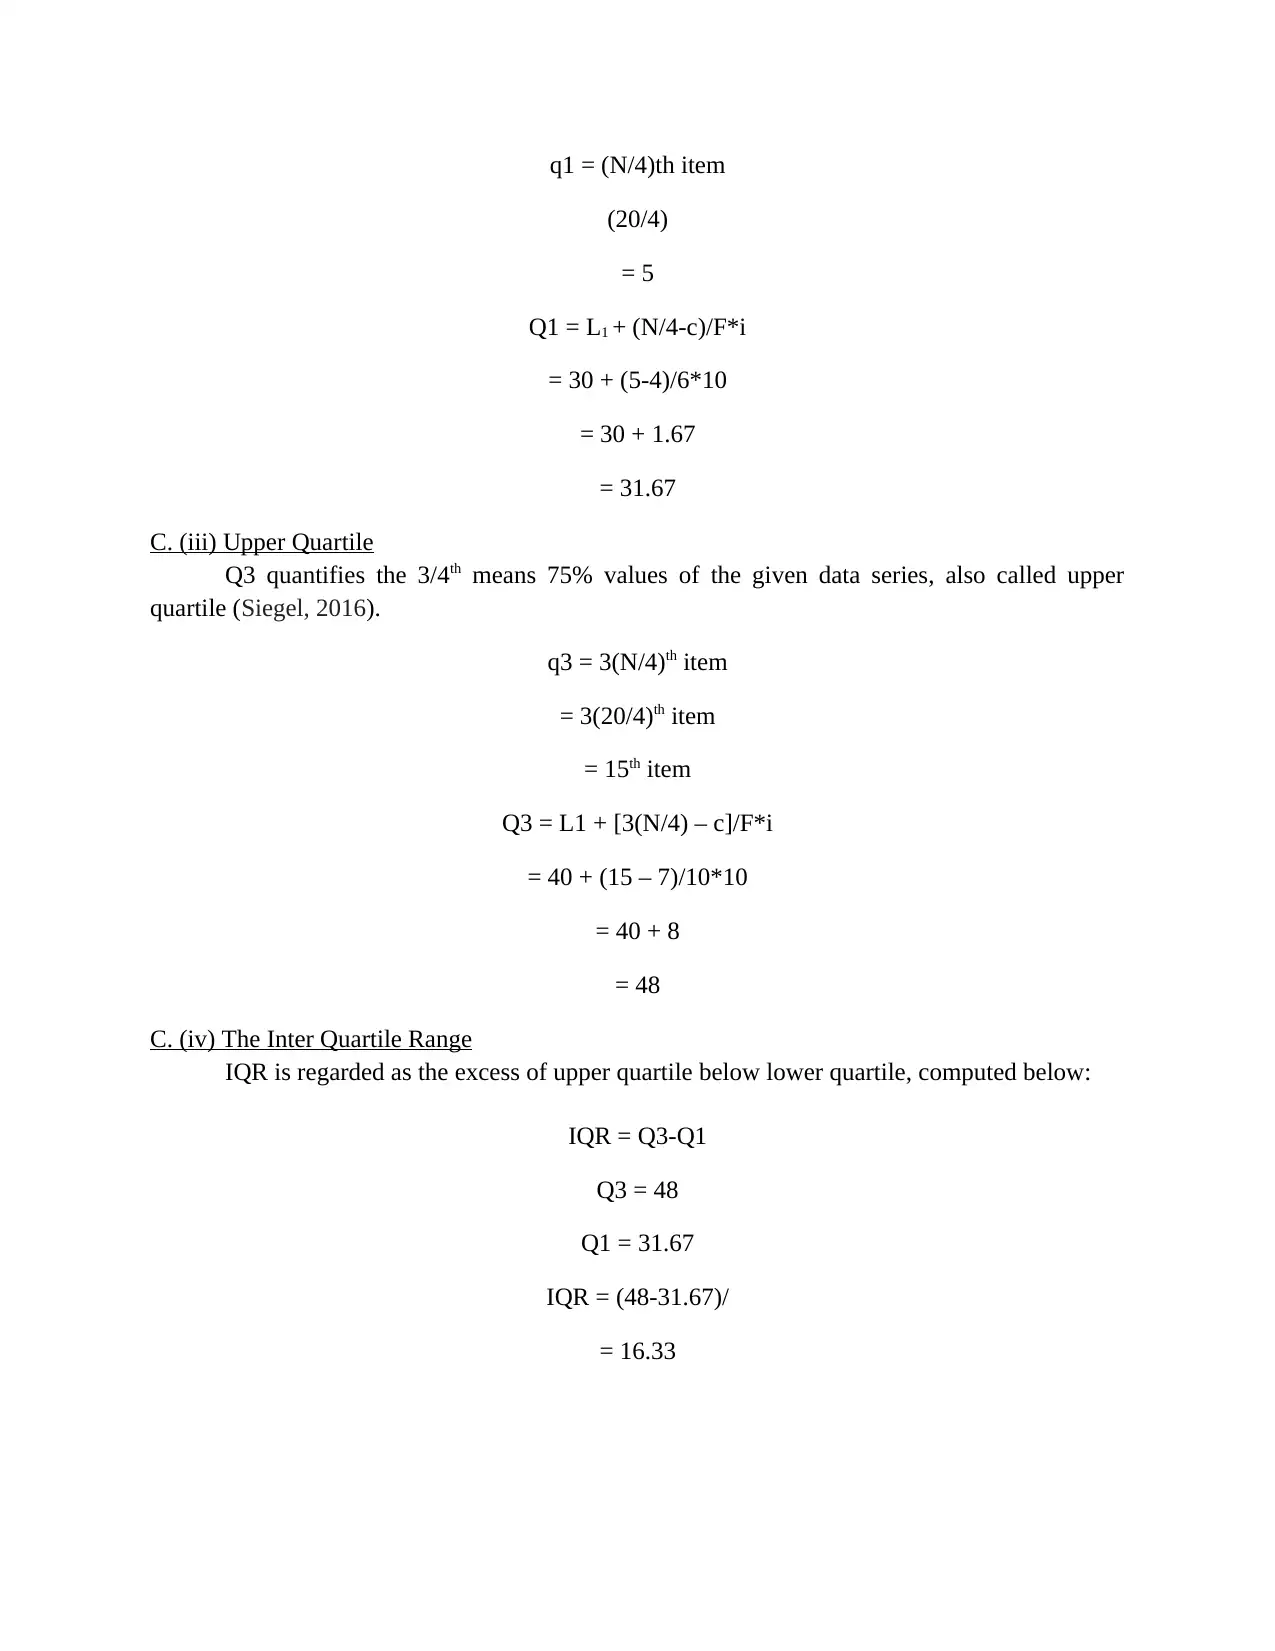
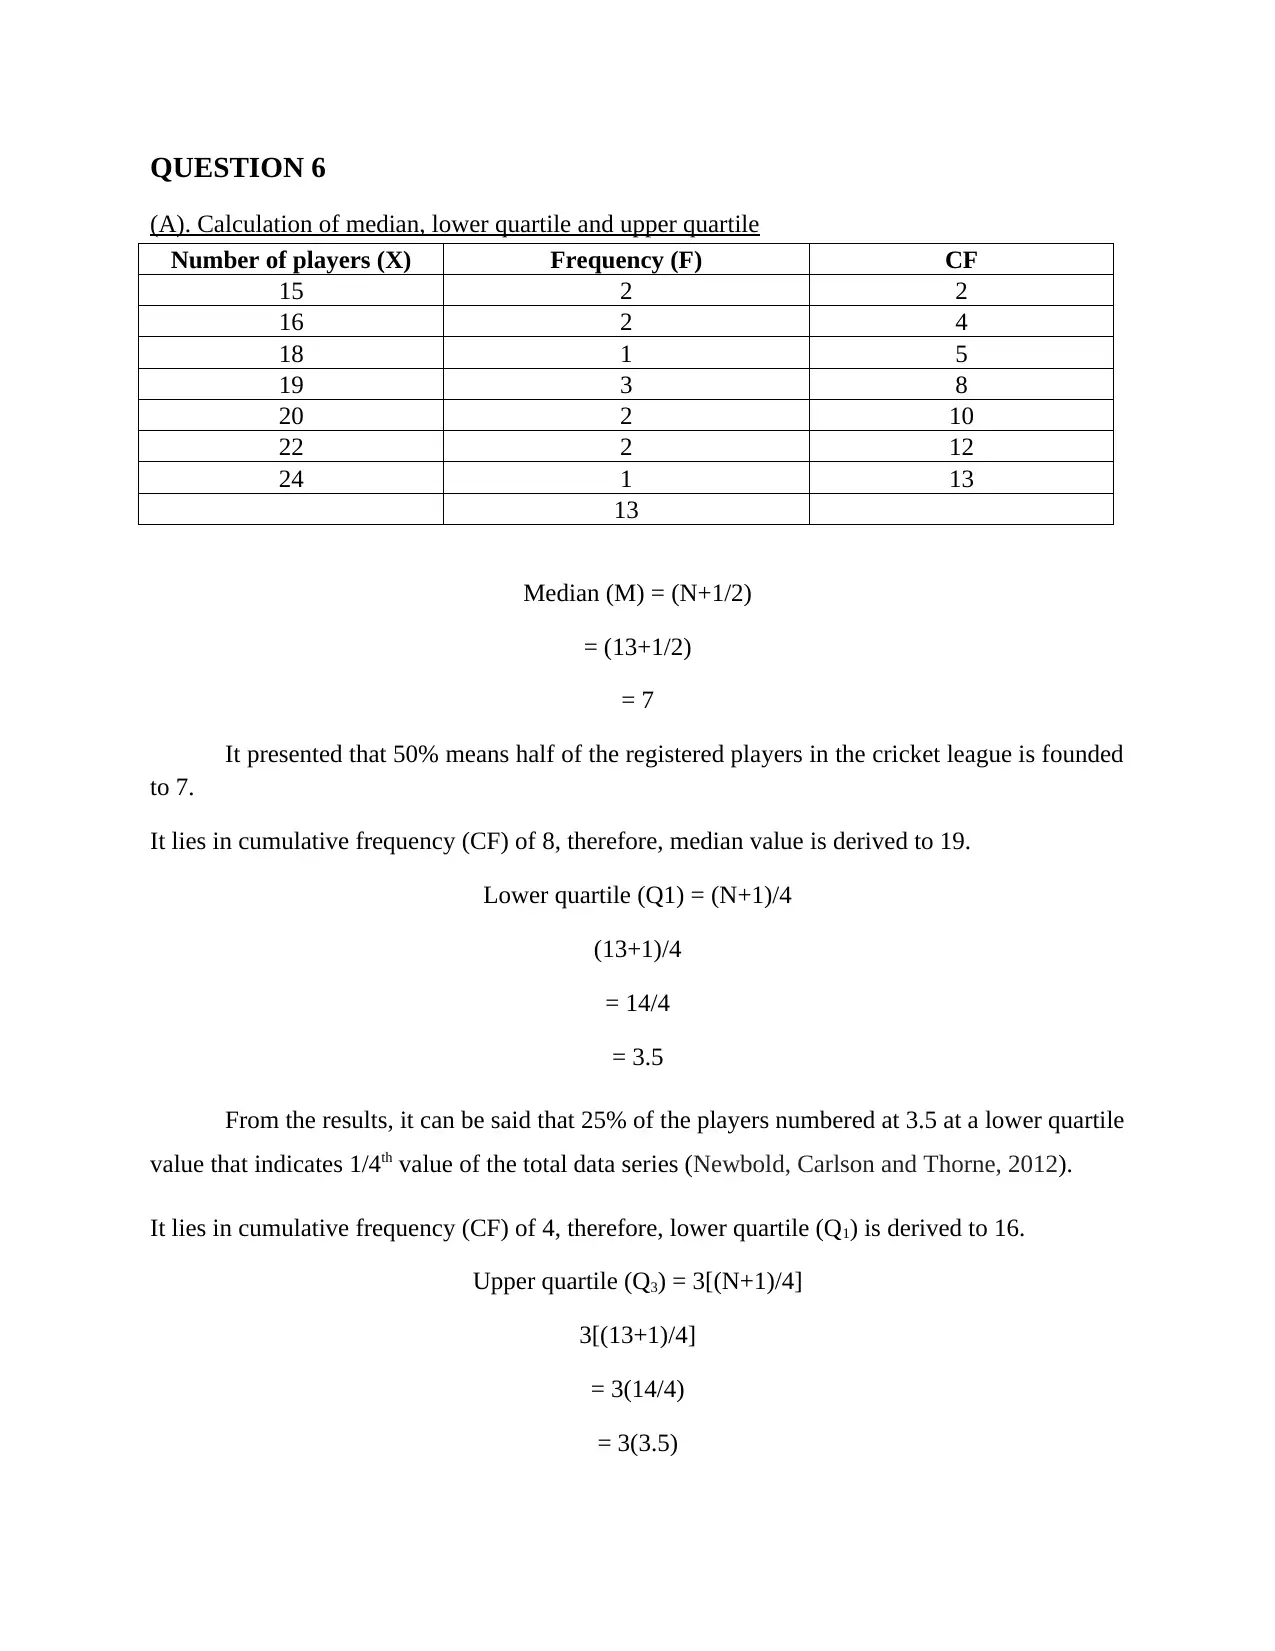
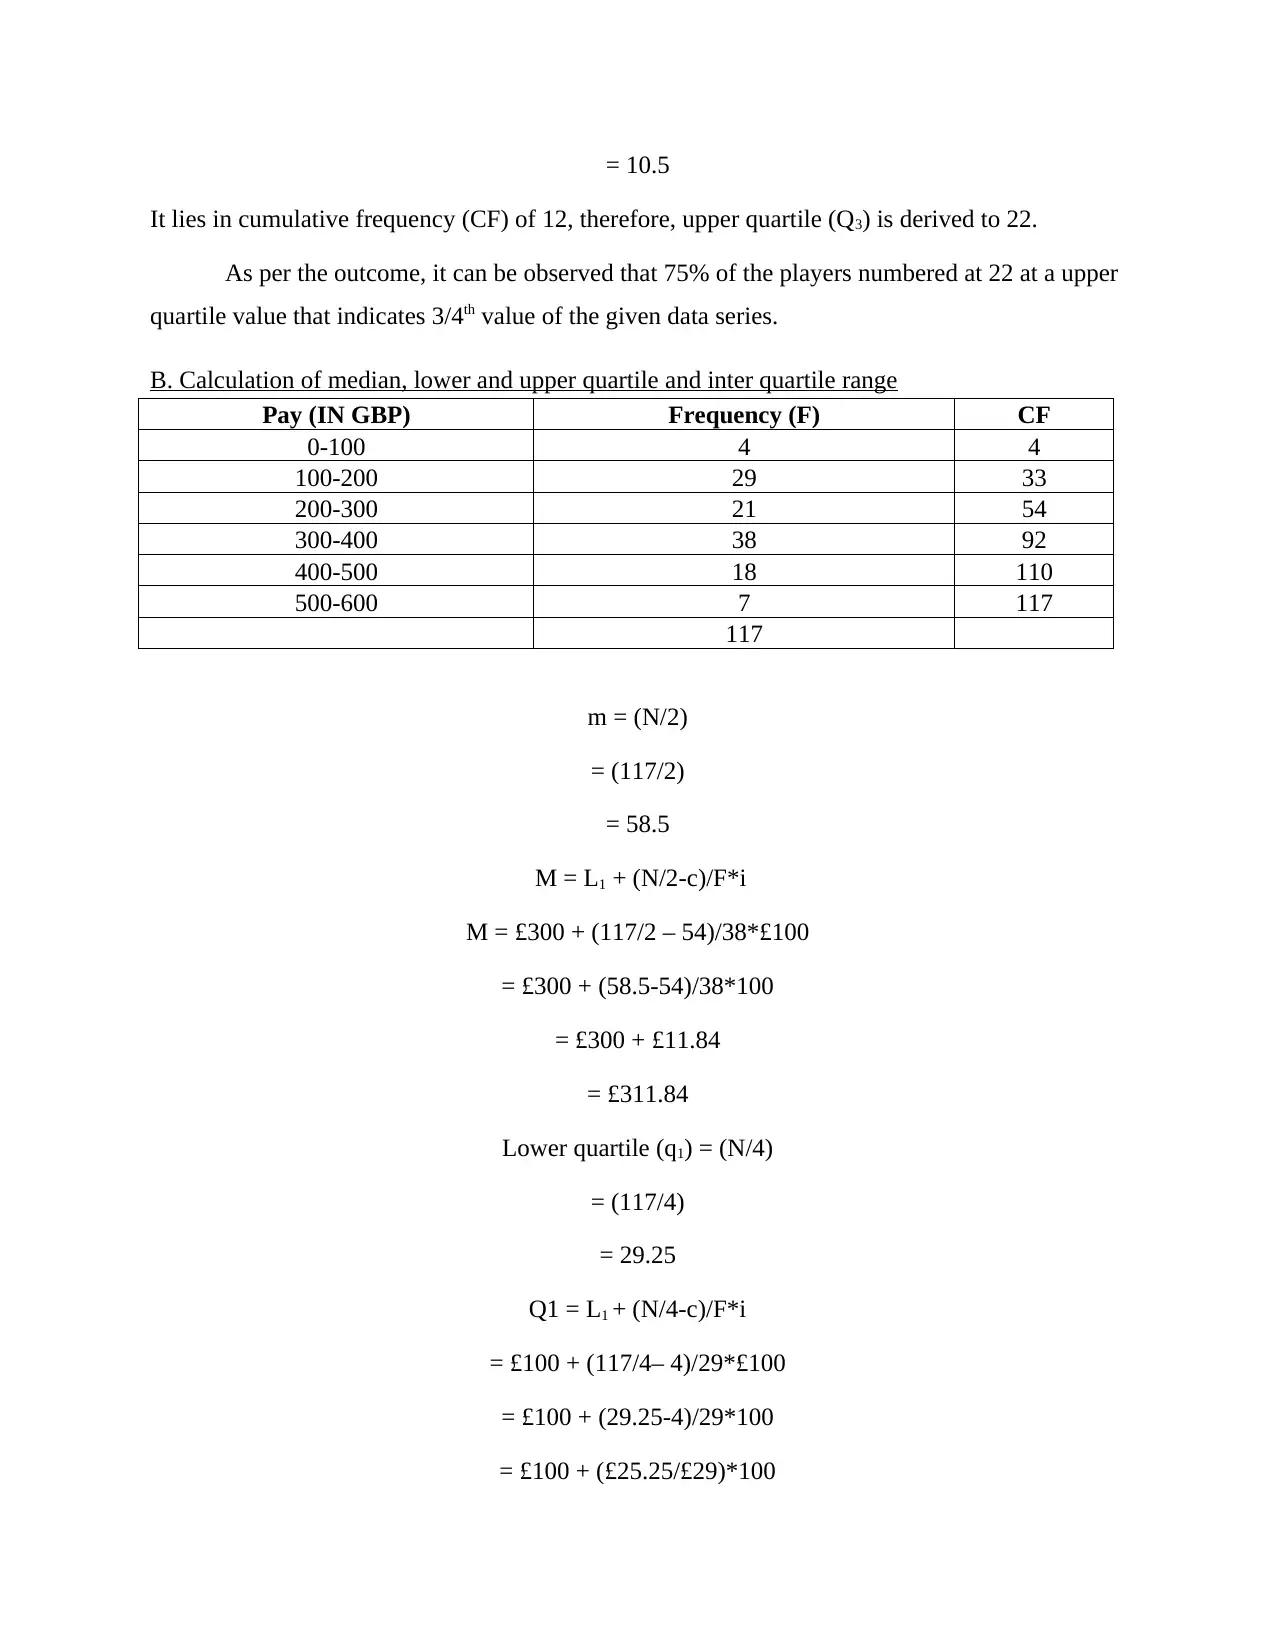
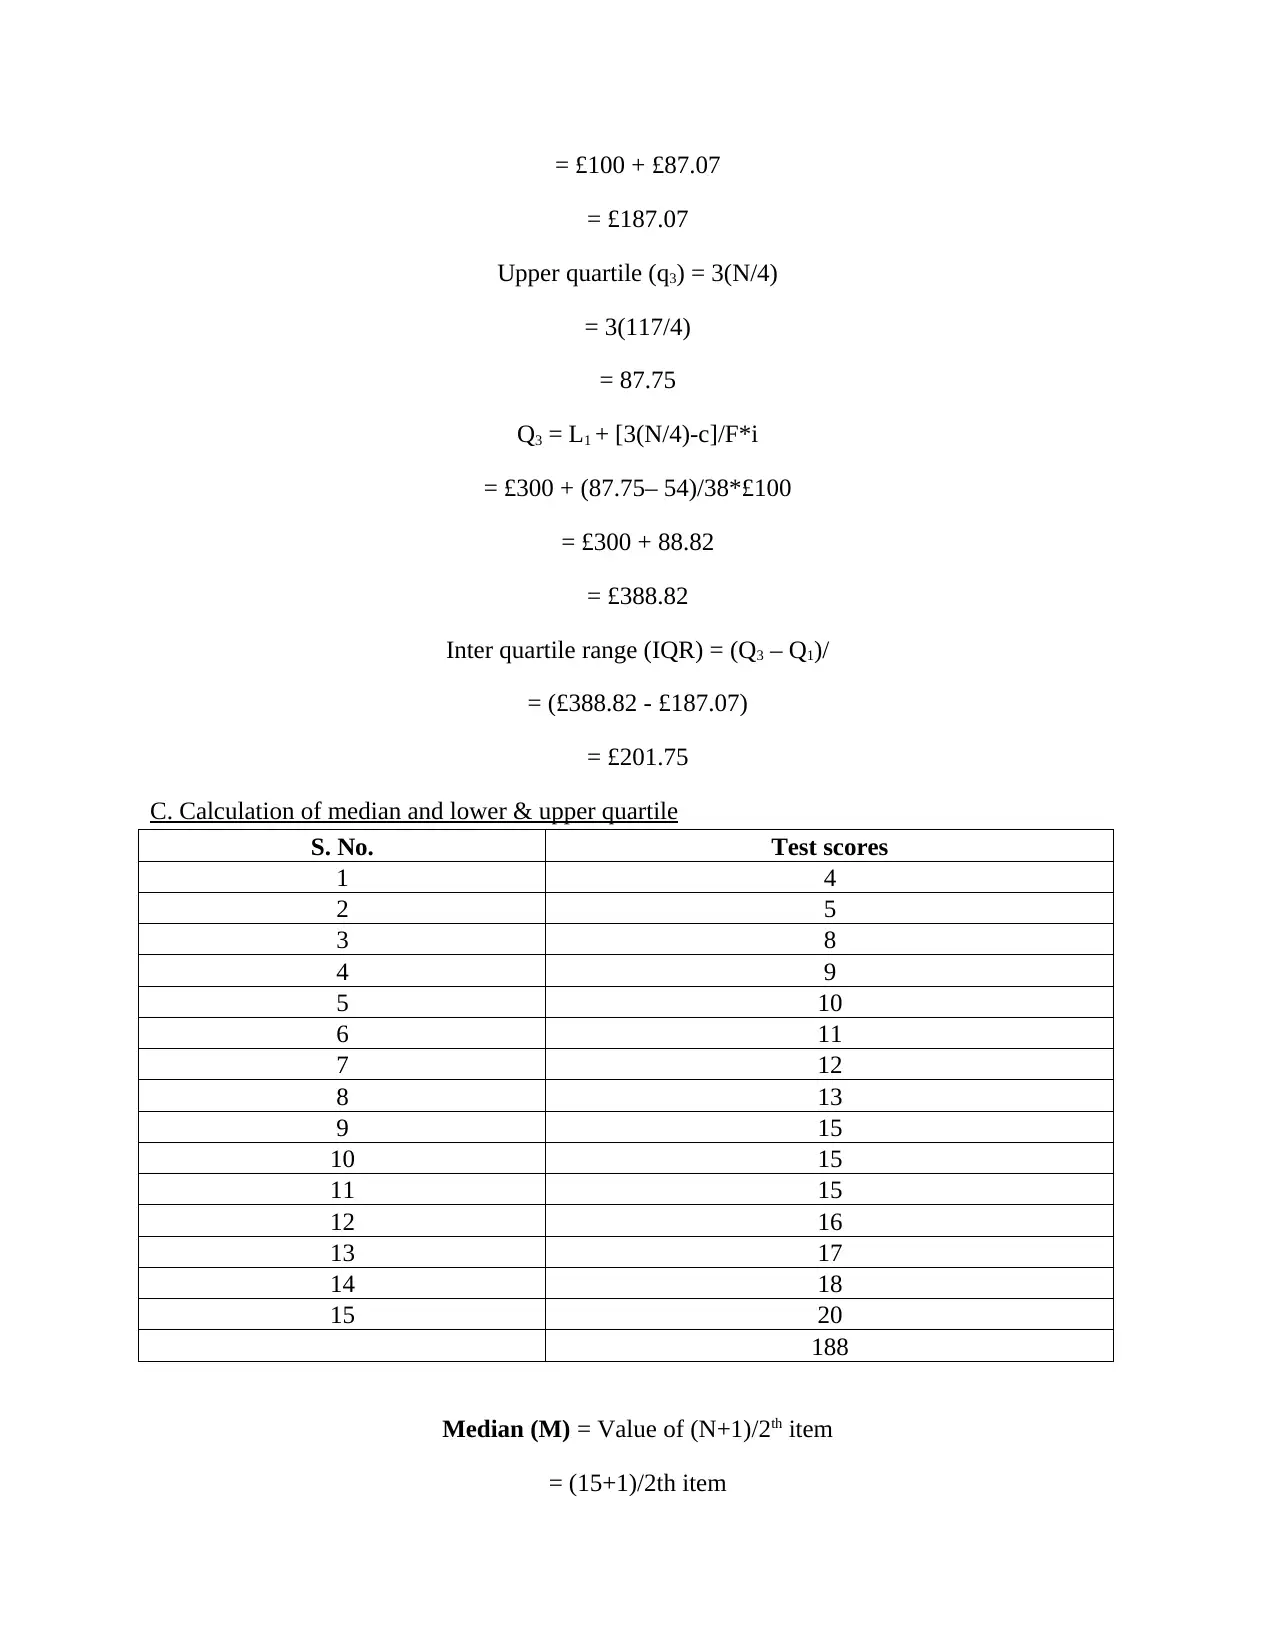
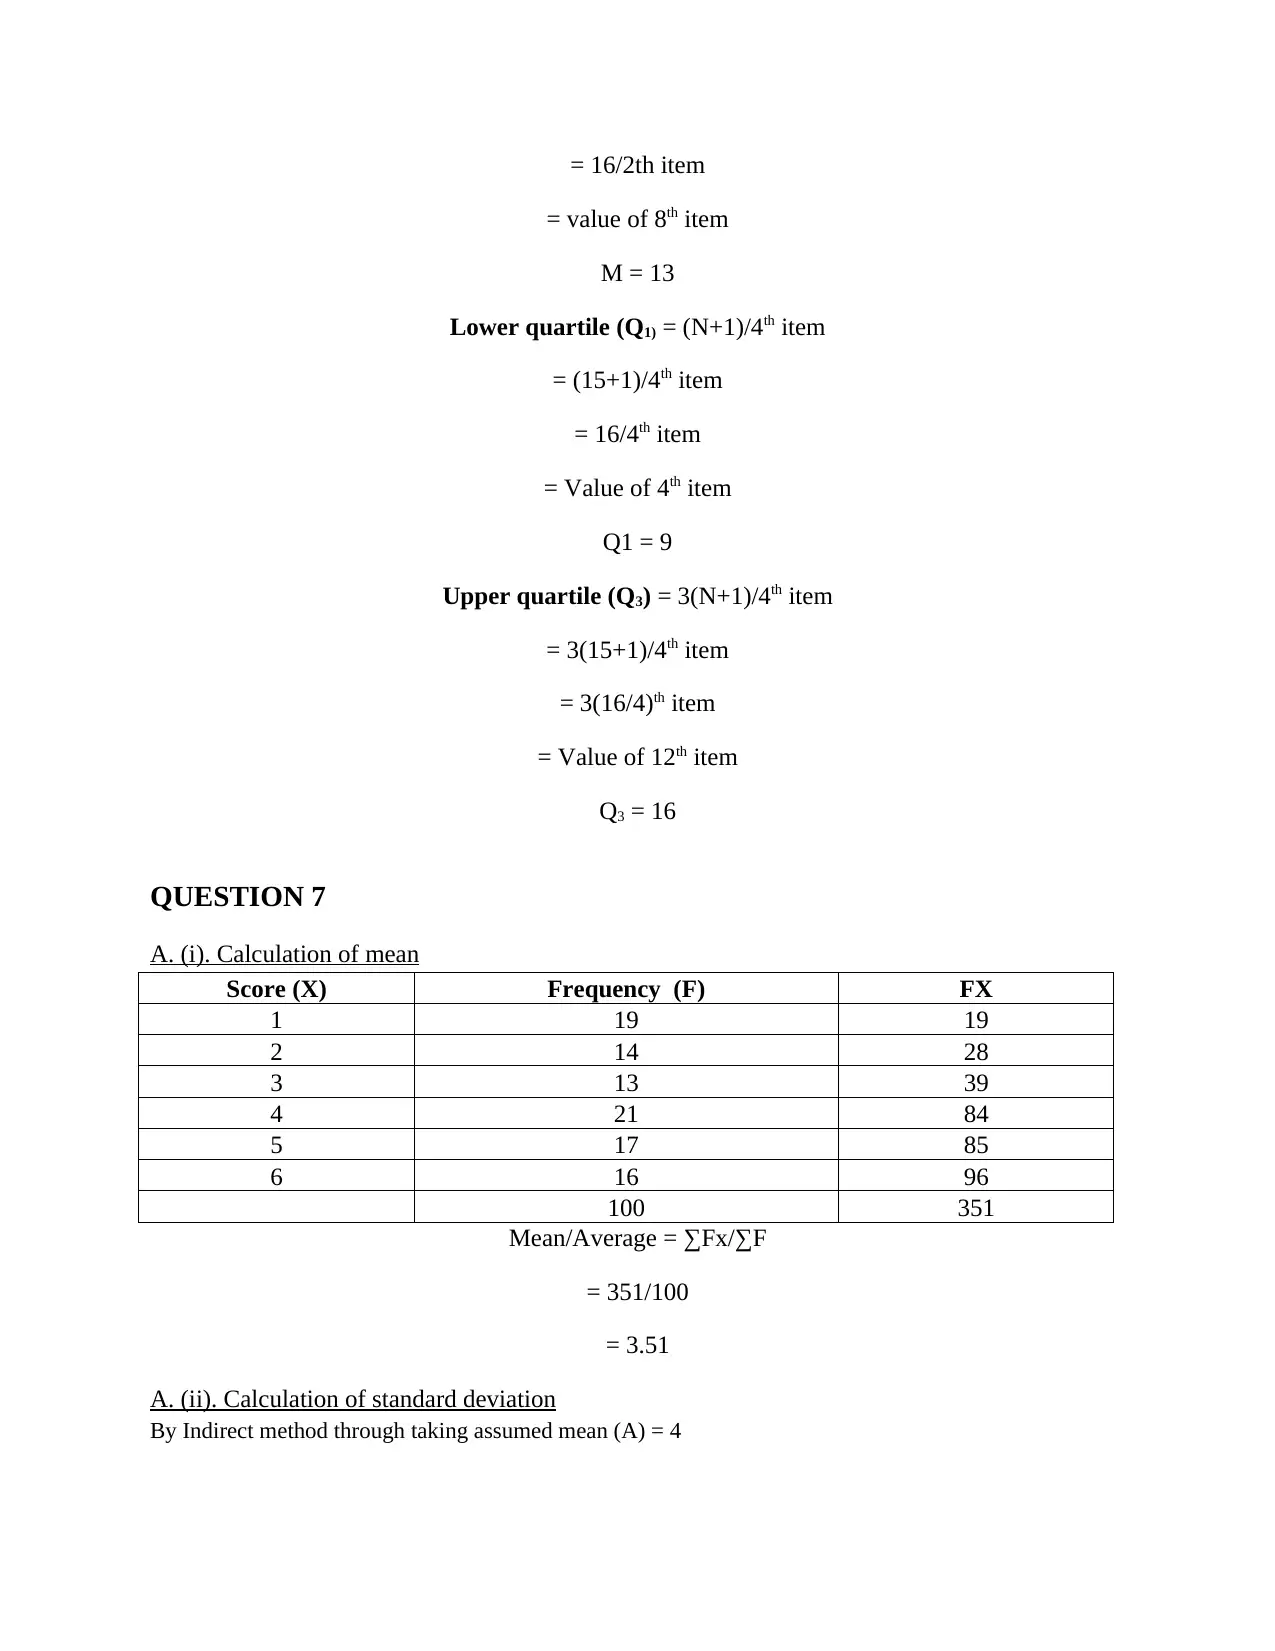
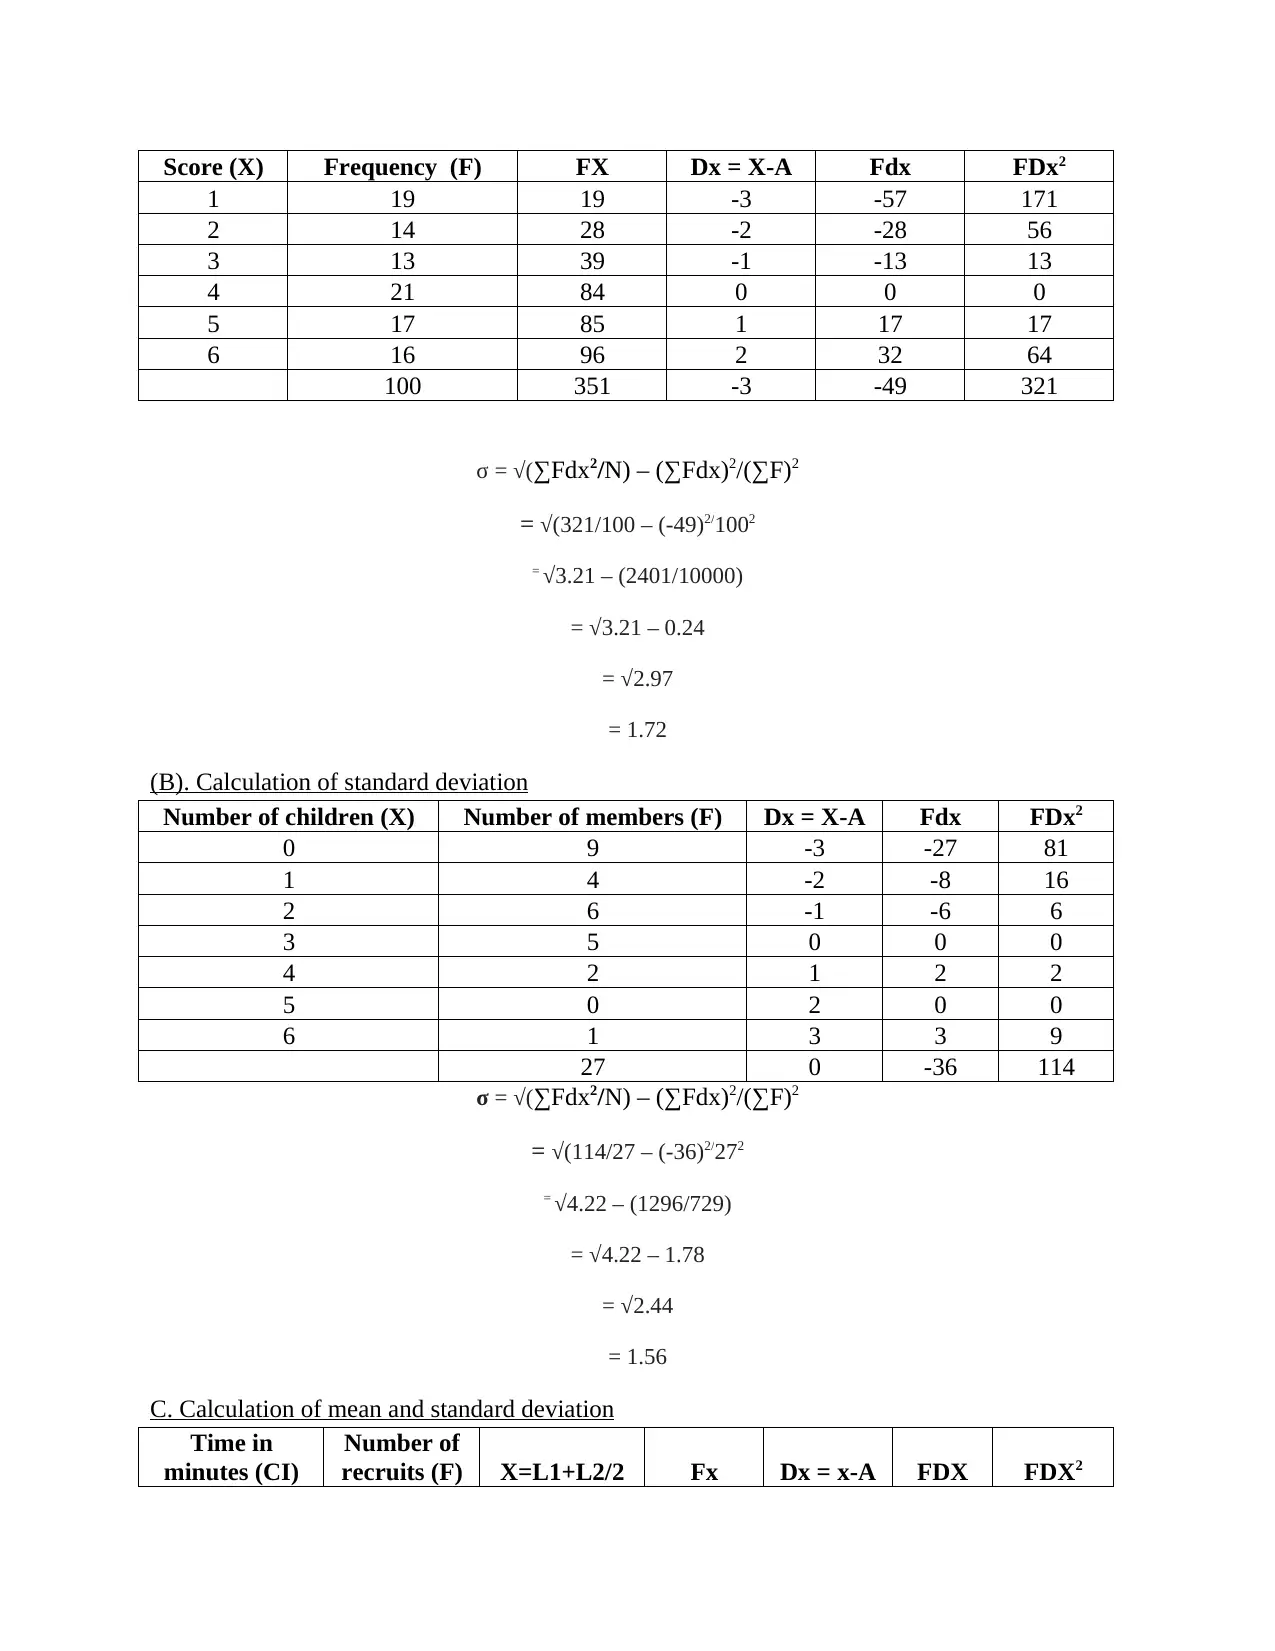
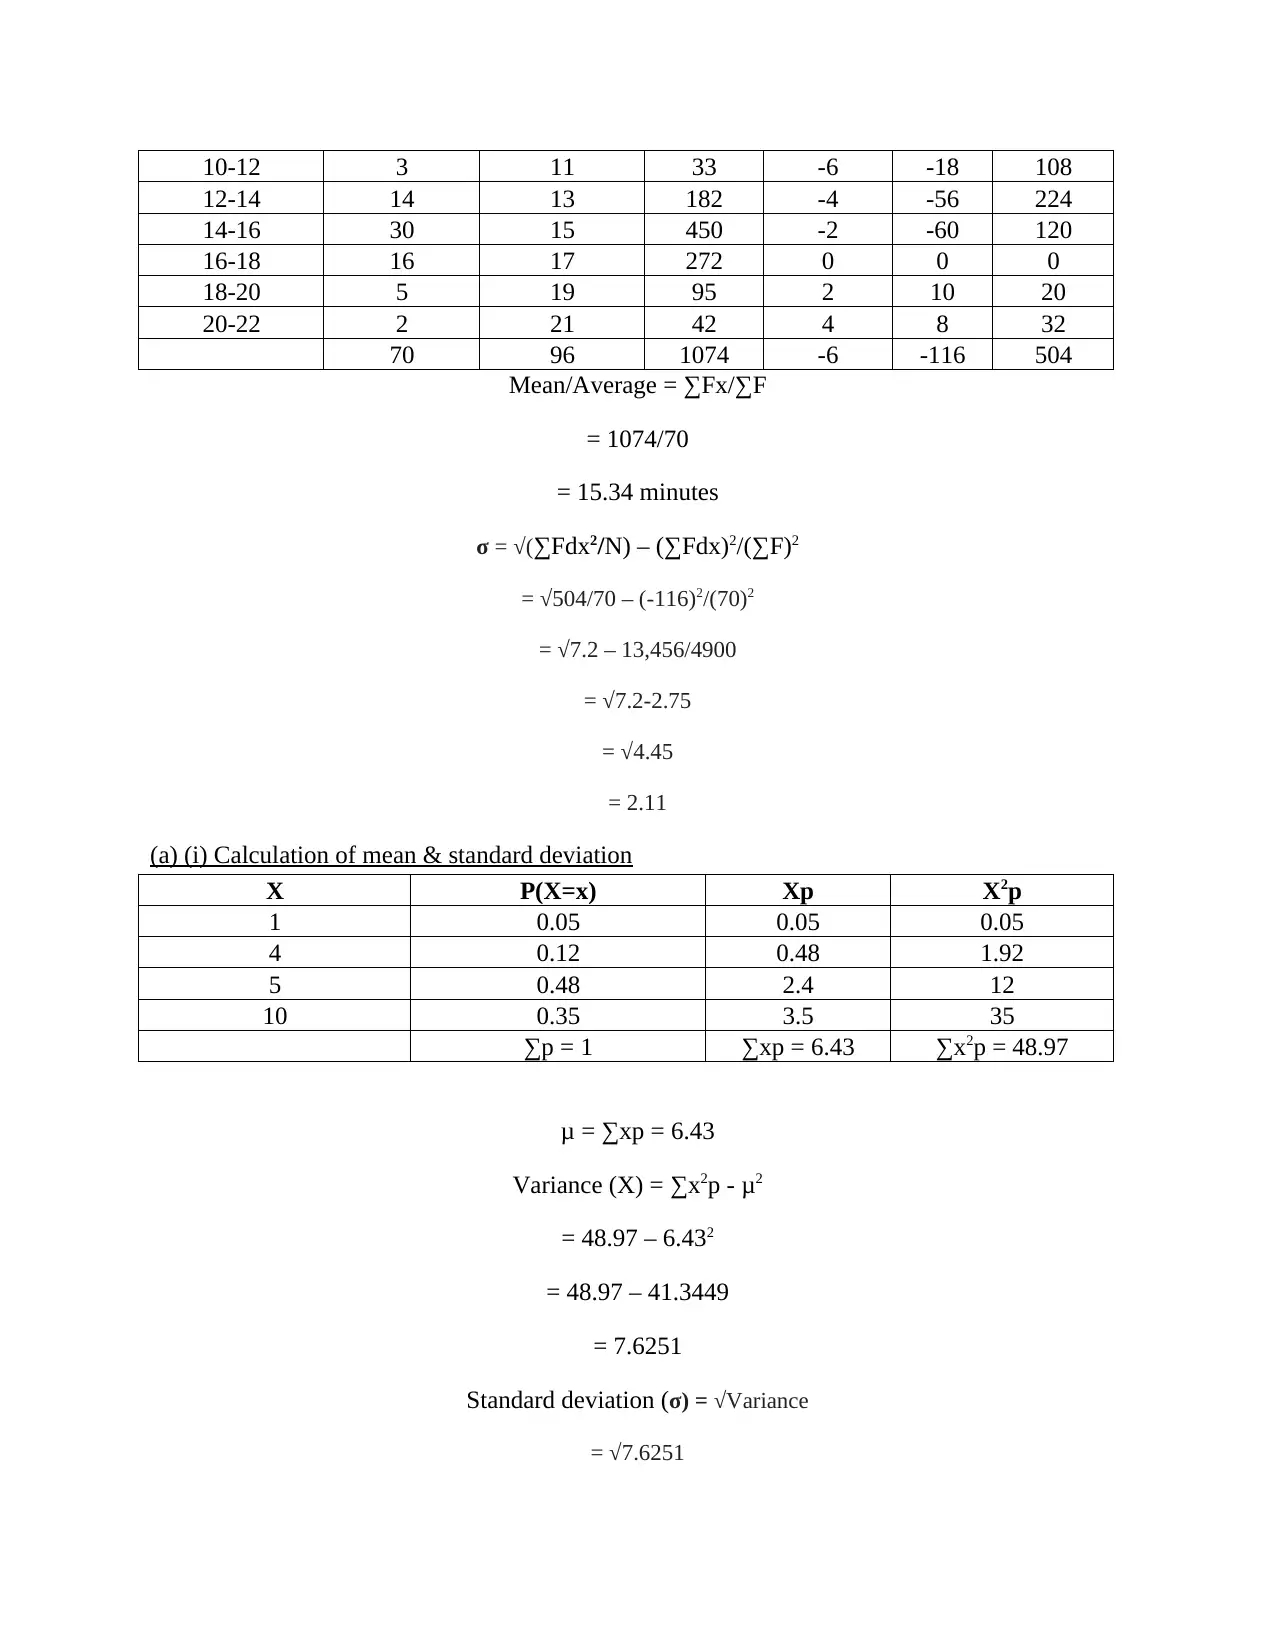
This statistics assignment solution covers various aspects of data analysis and probability. It begins with a histogram presentation and progresses to cumulative frequency calculations, including the creation of a cumulative frequency graph. The assignment delves into calculating the median, lower quartile, upper quartile, and interquartile range. It also involves calculating the mean and standard deviation using different methods, including direct and indirect methods, and applying these calculations to various datasets. The solution includes comparisons of data, such as the breaking strength of ropes, and provides recommendations based on the statistical findings. The document uses examples, tables, and formulas to illustrate the concepts and calculations, providing a comprehensive guide for students studying statistics.
Document Page
MATHS
tabler-icon-diamond-filled.svg

Paraphrase This Document

Need a fresh take? Get an instant paraphrase of this document with our AI Paraphraser
Document Page
Table of Contents
QUESTION 4.................................................................................................................................................3
2.1 Histogram presentation........................................................................................................................3
QUESTION 5.................................................................................................................................................4
A. Complete the cumulative frequency.....................................................................................................4
B. Cumulative frequency graph.................................................................................................................5
C. (i) Median.............................................................................................................................................5
C. (ii) Lower quartile.................................................................................................................................5
C. (iii) Upper Quartile................................................................................................................................6
C. (iv) The Inter Quartile Range................................................................................................................6
QUESTION 6.................................................................................................................................................7
(A). Calculation of median, lower quartile and upper quartile..................................................................7
B. Calculation of median, lower and upper quartile and inter quartile range............................................8
C. Calculation of median and lower & upper quartile...............................................................................9
QUESTION 7...............................................................................................................................................10
A. (i). Calculation of mean......................................................................................................................10
A. (ii). Calculation of standard deviation.................................................................................................11
(B). Calculation of standard deviation.....................................................................................................11
C. Calculation of mean and standard deviation.......................................................................................12
(a) (i) Calculation of mean & standard deviation....................................................................................12
(d) (i) Calculation of mean and standard deviation.................................................................................13
QUESTION 8...............................................................................................................................................13
A. Calculation of mean and standard deviation.......................................................................................13
(1) Reduction in price by 12....................................................................................................................13
(ii) Reduction in price by 50%.................................................................................................................14
(iii) Mean and standard deviation............................................................................................................14
B. (i) Comparison of breaking strength of the ropes...............................................................................14
B. (ii) Recommendation...........................................................................................................................15
REFERENCES............................................................................................................................................16
Document Page
QUESTION 4
2.1 Histogram presentation
Frequency distribution
Mass (Gm) Frequency (F)
10-19 6
20-24 4
25-34 12
35-50 18
51-55 8
48
Bin Frequency
10-19 6
20-24 4
25-34 12
35-50 18
51-55 8
10-19 20-24 25-34 35-50 51-55
0
5
10
15
20
6 4
12
18
8
Histogram
Frequency
Bin
Frequency
Above histogram presents that majority of the objects have a mass under the range of 35-
50 gms because its frequency is founded greatest to 18. However, it is founded lowest to 4 for
the mass weight of 20 – 24 gms.
Document Page
QUESTION 5
A. Complete the cumulative frequency
Cumulative frequency is the continuing total frequency of the given data series.
Time Taken In
Minutes
Frequenc
y Cumulative frequency
Cumulative frequency
%
10-20 1 1 0
20-30 3 1 +3 = 4 5%
30-40 6 4 + 6 = 10 20%
40-50 7 10 + 7 = 17 50%
50-60 3 17 + 3 = 20 85%
20 20 + 20 = 40 100%
tabler-icon-diamond-filled.svg

Paraphrase This Document

Need a fresh take? Get an instant paraphrase of this document with our AI Paraphraser
Document Page
B. Cumulative frequency graph
0 10-20 20-30 30-40 40-50 50-60
0%
25%
50%
75%
100%
Cumulative Frequency chart %
C. (i) Median
Median presents 50% value thus divides the data series into two-equal parts, one is below
median (50%) and other one part is above it (Berenson and et.al., 2012).
m = (N/2) Or (∑F/2)
= (20/2) = 10
M = L1 + (N/2-c)/F*i
= 30 + (10-4)/6*10
= 30 + 10
= 40
C. (ii) Lower quartile
Q1 quantifies the 1/4th means 25% values of the given data series, also called lower
quartile (Jaggia and et.al., 2016).
Document Page
q1 = (N/4)th item
(20/4)
= 5
Q1 = L1 + (N/4-c)/F*i
= 30 + (5-4)/6*10
= 30 + 1.67
= 31.67
C. (iii) Upper Quartile
Q3 quantifies the 3/4th means 75% values of the given data series, also called upper
quartile (Siegel, 2016).
q3 = 3(N/4)th item
= 3(20/4)th item
= 15th item
Q3 = L1 + [3(N/4) – c]/F*i
= 40 + (15 – 7)/10*10
= 40 + 8
= 48
C. (iv) The Inter Quartile Range
IQR is regarded as the excess of upper quartile below lower quartile, computed below:
IQR = Q3-Q1
Q3 = 48
Q1 = 31.67
IQR = (48-31.67)/
= 16.33
Document Page
QUESTION 6
(A). Calculation of median, lower quartile and upper quartile
Number of players (X) Frequency (F) CF
15 2 2
16 2 4
18 1 5
19 3 8
20 2 10
22 2 12
24 1 13
13
Median (M) = (N+1/2)
= (13+1/2)
= 7
It presented that 50% means half of the registered players in the cricket league is founded
to 7.
It lies in cumulative frequency (CF) of 8, therefore, median value is derived to 19.
Lower quartile (Q1) = (N+1)/4
(13+1)/4
= 14/4
= 3.5
From the results, it can be said that 25% of the players numbered at 3.5 at a lower quartile
value that indicates 1/4th value of the total data series (Newbold, Carlson and Thorne, 2012).
It lies in cumulative frequency (CF) of 4, therefore, lower quartile (Q1) is derived to 16.
Upper quartile (Q3) = 3[(N+1)/4]
3[(13+1)/4]
= 3(14/4)
= 3(3.5)
tabler-icon-diamond-filled.svg

Paraphrase This Document

Need a fresh take? Get an instant paraphrase of this document with our AI Paraphraser
Document Page
= 10.5
It lies in cumulative frequency (CF) of 12, therefore, upper quartile (Q3) is derived to 22.
As per the outcome, it can be observed that 75% of the players numbered at 22 at a upper
quartile value that indicates 3/4th value of the given data series.
B. Calculation of median, lower and upper quartile and inter quartile range
Pay (IN GBP) Frequency (F) CF
0-100 4 4
100-200 29 33
200-300 21 54
300-400 38 92
400-500 18 110
500-600 7 117
117
m = (N/2)
= (117/2)
= 58.5
M = L1 + (N/2-c)/F*i
M = £300 + (117/2 – 54)/38*£100
= £300 + (58.5-54)/38*100
= £300 + £11.84
= £311.84
Lower quartile (q1) = (N/4)
= (117/4)
= 29.25
Q1 = L1 + (N/4-c)/F*i
= £100 + (117/4– 4)/29*£100
= £100 + (29.25-4)/29*100
= £100 + (£25.25/£29)*100
Document Page
= £100 + £87.07
= £187.07
Upper quartile (q3) = 3(N/4)
= 3(117/4)
= 87.75
Q3 = L1 + [3(N/4)-c]/F*i
= £300 + (87.75– 54)/38*£100
= £300 + 88.82
= £388.82
Inter quartile range (IQR) = (Q3 – Q1)/
= (£388.82 - £187.07)
= £201.75
C. Calculation of median and lower & upper quartile
S. No. Test scores
1 4
2 5
3 8
4 9
5 10
6 11
7 12
8 13
9 15
10 15
11 15
12 16
13 17
14 18
15 20
188
Median (M) = Value of (N+1)/2th item
= (15+1)/2th item
Document Page
= 16/2th item
= value of 8th item
M = 13
Lower quartile (Q1) = (N+1)/4th item
= (15+1)/4th item
= 16/4th item
= Value of 4th item
Q1 = 9
Upper quartile (Q3) = 3(N+1)/4th item
= 3(15+1)/4th item
= 3(16/4)th item
= Value of 12th item
Q3 = 16
QUESTION 7
A. (i). Calculation of mean
Score (X) Frequency (F) FX
1 19 19
2 14 28
3 13 39
4 21 84
5 17 85
6 16 96
100 351
Mean/Average = ∑Fx/∑F
= 351/100
= 3.51
A. (ii). Calculation of standard deviation
By Indirect method through taking assumed mean (A) = 4
tabler-icon-diamond-filled.svg

Paraphrase This Document

Need a fresh take? Get an instant paraphrase of this document with our AI Paraphraser
Document Page
Score (X) Frequency (F) FX Dx = X-A Fdx FDx2
1 19 19 -3 -57 171
2 14 28 -2 -28 56
3 13 39 -1 -13 13
4 21 84 0 0 0
5 17 85 1 17 17
6 16 96 2 32 64
100 351 -3 -49 321
σ = √(∑Fdx2/N) – (∑Fdx)2/(∑F)2
= √(321/100 – (-49)2/1002
= √3.21 – (2401/10000)
= √3.21 – 0.24
= √2.97
= 1.72
(B). Calculation of standard deviation
Number of children (X) Number of members (F) Dx = X-A Fdx FDx2
0 9 -3 -27 81
1 4 -2 -8 16
2 6 -1 -6 6
3 5 0 0 0
4 2 1 2 2
5 0 2 0 0
6 1 3 3 9
27 0 -36 114
σ = √(∑Fdx2/N) – (∑Fdx)2/(∑F)2
= √(114/27 – (-36)2/272
= √4.22 – (1296/729)
= √4.22 – 1.78
= √2.44
= 1.56
C. Calculation of mean and standard deviation
Time in
minutes (CI)
Number of
recruits (F) X=L1+L2/2 Fx Dx = x-A FDX FDX2
Document Page
10-12 3 11 33 -6 -18 108
12-14 14 13 182 -4 -56 224
14-16 30 15 450 -2 -60 120
16-18 16 17 272 0 0 0
18-20 5 19 95 2 10 20
20-22 2 21 42 4 8 32
70 96 1074 -6 -116 504
Mean/Average = ∑Fx/∑F
= 1074/70
= 15.34 minutes
σ = √(∑Fdx2/N) – (∑Fdx)2/(∑F)2
= √504/70 – (-116)2/(70)2
= √7.2 – 13,456/4900
= √7.2-2.75
= √4.45
= 2.11
(a) (i) Calculation of mean & standard deviation
X P(X=x) Xp X2p
1 0.05 0.05 0.05
4 0.12 0.48 1.92
5 0.48 2.4 12
10 0.35 3.5 35
∑p = 1 ∑xp = 6.43 ∑x2p = 48.97
μ = ∑xp = 6.43
Variance (X) = ∑x2p - μ2
= 48.97 – 6.432
= 48.97 – 41.3449
= 7.6251
Standard deviation (σ) = √Variance
= √7.6251
chevron_up_icon
1 out of 16
circle_padding
hide_on_mobile
zoom_out_icon