Statistics Homework: Analysis of Share Prices, Goods, and Probability

Verified

Added on  2023/01/13

|12
|745
|80
Homework Assignment
AI Summary
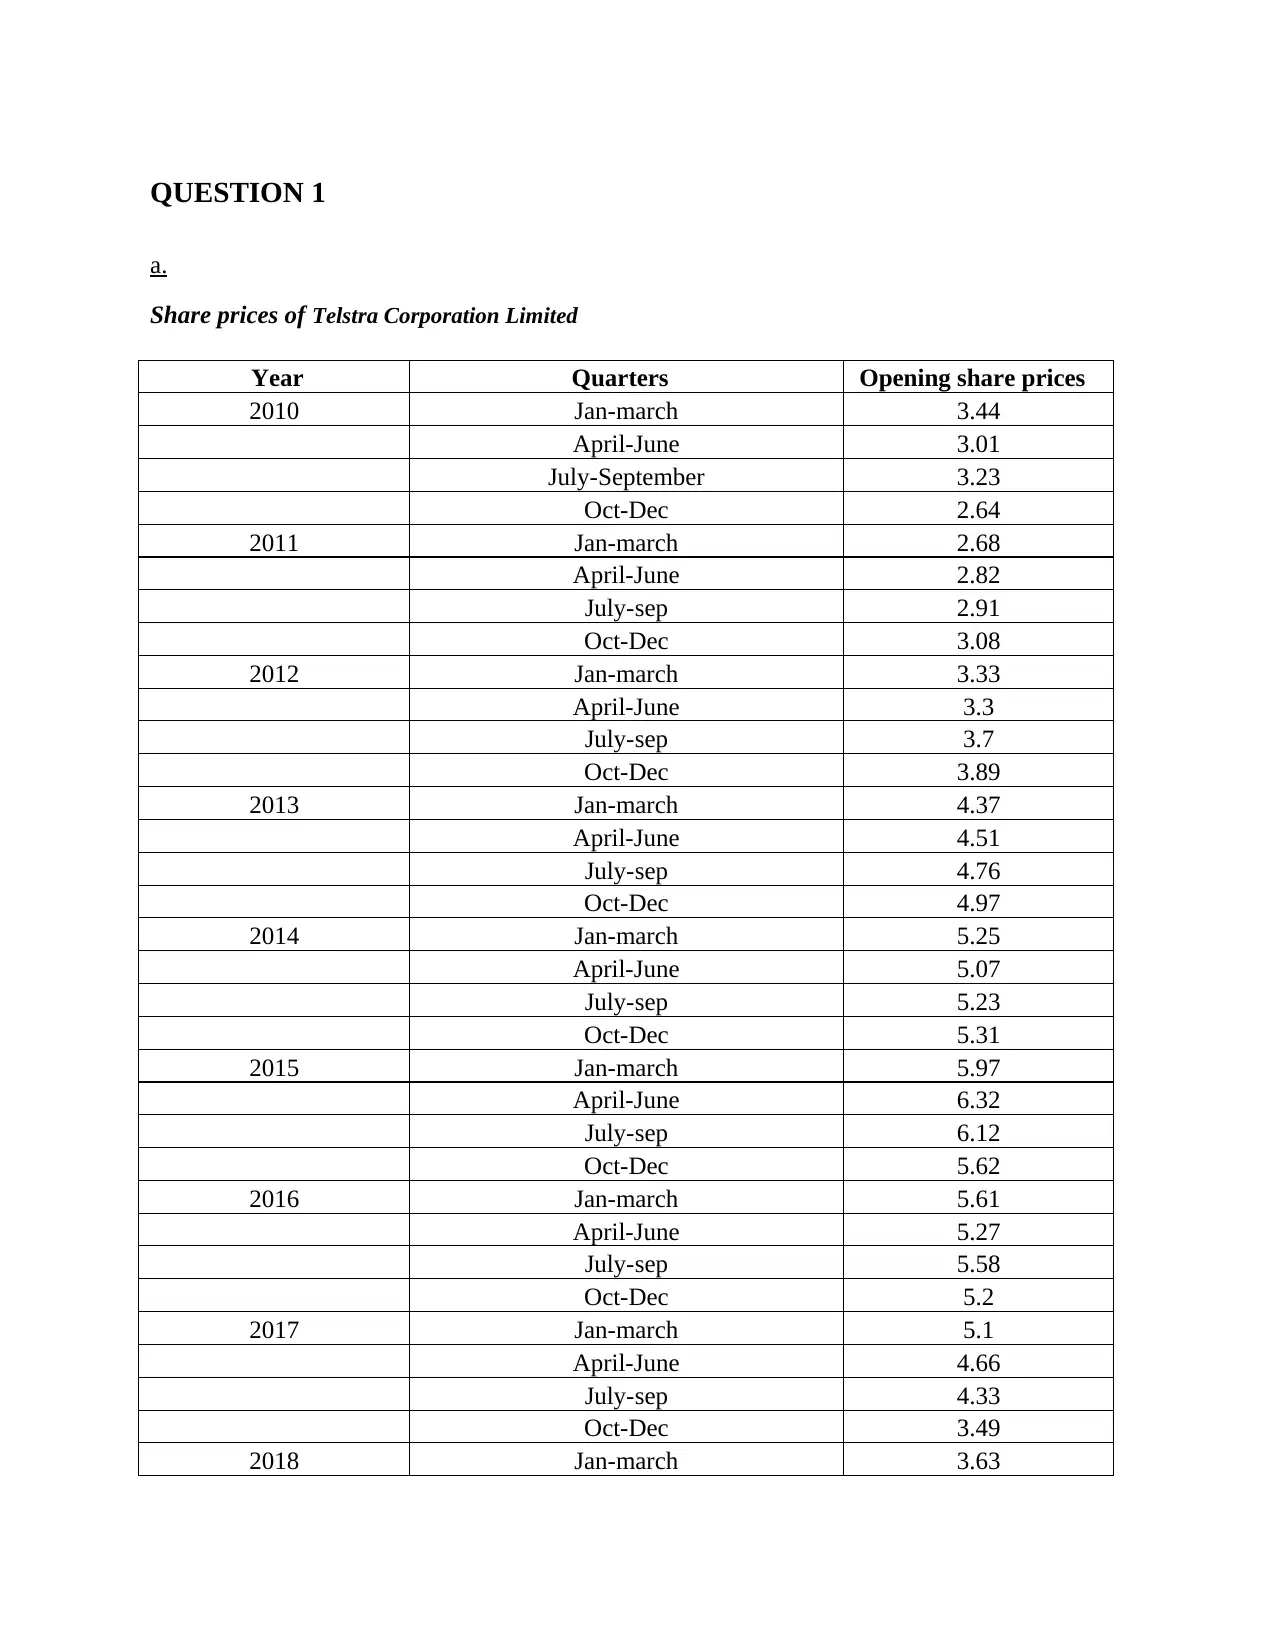
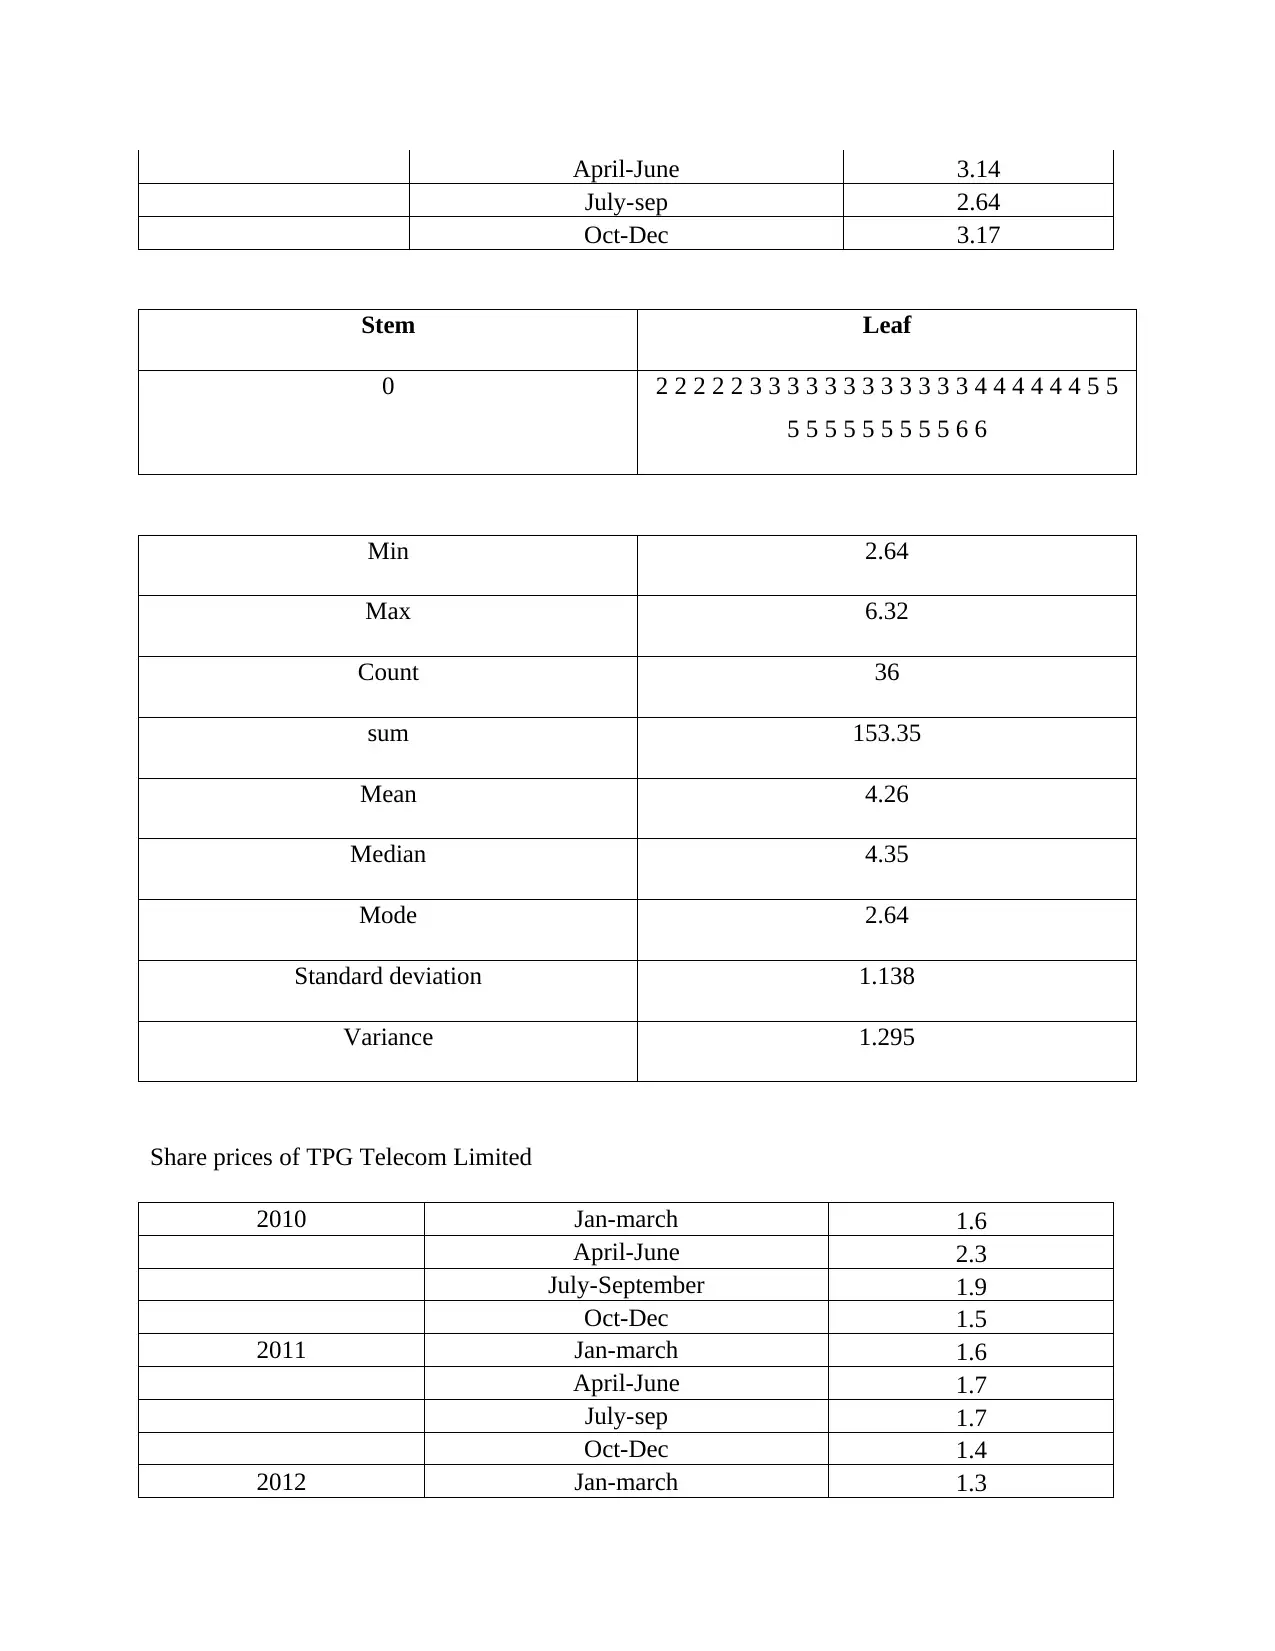
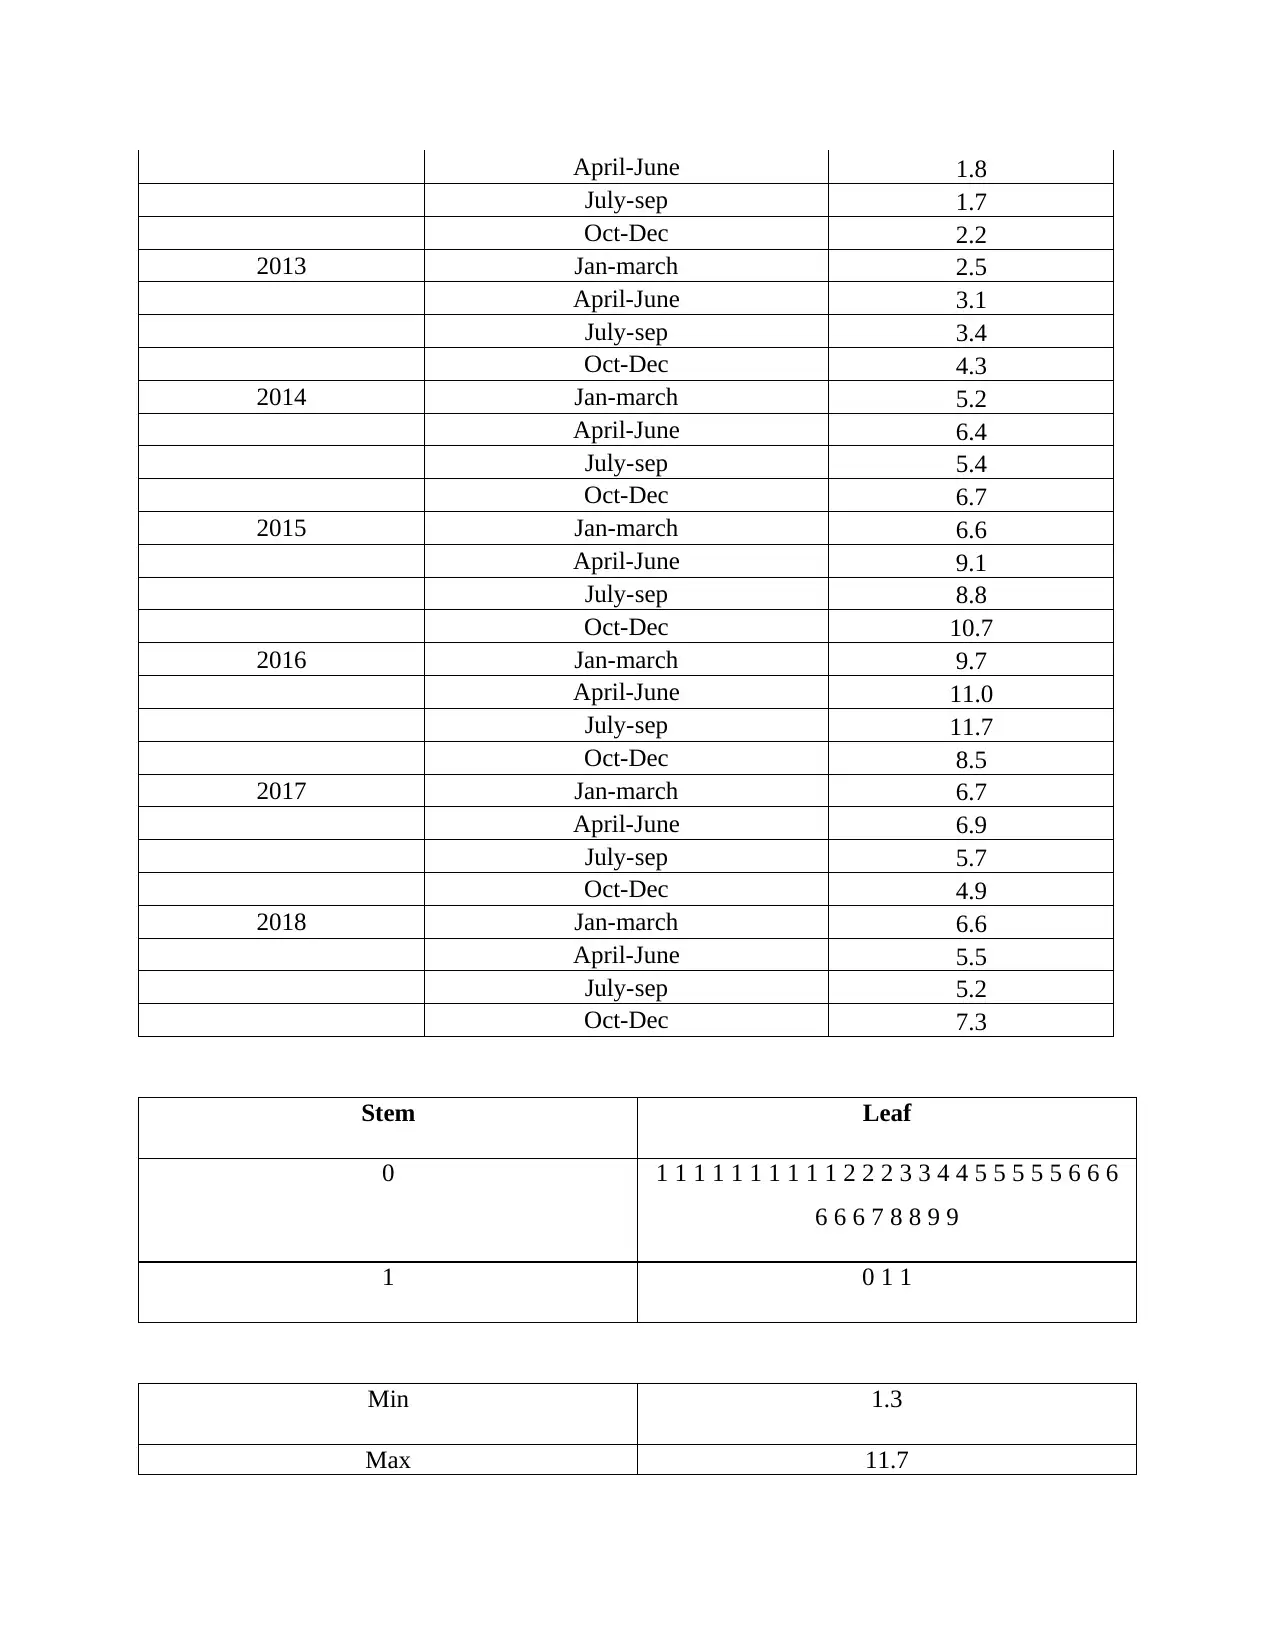
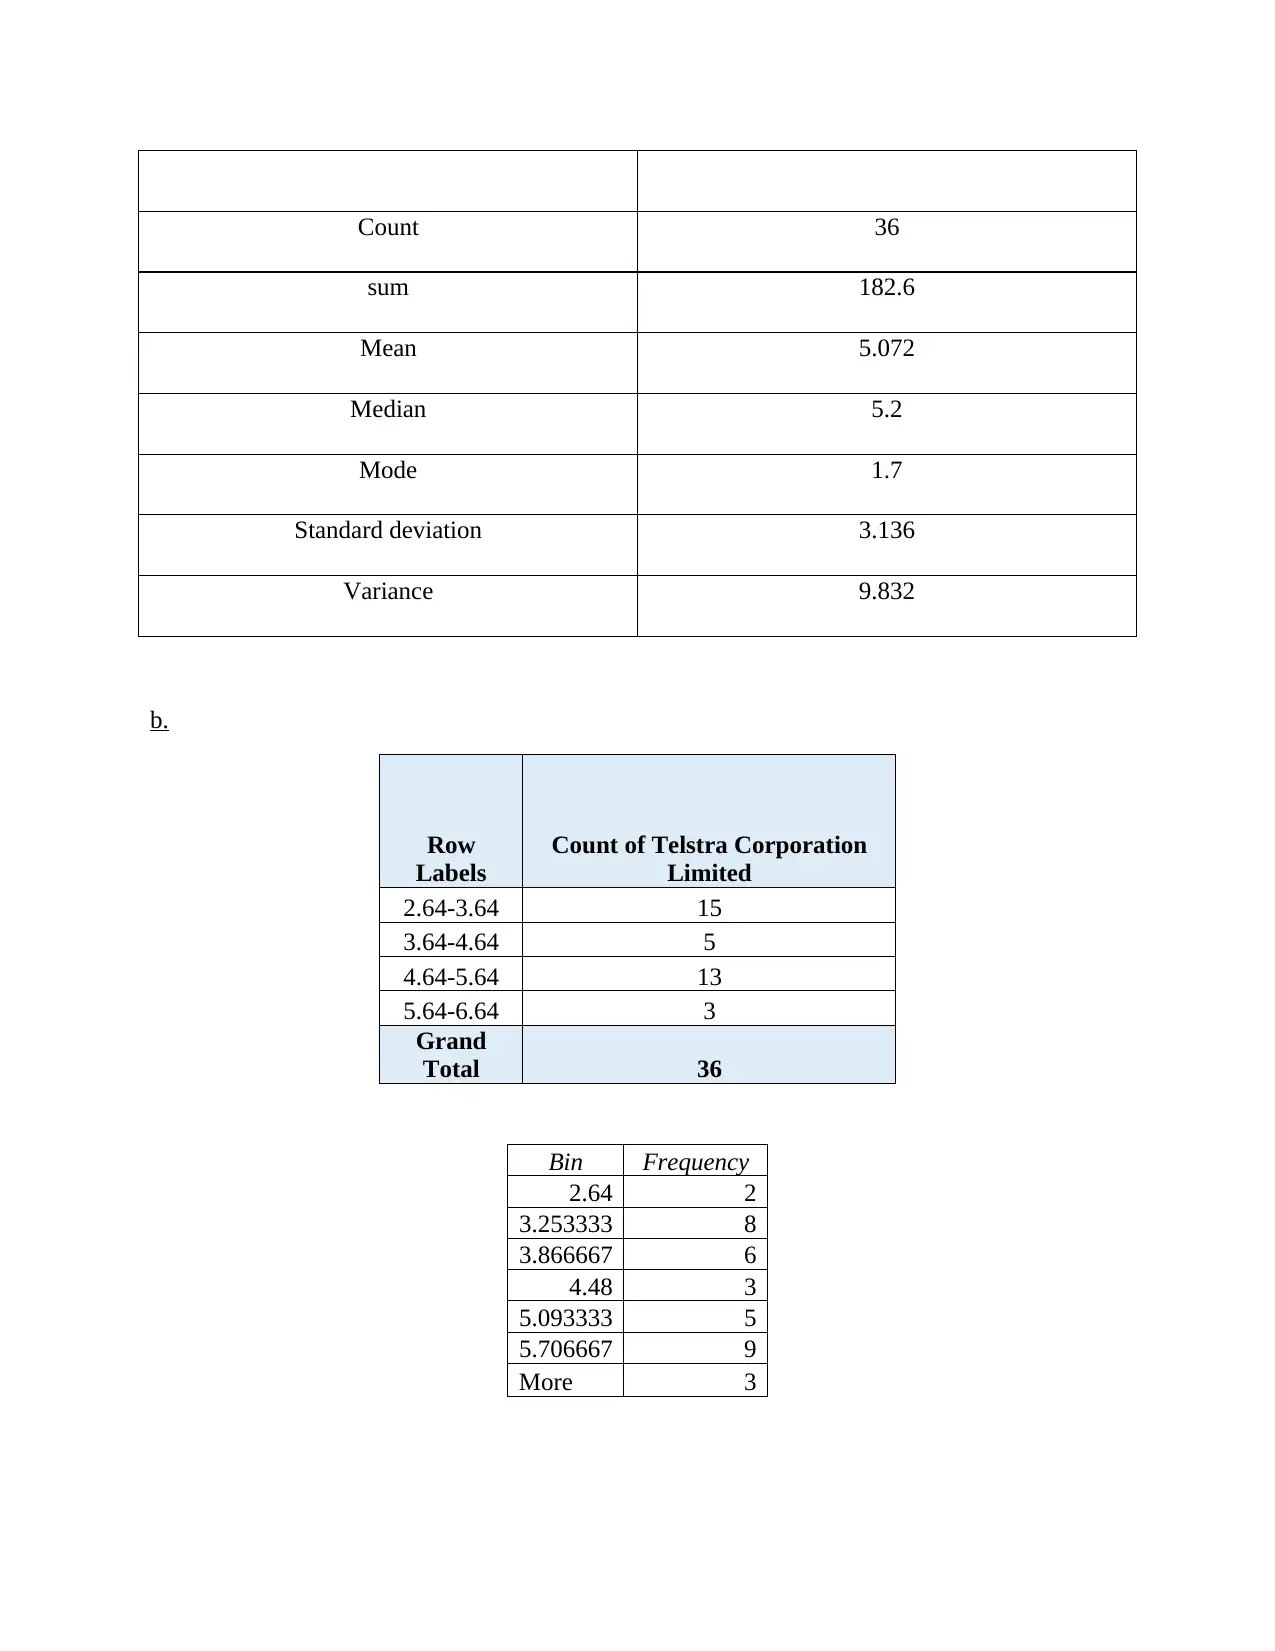
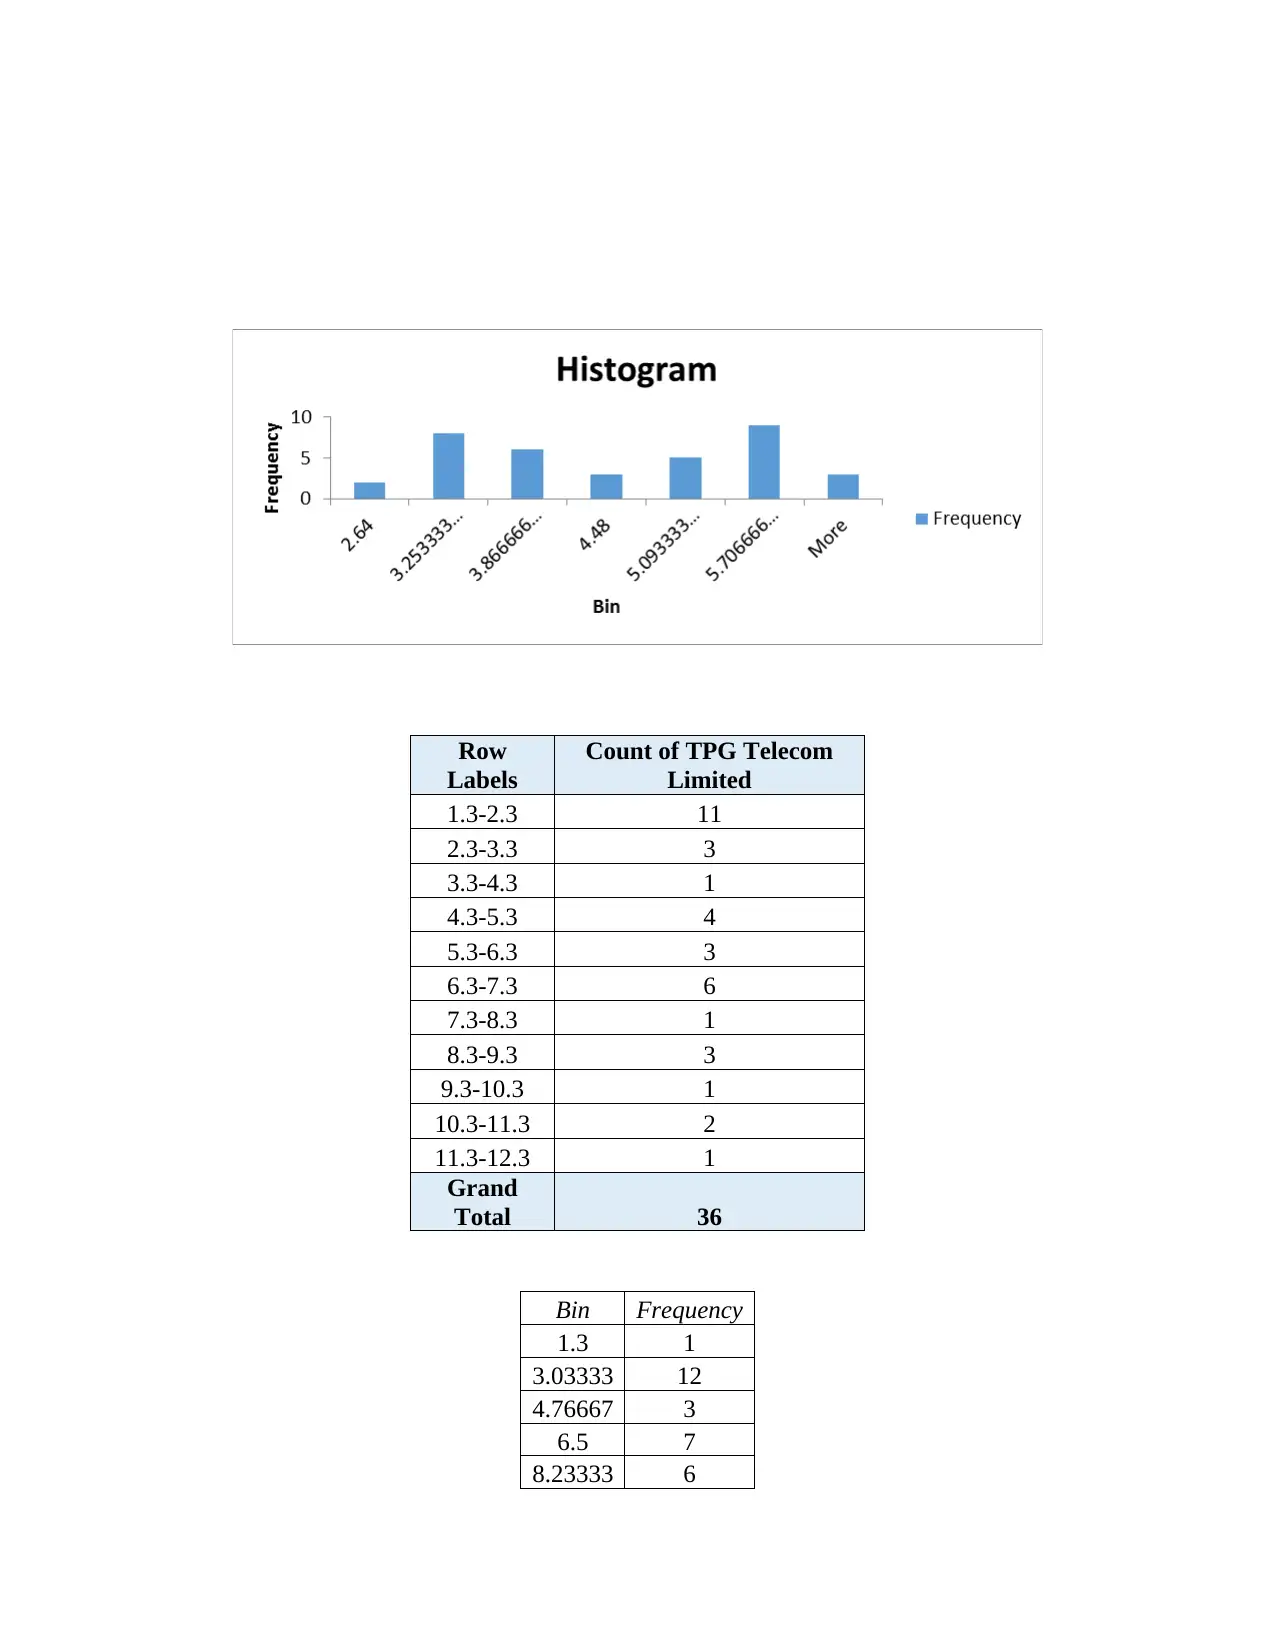
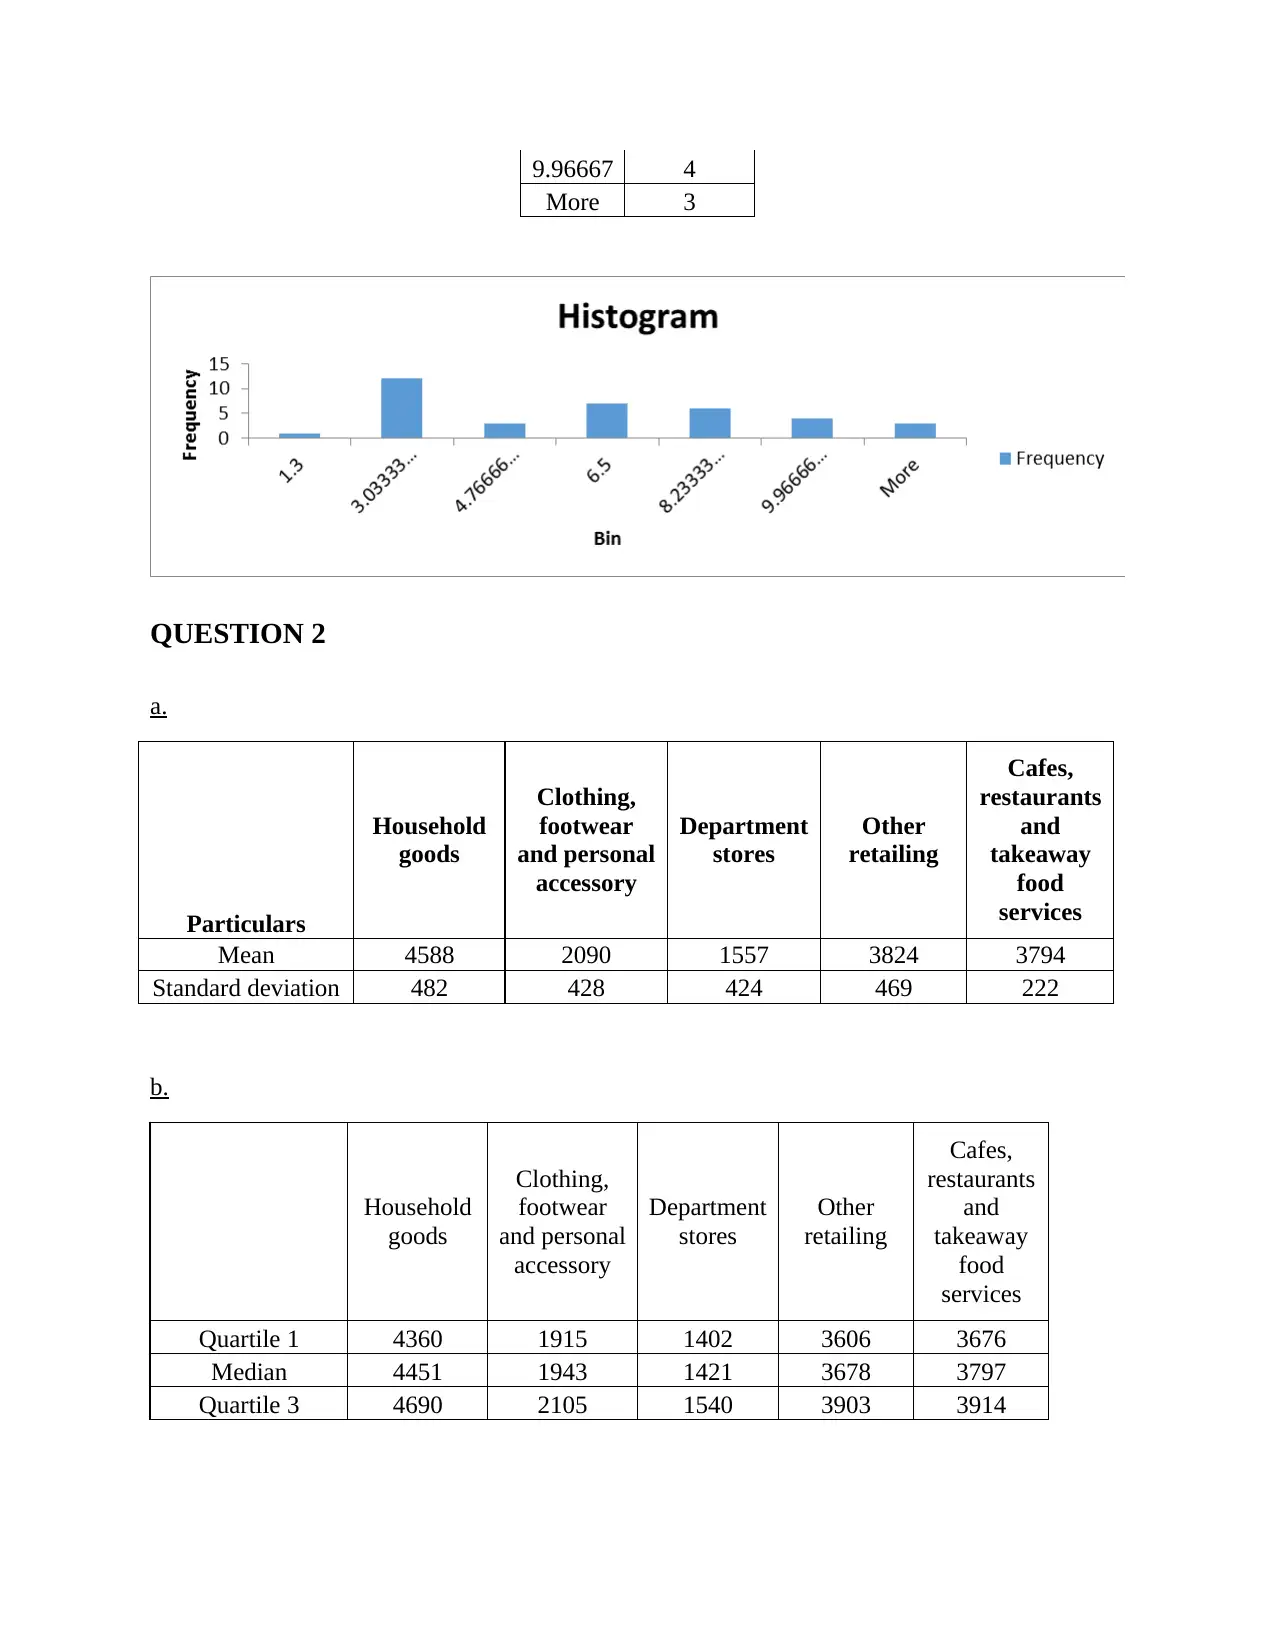
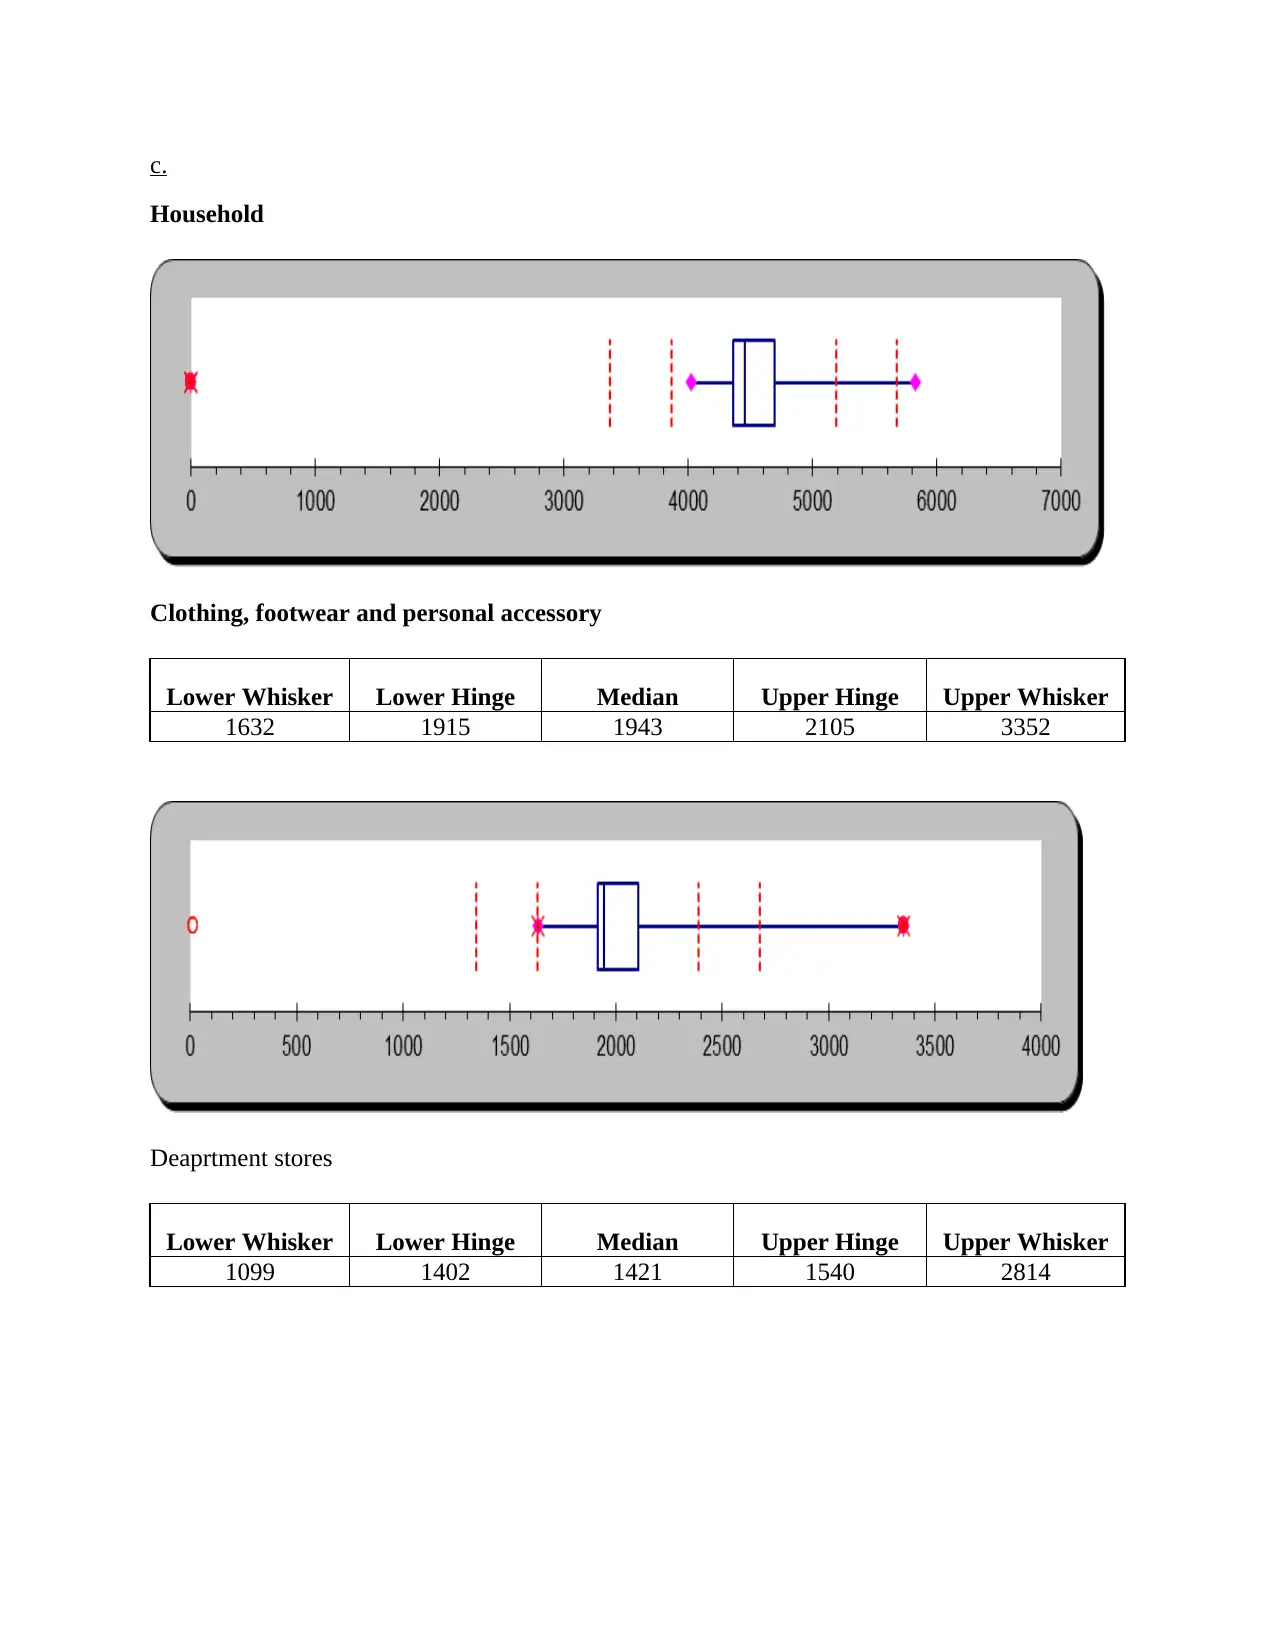
This maths assignment presents a detailed analysis of share prices for Telstra Corporation Limited and TPG Telecom Limited, including calculations of mean, median, mode, standard deviation, and variance across multiple years and quarters. It also involves the analysis of household goods data, utilizing quartiles and whisker plots to interpret trends in consumer spending. Furthermore, the assignment delves into probability, specifically using the normal approximation to estimate the probability of at least 290 students being enrolled, based on a given success probability and sample size. The solutions include stem-and-leaf plots, frequency distributions, and z-score calculations to support the statistical interpretations and conclusions.
Document Page
Maths Questions
tabler-icon-diamond-filled.svg

Paraphrase This Document

Need a fresh take? Get an instant paraphrase of this document with our AI Paraphraser
Document Page
TABLE OF CONTENTS
QUESTION 1..................................................................................................................................3
a....................................................................................................................................................3
b...................................................................................................................................................6
c....................................................................................................................................................8
d...................................................................................................................................................8
QUESTION 2..................................................................................................................................8
a....................................................................................................................................................8
b...................................................................................................................................................9
c....................................................................................................................................................9
d.................................................................................................................................................11
QUESTION 5................................................................................................................................11
A................................................................................................................................................11
Document Page
QUESTION 1
a.
Share prices of Telstra Corporation Limited
Year Quarters Opening share prices
2010 Jan-march 3.44
April-June 3.01
July-September 3.23
Oct-Dec 2.64
2011 Jan-march 2.68
April-June 2.82
July-sep 2.91
Oct-Dec 3.08
2012 Jan-march 3.33
April-June 3.3
July-sep 3.7
Oct-Dec 3.89
2013 Jan-march 4.37
April-June 4.51
July-sep 4.76
Oct-Dec 4.97
2014 Jan-march 5.25
April-June 5.07
July-sep 5.23
Oct-Dec 5.31
2015 Jan-march 5.97
April-June 6.32
July-sep 6.12
Oct-Dec 5.62
2016 Jan-march 5.61
April-June 5.27
July-sep 5.58
Oct-Dec 5.2
2017 Jan-march 5.1
April-June 4.66
July-sep 4.33
Oct-Dec 3.49
2018 Jan-march 3.63
Document Page
April-June 3.14
July-sep 2.64
Oct-Dec 3.17
Stem Leaf
0 2 2 2 2 2 3 3 3 3 3 3 3 3 3 3 3 3 4 4 4 4 4 4 5 5
5 5 5 5 5 5 5 5 5 6 6
Min 2.64
Max 6.32
Count 36
sum 153.35
Mean 4.26
Median 4.35
Mode 2.64
Standard deviation 1.138
Variance 1.295
Share prices of TPG Telecom Limited
2010 Jan-march 1.6
April-June 2.3
July-September 1.9
Oct-Dec 1.5
2011 Jan-march 1.6
April-June 1.7
July-sep 1.7
Oct-Dec 1.4
2012 Jan-march 1.3
tabler-icon-diamond-filled.svg

Paraphrase This Document

Need a fresh take? Get an instant paraphrase of this document with our AI Paraphraser
Document Page
April-June 1.8
July-sep 1.7
Oct-Dec 2.2
2013 Jan-march 2.5
April-June 3.1
July-sep 3.4
Oct-Dec 4.3
2014 Jan-march 5.2
April-June 6.4
July-sep 5.4
Oct-Dec 6.7
2015 Jan-march 6.6
April-June 9.1
July-sep 8.8
Oct-Dec 10.7
2016 Jan-march 9.7
April-June 11.0
July-sep 11.7
Oct-Dec 8.5
2017 Jan-march 6.7
April-June 6.9
July-sep 5.7
Oct-Dec 4.9
2018 Jan-march 6.6
April-June 5.5
July-sep 5.2
Oct-Dec 7.3
Stem Leaf
0 1 1 1 1 1 1 1 1 1 1 2 2 2 3 3 4 4 5 5 5 5 5 6 6 6
6 6 6 7 8 8 9 9
1 0 1 1
Min 1.3
Max 11.7
Document Page
Count 36
sum 182.6
Mean 5.072
Median 5.2
Mode 1.7
Standard deviation 3.136
Variance 9.832
b.
Row
Labels
Count of Telstra Corporation
Limited
2.64-3.64 15
3.64-4.64 5
4.64-5.64 13
5.64-6.64 3
Grand
Total 36
Bin Frequency
2.64 2
3.253333 8
3.866667 6
4.48 3
5.093333 5
5.706667 9
More 3
Document Page
Row
Labels
Count of TPG Telecom
Limited
1.3-2.3 11
2.3-3.3 3
3.3-4.3 1
4.3-5.3 4
5.3-6.3 3
6.3-7.3 6
7.3-8.3 1
8.3-9.3 3
9.3-10.3 1
10.3-11.3 2
11.3-12.3 1
Grand
Total 36
Bin Frequency
1.3 1
3.03333 12
4.76667 3
6.5 7
8.23333 6
tabler-icon-diamond-filled.svg

Paraphrase This Document

Need a fresh take? Get an instant paraphrase of this document with our AI Paraphraser
Document Page
9.96667 4
More 3
QUESTION 2
a.
Particulars
Household
goods
Clothing,
footwear
and personal
accessory
Department
stores
Other
retailing
Cafes,
restaurants
and
takeaway
food
services
Mean 4588 2090 1557 3824 3794
Standard deviation 482 428 424 469 222
b.
Household
goods
Clothing,
footwear
and personal
accessory
Department
stores
Other
retailing
Cafes,
restaurants
and
takeaway
food
services
Quartile 1 4360 1915 1402 3606 3676
Median 4451 1943 1421 3678 3797
Quartile 3 4690 2105 1540 3903 3914
Document Page
c.
Household
Clothing, footwear and personal accessory
Lower Whisker Lower Hinge Median Upper Hinge Upper Whisker
1632 1915 1943 2105 3352
Deaprtment stores
Lower Whisker Lower Hinge Median Upper Hinge Upper Whisker
1099 1402 1421 1540 2814
Document Page
Other retailing
Lower Whisker Lower Hinge Median Upper Hinge Upper Whisker
3335 3606 3678 3903 5053
Cafes, restaurants and takeaway food services
Lower Whisker Lower Hinge Median Upper Hinge Upper Whisker
3378 3676 3797 3914 4279
tabler-icon-diamond-filled.svg

Paraphrase This Document

Need a fresh take? Get an instant paraphrase of this document with our AI Paraphraser
Document Page
d.
Interpretation: By doing analysis it has identified that hosuehold secrtor is growing with the
very high pace over others. Thereafter, turnover of café and restaurants rae higher in comparison
to other industries.
QUESTION 5
A.
Total number of students = n = 500
Number of success = x = 290
Success probability = p = 62% = 0.62
Document Page
Failure probability = q = 1-0.62 = 0.38
Using normal approximation:
Mean = np = 500*0.62 = 310
variance = mean*q = 310*0.38 = 117.8
Standard deviation of binomial distribution = n*p*q
Standard deviation = (117.8) = 10.85
Probability of having at least 290 enrolled students = P (x>=290)
Using the notation for continuity correction factor we have:
For P (x>=n) we use P (x>n -0.5)
So on rewriting problem using continuity correction factor:
P (x>= 290-0.5) = P (x>= 289.5)
z score = (Probability – mean) / standard deviation
z score = (289.5-310) / 10.85
z score = -1.89
The area for this z value = 0.4706
The total area = 0.4706+ 0.5 = 0.97
Probability that at least 290 students are enrolled = 0.97
chevron_up_icon
1 out of 12
circle_padding
hide_on_mobile
zoom_out_icon
[object Object]