Statistics and Probability Assignment: Comprehensive Problem Solving
VerifiedAdded on 2020/06/05
|10
|1763
|41
Homework Assignment
AI Summary
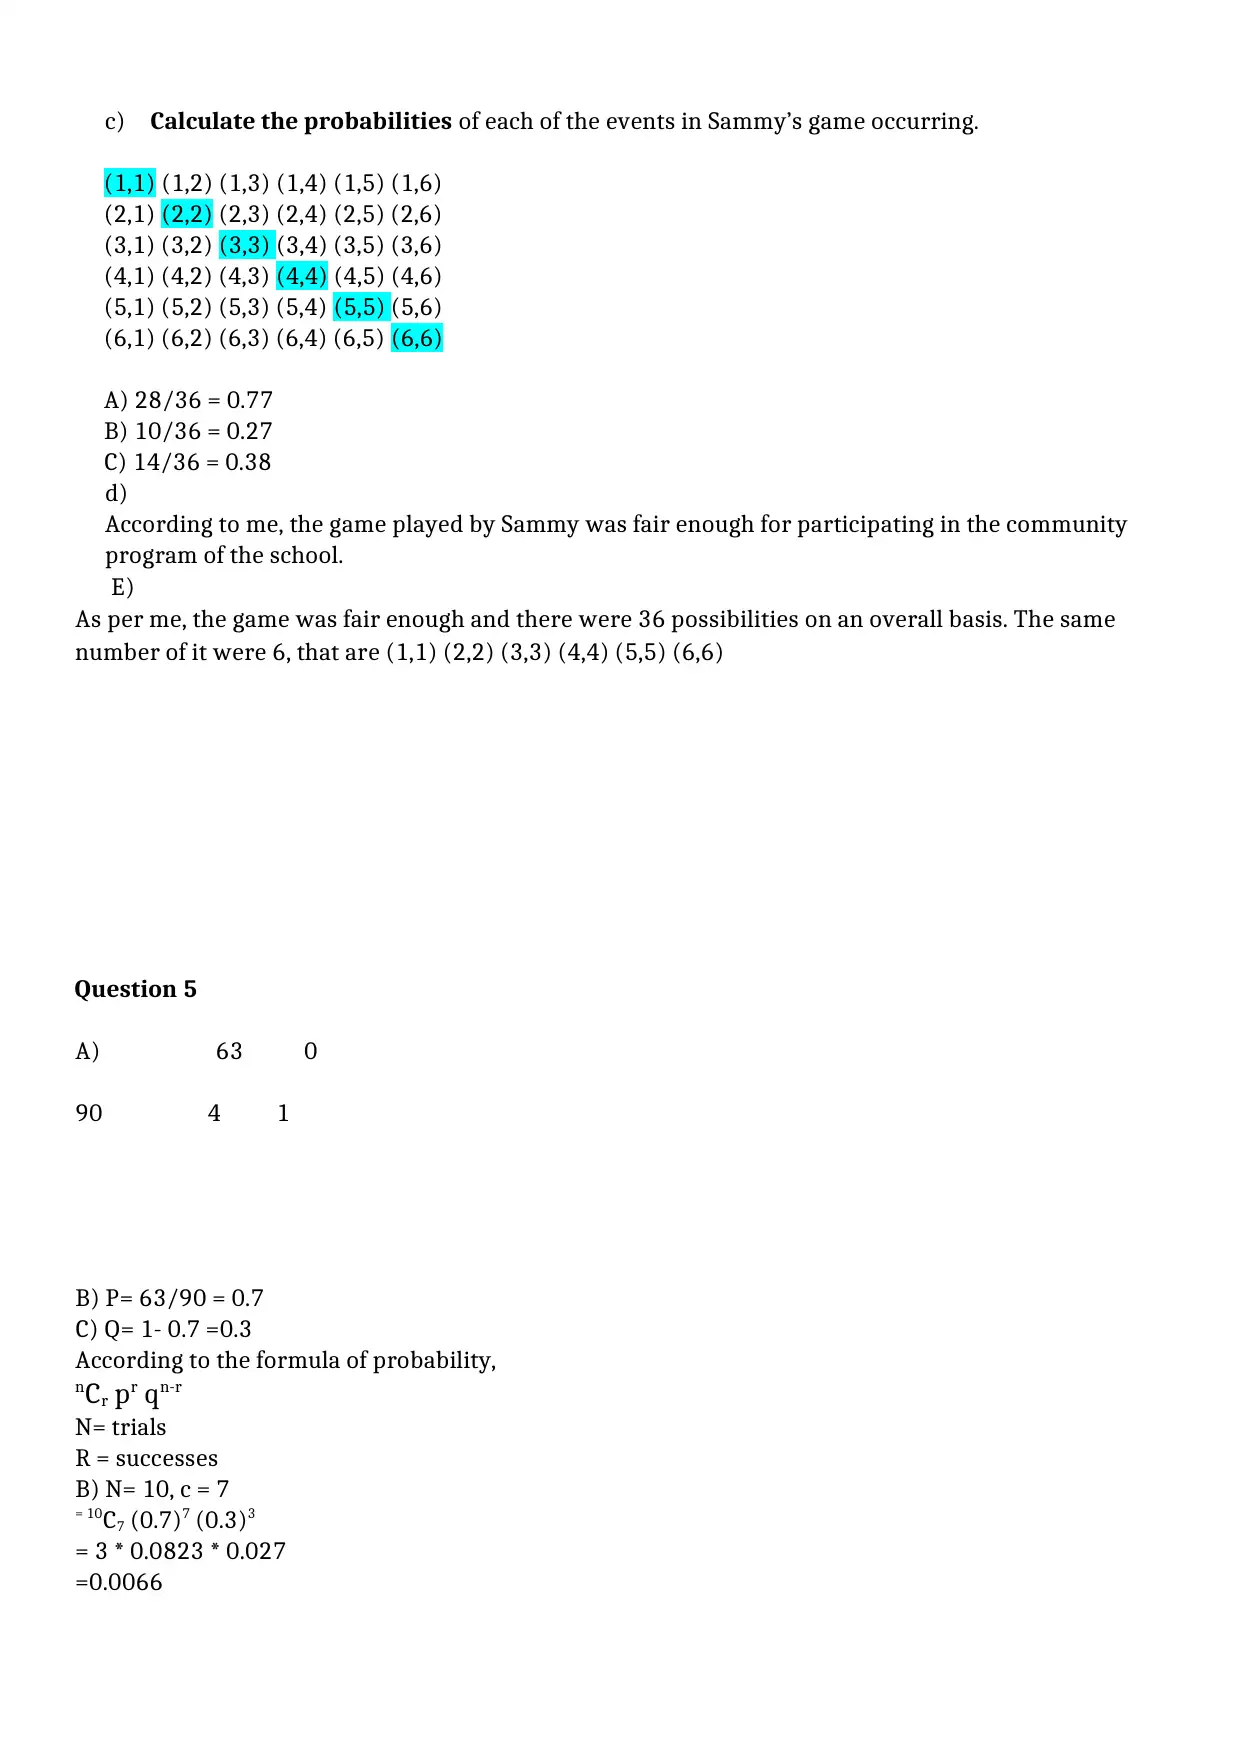
This document presents a comprehensive solution to a statistics and probability assignment. The assignment covers various topics, including calculating the mean and standard deviation from grouped data, determining cumulative frequencies, finding quartiles and the interquartile range, and constructing a cumulative frequency polygon. It also involves probability calculations using the standard normal distribution, estimating the number of athletes based on vertical leap data, and comparing the mean and median as measures of central tendency. Furthermore, the assignment analyzes housing prices, calculates confidence intervals, explores hypothesis testing, and provides examples of good statistical samples. Finally, it delves into probability calculations related to a dice game, using Venn diagrams to illustrate outcomes, and calculating binomial probabilities. The solution provides detailed explanations, calculations, and interpretations for each question, making it a valuable resource for students studying statistics and probability.

1 out of 10
Your All-in-One AI-Powered Toolkit for Academic Success.
+13062052269
info@desklib.com
Available 24*7 on WhatsApp / Email
![[object Object]](/_next/static/media/star-bottom.7253800d.svg)
Copyright © 2020–2026 A2Z Services. All Rights Reserved. Developed and managed by ZUCOL.