MEM 515 Statistical Process Control Homework 4: Analysis & Charts
VerifiedAdded on 2023/01/23
|18
|1306
|61
Homework Assignment
AI Summary
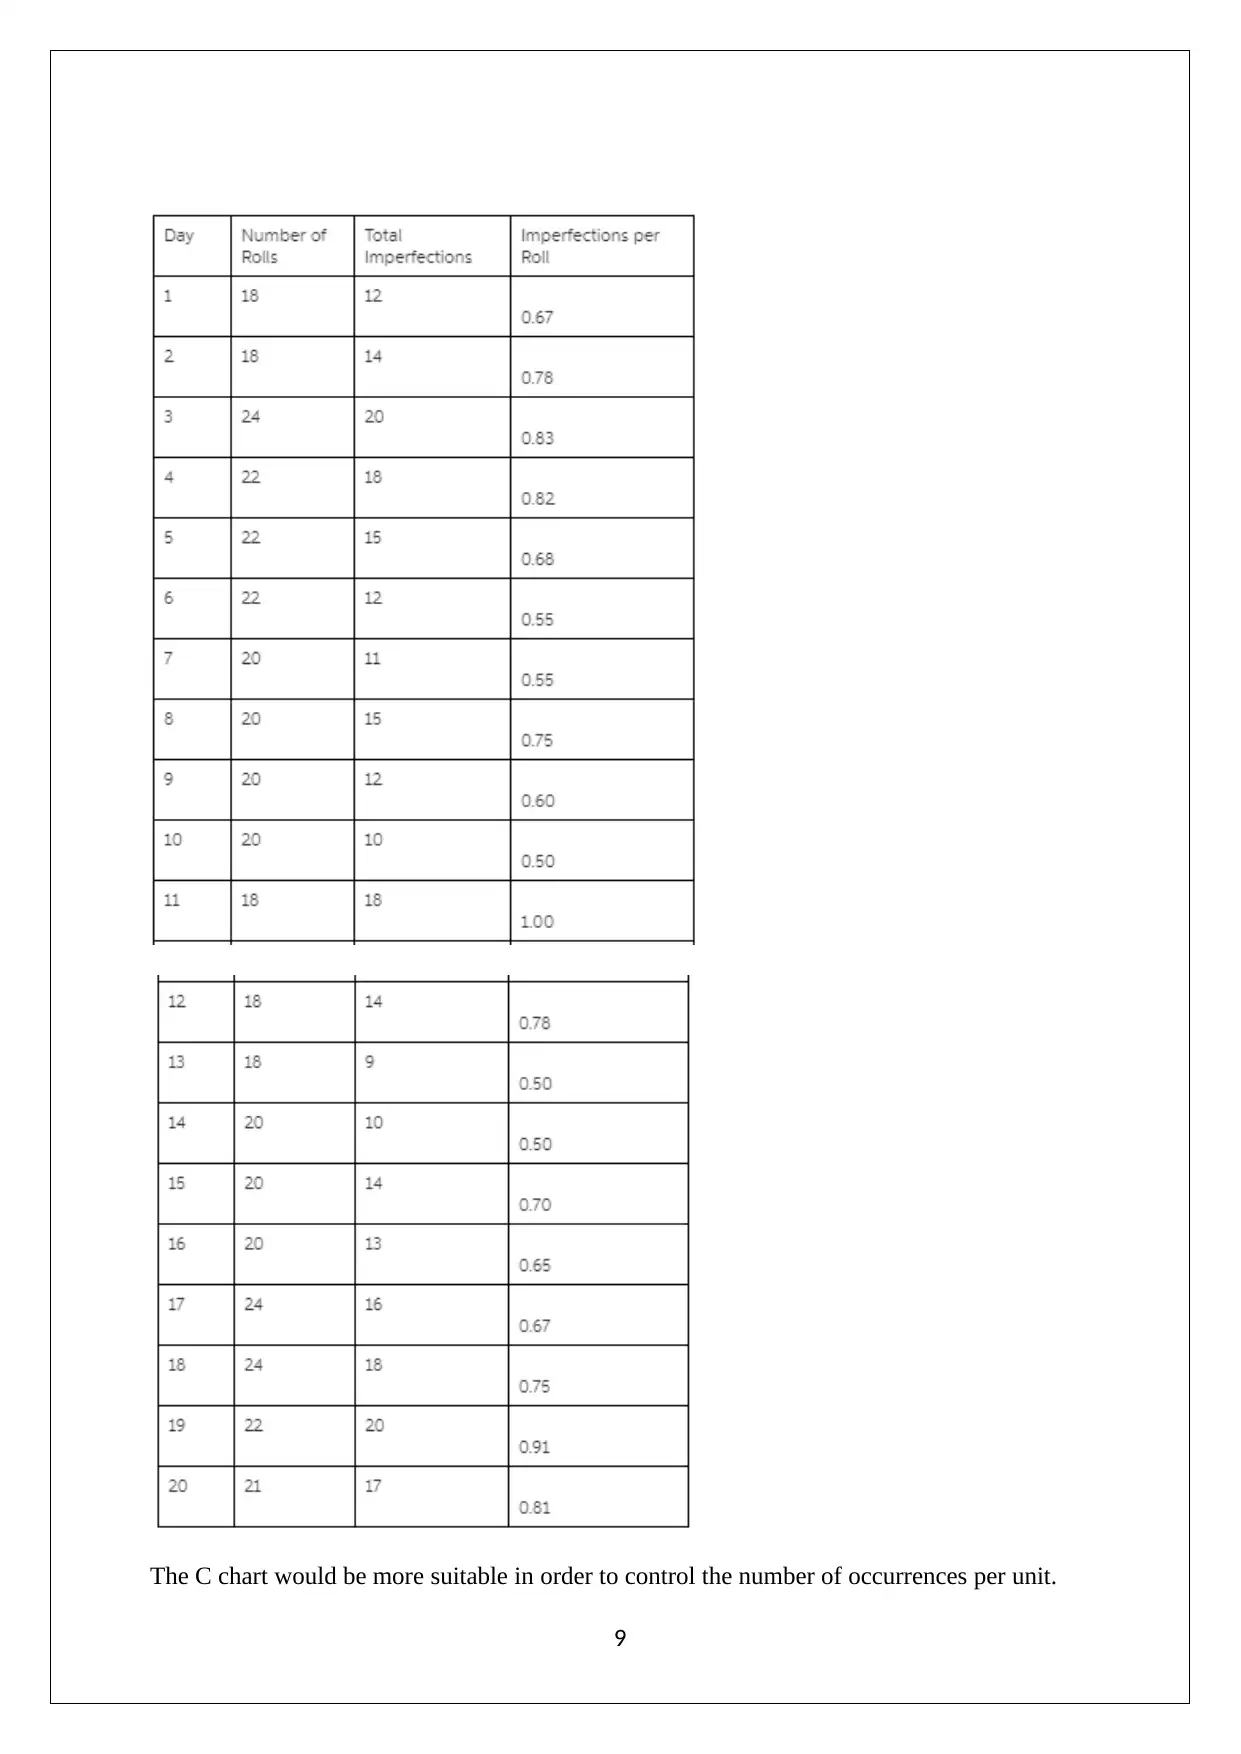
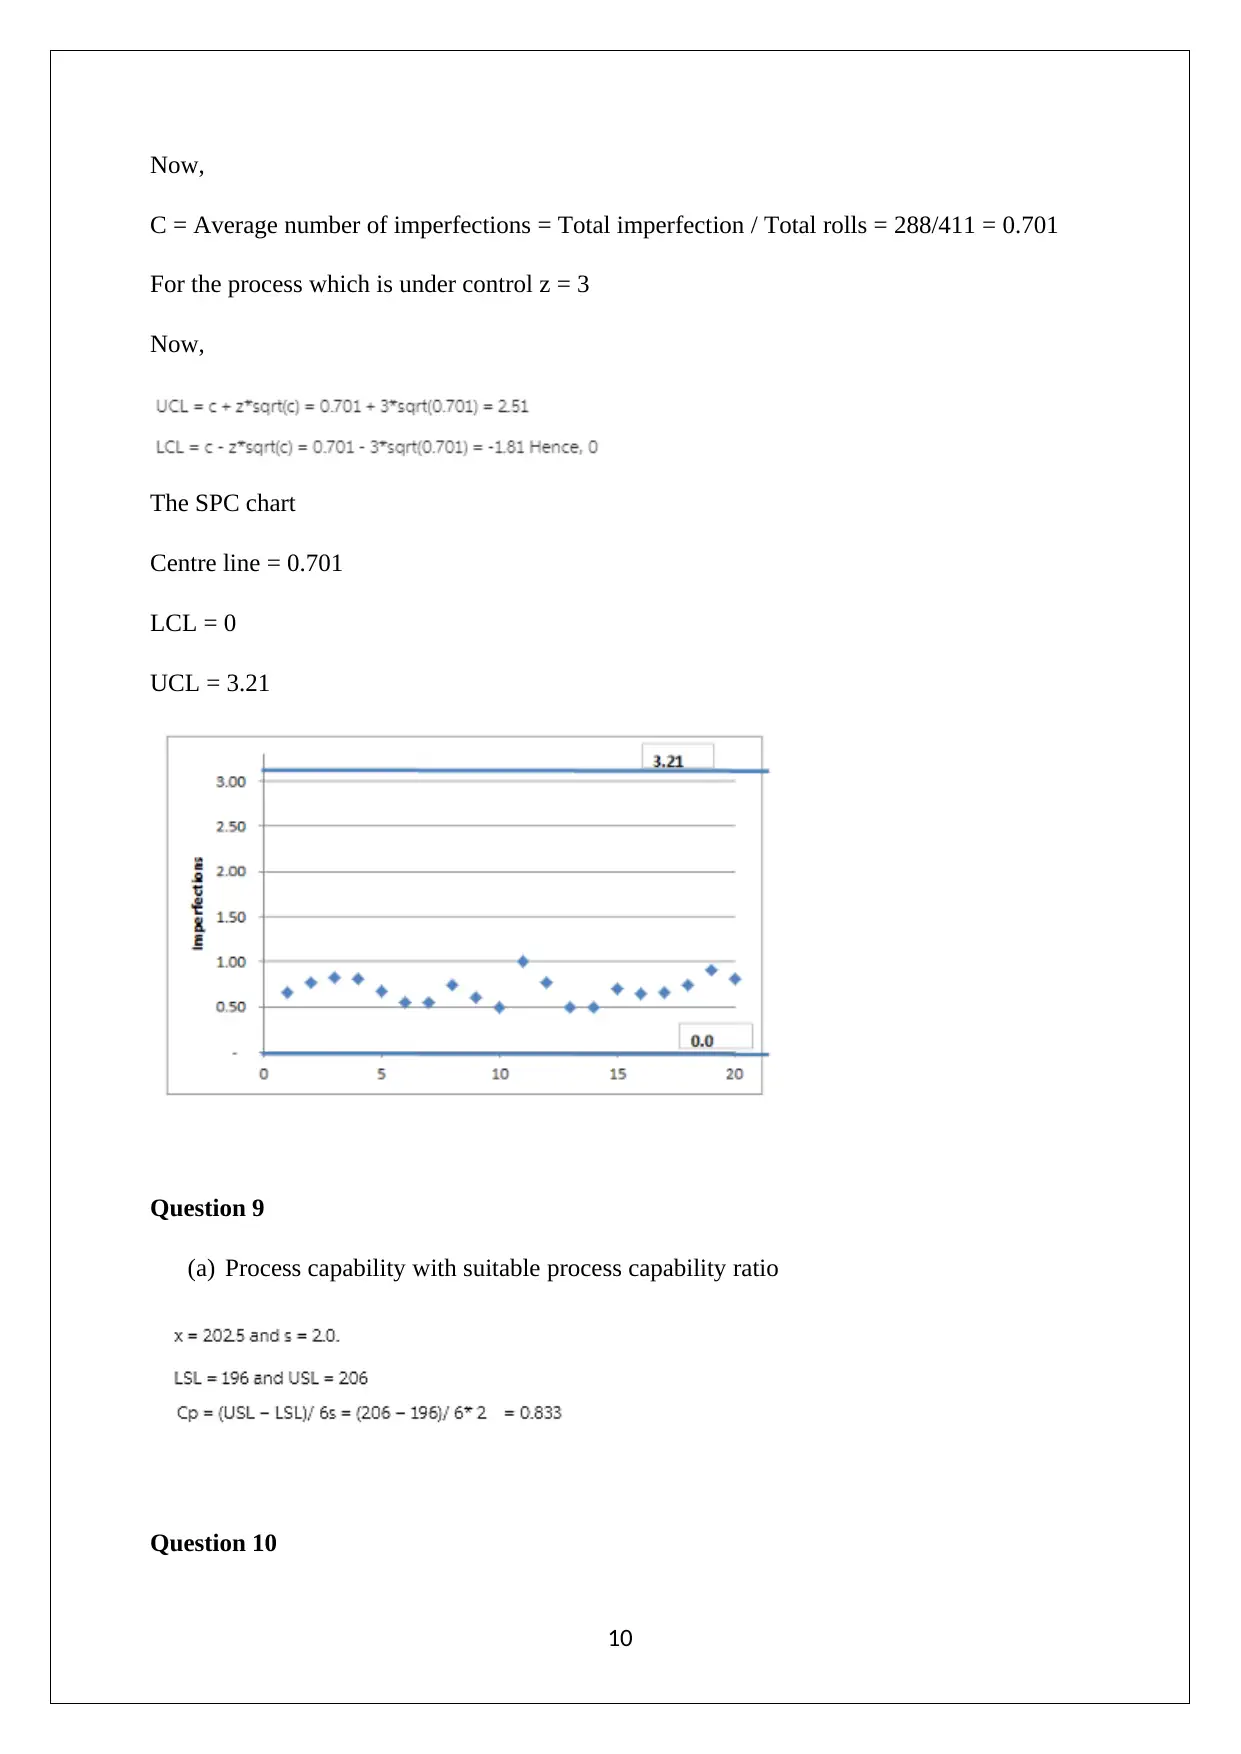
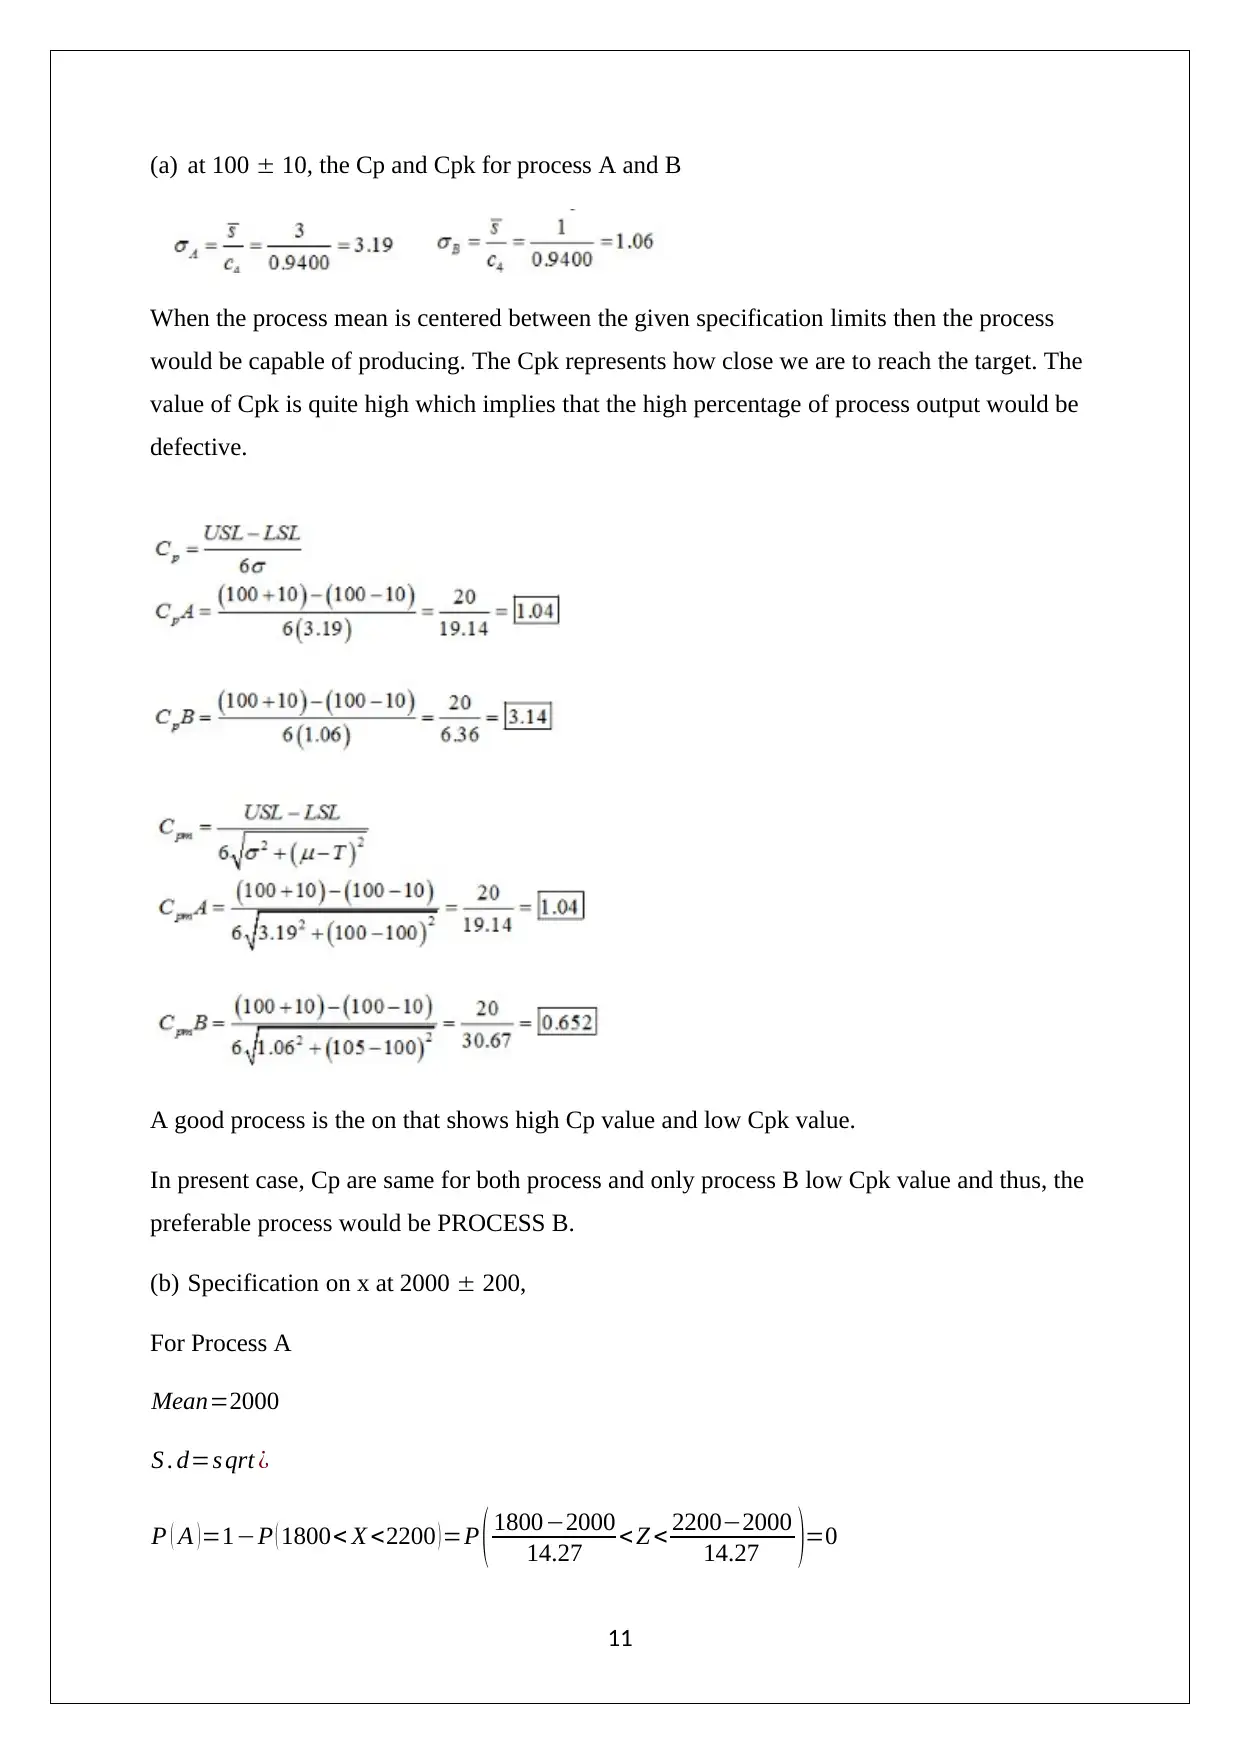
This document presents the solutions to MEM 515 Homework 4, focusing on statistical process control (SPC) methods. The assignment covers various aspects of SPC, including the construction and interpretation of x-bar and R control charts for both shaft diameters and patient admissions, and the analysis of process means and standard deviations. It also addresses the calculation of process capability indices (Cp and Cpk), natural tolerance limits, and the application of different types of control charts, such as the c-chart and individual moving range charts. The solutions also include the determination of sampling plans, the construction of OC curves, and the interpretation of results to assess process stability and capability. The assignment explores scenarios involving scrap, rework, and non-conforming fractions, providing a comprehensive understanding of SPC principles and their application in quality control.

MEM 515
HW 4
[DATE]
HW 4
[DATE]
Paraphrase This Document
Need a fresh take? Get an instant paraphrase of this document with our AI Paraphraser

Question 1
(a) Control limits for the x and R control charts
x∧R
Control limits for the x control charts
For samples of 4 shaft diameter i.e. n = 4
A2=0.729
Hence, control limits for x control charts (0.4769 0.5507).
Control limits for the R control charts
For samples of 4 shaft diameter i.e. n = 4
D3=0∧D4 =2.282
Hence, control limits for R control charts (0 0.1155).
1

(b) Process mean and standard deviation for 20 preliminary samples plot
Process mean for x
Process standard deviation for x
For samples of 4 shaft diameter i.e. n = 4
d2=2.059
Process mean for R
Question 2
(a) Control limits for the 𝑥 and R control charts for the patient admitting
𝑥 𝑎𝑛𝑑 𝑅
Control limits for the 𝑥 control charts
2
Process mean for x
Process standard deviation for x
For samples of 4 shaft diameter i.e. n = 4
d2=2.059
Process mean for R
Question 2
(a) Control limits for the 𝑥 and R control charts for the patient admitting
𝑥 𝑎𝑛𝑑 𝑅
Control limits for the 𝑥 control charts
2
You're viewing a preview
Unlock full access by subscribing today!

For 2 patients i.e. n = 2
𝐴2=1.880
Control limits for the 𝑅 control charts
For 2 patients i.e. n = 2
D3=0∧D4 =3.267
(b) Plot for control charts
x control charts
3
𝐴2=1.880
Control limits for the 𝑅 control charts
For 2 patients i.e. n = 2
D3=0∧D4 =3.267
(b) Plot for control charts
x control charts
3
Paraphrase This Document
Need a fresh take? Get an instant paraphrase of this document with our AI Paraphraser

It is apparent from the above that all the respective data points are within the control limits
and hence, the process would be under control.
R control charts
It is apparent from the above that all the respective data points are within the control limits
and hence, the process would be under control.
Question 3
(a) Mean and standard deviation of the given process
Subgroup = 3
(b) Proportion of scrap and rework produced
For rework
4
and hence, the process would be under control.
R control charts
It is apparent from the above that all the respective data points are within the control limits
and hence, the process would be under control.
Question 3
(a) Mean and standard deviation of the given process
Subgroup = 3
(b) Proportion of scrap and rework produced
For rework
4

Hence 0.0003% of the total parts would be reworked.
For Scrap
Hence 0.0006% of the total parts would be reworked.
Question 4
(a) Control limits for the x and S control charts
Normal distribution
Number of subgroups = 50
x and S
Control limits for the x control charts
D3=¿𝐴2 A3 =1.628(for m=50)
Control limits for the s control charts
For. m = 50
B3=0∧B4 =2.266
5
You're viewing a preview
Unlock full access by subscribing today!

(b) Assuming that all the respective points are in the control limits in both of the charts and
hence, the natural tolerance limits of process is computed as shown below.
Natural tolerance limits of process
= x bar + 3 * standard deviation = 20 +(3*1.44) = 15.68
= x bar - 3 * standard deviation = 20 -(3*1.44) = 24.32
Thus, the natural tolerance limits of process would be 15.68 to 24.32.
Question 5
The individual moving range control charts is shown below.
6
Paraphrase This Document
Need a fresh take? Get an instant paraphrase of this document with our AI Paraphraser

Question 6
Number of applications = 50
Centre line on the fraction non-conforming control chart
Lower control limit on the fraction non-conforming control chart
Upper control limit on the fraction non-conforming control chart
7
Number of applications = 50
Centre line on the fraction non-conforming control chart
Lower control limit on the fraction non-conforming control chart
Upper control limit on the fraction non-conforming control chart
7

Question 7
LCL can be assumed as zero.
It can be seen that one of the sample observations i.e. sample 13 does not fall within the
control limits and hence, it can be concluded that the given process is out of control. Thus,
the plates are not in the statistical control.
Question 8
Imperfection per roll = Total imperfection / Number of rolls
8
You're viewing a preview
Unlock full access by subscribing today!

The C chart would be more suitable in order to control the number of occurrences per unit.
9
9
Paraphrase This Document
Need a fresh take? Get an instant paraphrase of this document with our AI Paraphraser

Now,
C = Average number of imperfections = Total imperfection / Total rolls = 288/411 = 0.701
For the process which is under control z = 3
Now,
The SPC chart
Centre line = 0.701
LCL = 0
UCL = 3.21
Question 9
(a) Process capability with suitable process capability ratio
Question 10
10
C = Average number of imperfections = Total imperfection / Total rolls = 288/411 = 0.701
For the process which is under control z = 3
Now,
The SPC chart
Centre line = 0.701
LCL = 0
UCL = 3.21
Question 9
(a) Process capability with suitable process capability ratio
Question 10
10

(a) at 100 10, the Cp and Cpk for process A and B
When the process mean is centered between the given specification limits then the process
would be capable of producing. The Cpk represents how close we are to reach the target. The
value of Cpk is quite high which implies that the high percentage of process output would be
defective.
A good process is the on that shows high Cp value and low Cpk value.
In present case, Cp are same for both process and only process B low Cpk value and thus, the
preferable process would be PROCESS B.
(b) Specification on x at 2000 200,
For Process A
Mean=2000
S . d=s qrt ¿
P ( A ) =1−P ( 1800< X <2200 ) =P ( 1800−2000
14.27 <Z < 2200−2000
14.27 )=0
11
You're viewing a preview
Unlock full access by subscribing today!

For Process B
Mean=2100
S . d=s qrt ¿
P ( B )=1−P ( 1800<X <2200 )=P ( 1800−2000
4.76 < Z< 2200−2000
4.76 )=0
The smallest P value would be more suitable. Here, the process A and B shows negligible
difference in P however, it would be safer to use process B to produce parts.
Question 11
x ¯¿ 39.7
R ¯¿ 2.5
Sample size n = 2
Specification at 40 +/- 5
(a) Potential capability of process
Standard deviation x = R bar / d2 = 2.5/1.128 = 2.215
Cp = (USL -LSL)/ 6* s.d. = ( 45-35)/6*2.215
Cp= 0.75
(b) Actual process capability
Cpu = (USL – X bar) /3 * s.d. = (45-39.7)/(3*2.215) = 0.80
Cpl = (X bar – LSL)/ 3 * s.d. = (39.7 – 35) / (3*2.215) = 0.71
Cpk = Min (Cpu Cpl) = Min (0.80 0.71)
Cpk= 0.71
Question 12
12
Paraphrase This Document
Need a fresh take? Get an instant paraphrase of this document with our AI Paraphraser

(a) Point estimate of Cp
(b) 95% confidence interval on Cp
It can be said with 95% confidence that the point estimate of Cp would fall between 0.7979
and 1.4216.
Question 13
(a) Point estimate of Cpk
Hence, the Point estimate of Cpk would be 0.625.
(b) 95% confidence interval on Cpk
The z value for 95% confidence interval on Cpk = 1.960
13

It can be said with 95% confidence that the point estimate of Cpk would fall between 0.425
and 0.825.
Question 14
Type B- OC Curve
Single sampling plan
N = 30
C = 1
Starting p = 0.01 to p = 0.05 where, increment is 0.01
p np P(a)
0.01 =30 * 0.1 = 0.3 0.963
0.02 =30*0.02 = 0.6 0.878
0.03 =30*0.03 = 0.9 0.772
0.04 =30*0.04 =1.2 0.663
0.05 =30*0.05 =1.5 0.558
The probabilities have been computed through Poisson table while considering
Probability of success as np value and x is same as c value.
14
You're viewing a preview
Unlock full access by subscribing today!

0.005 0.01 0.015 0.02 0.025 0.03 0.035 0.04 0.045 0.05 0.055
0.000
0.200
0.400
0.600
0.800
1.000
1.200
Type B - OC Curve
p
pa
Question 15
Single sampling plan for the inputs p1 = 0.01, = 0.05, p2 = 0.10, and = 0.10
Binomial Monograph
15
0.000
0.200
0.400
0.600
0.800
1.000
1.200
Type B - OC Curve
p
pa
Question 15
Single sampling plan for the inputs p1 = 0.01, = 0.05, p2 = 0.10, and = 0.10
Binomial Monograph
15
Paraphrase This Document
Need a fresh take? Get an instant paraphrase of this document with our AI Paraphraser

Alpha = 1- 0.05 = 0.95
The single sapling plan would be selected where the lines (1- alpha, p1 = 0.01) and the (Beta
=0.01, p2 =0.10) intersect.
From the above graph, it has found that for single sapling plan the sample size should be n =
85 and the acceptance number c = 7.
16
The single sapling plan would be selected where the lines (1- alpha, p1 = 0.01) and the (Beta
=0.01, p2 =0.10) intersect.
From the above graph, it has found that for single sapling plan the sample size should be n =
85 and the acceptance number c = 7.
16

17
You're viewing a preview
Unlock full access by subscribing today!
1 out of 18

Your All-in-One AI-Powered Toolkit for Academic Success.
+13062052269
info@desklib.com
Available 24*7 on WhatsApp / Email
Unlock your academic potential
© 2024 | Zucol Services PVT LTD | All rights reserved.