Food and Beverage Menu Development, Planning, and Design Report

Verified

Added on  2022/12/27

|17
|954
|78
Report
AI Summary
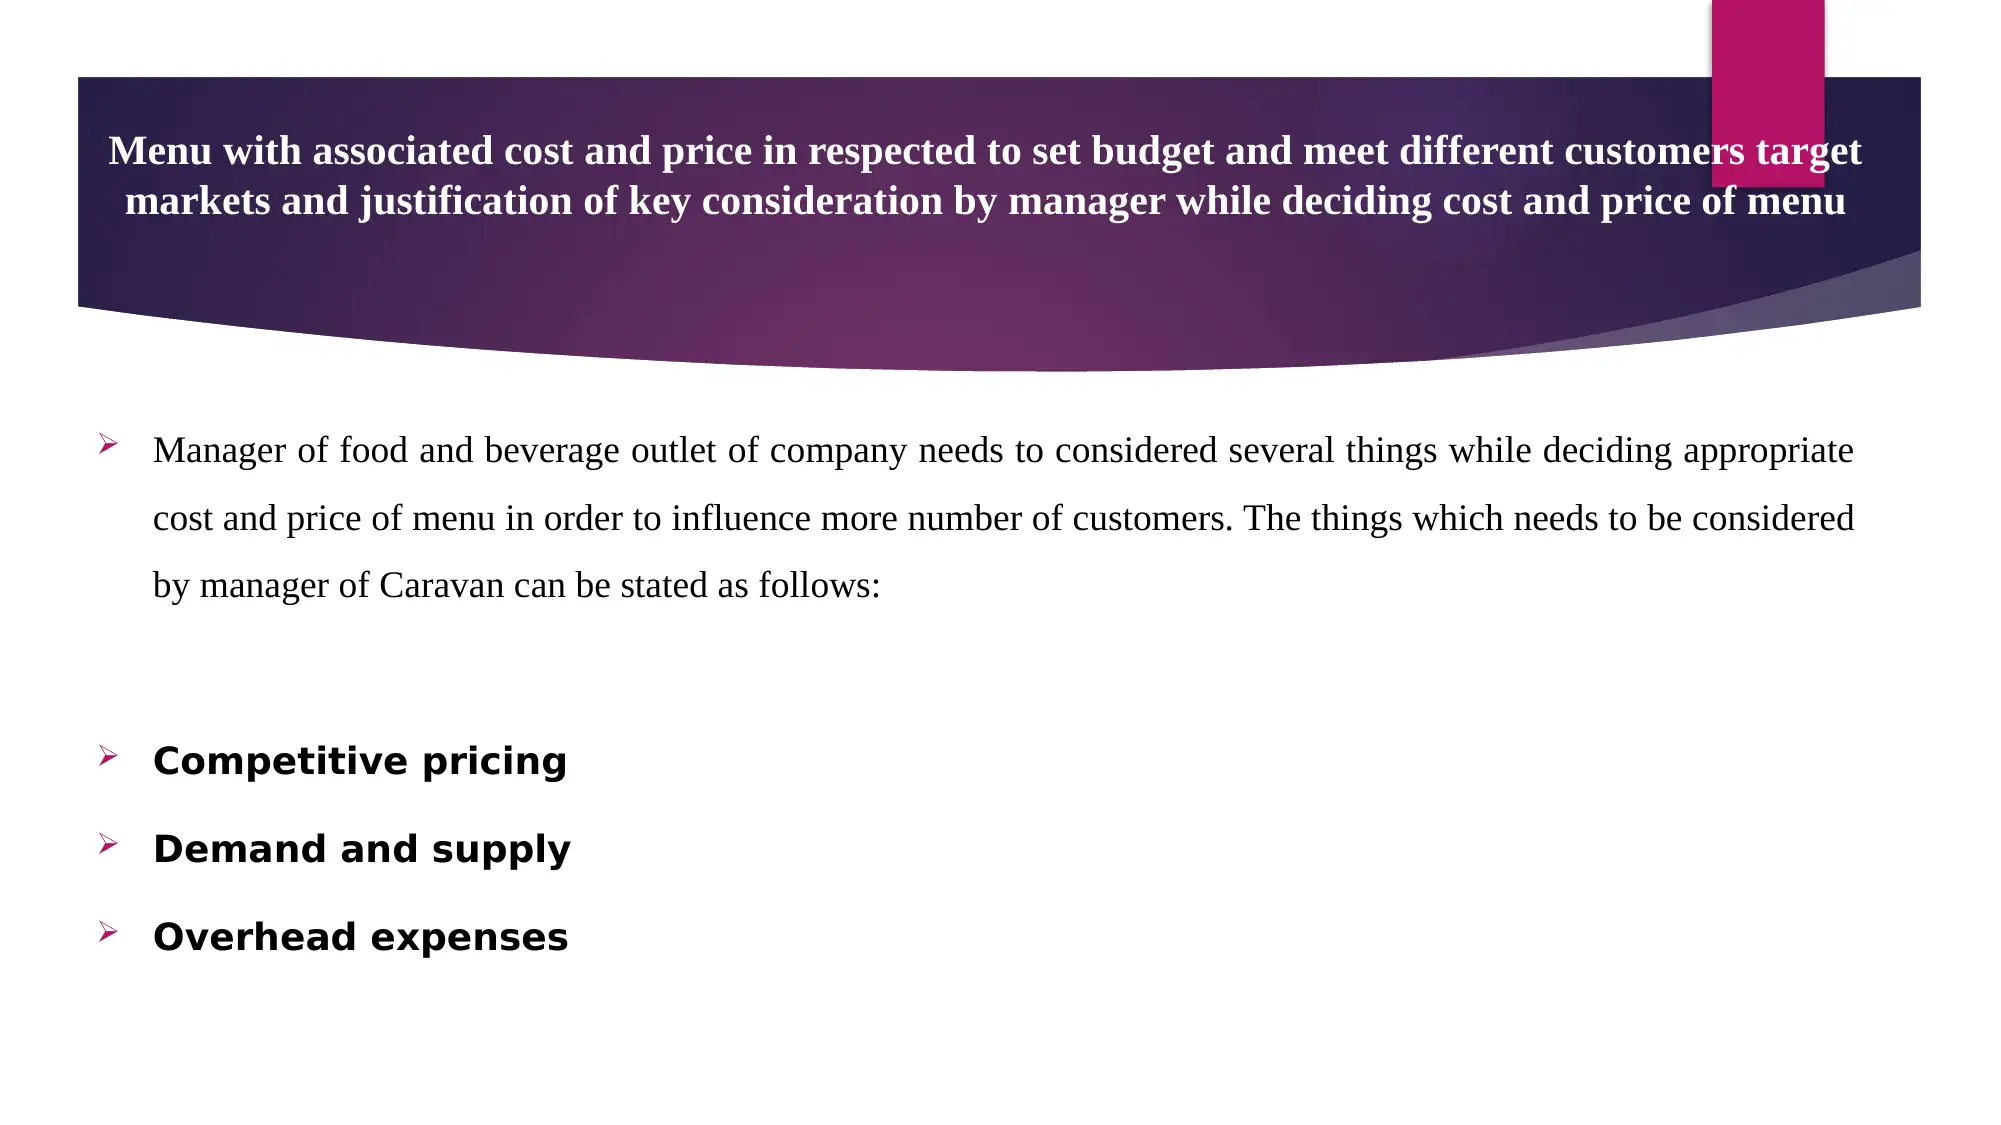
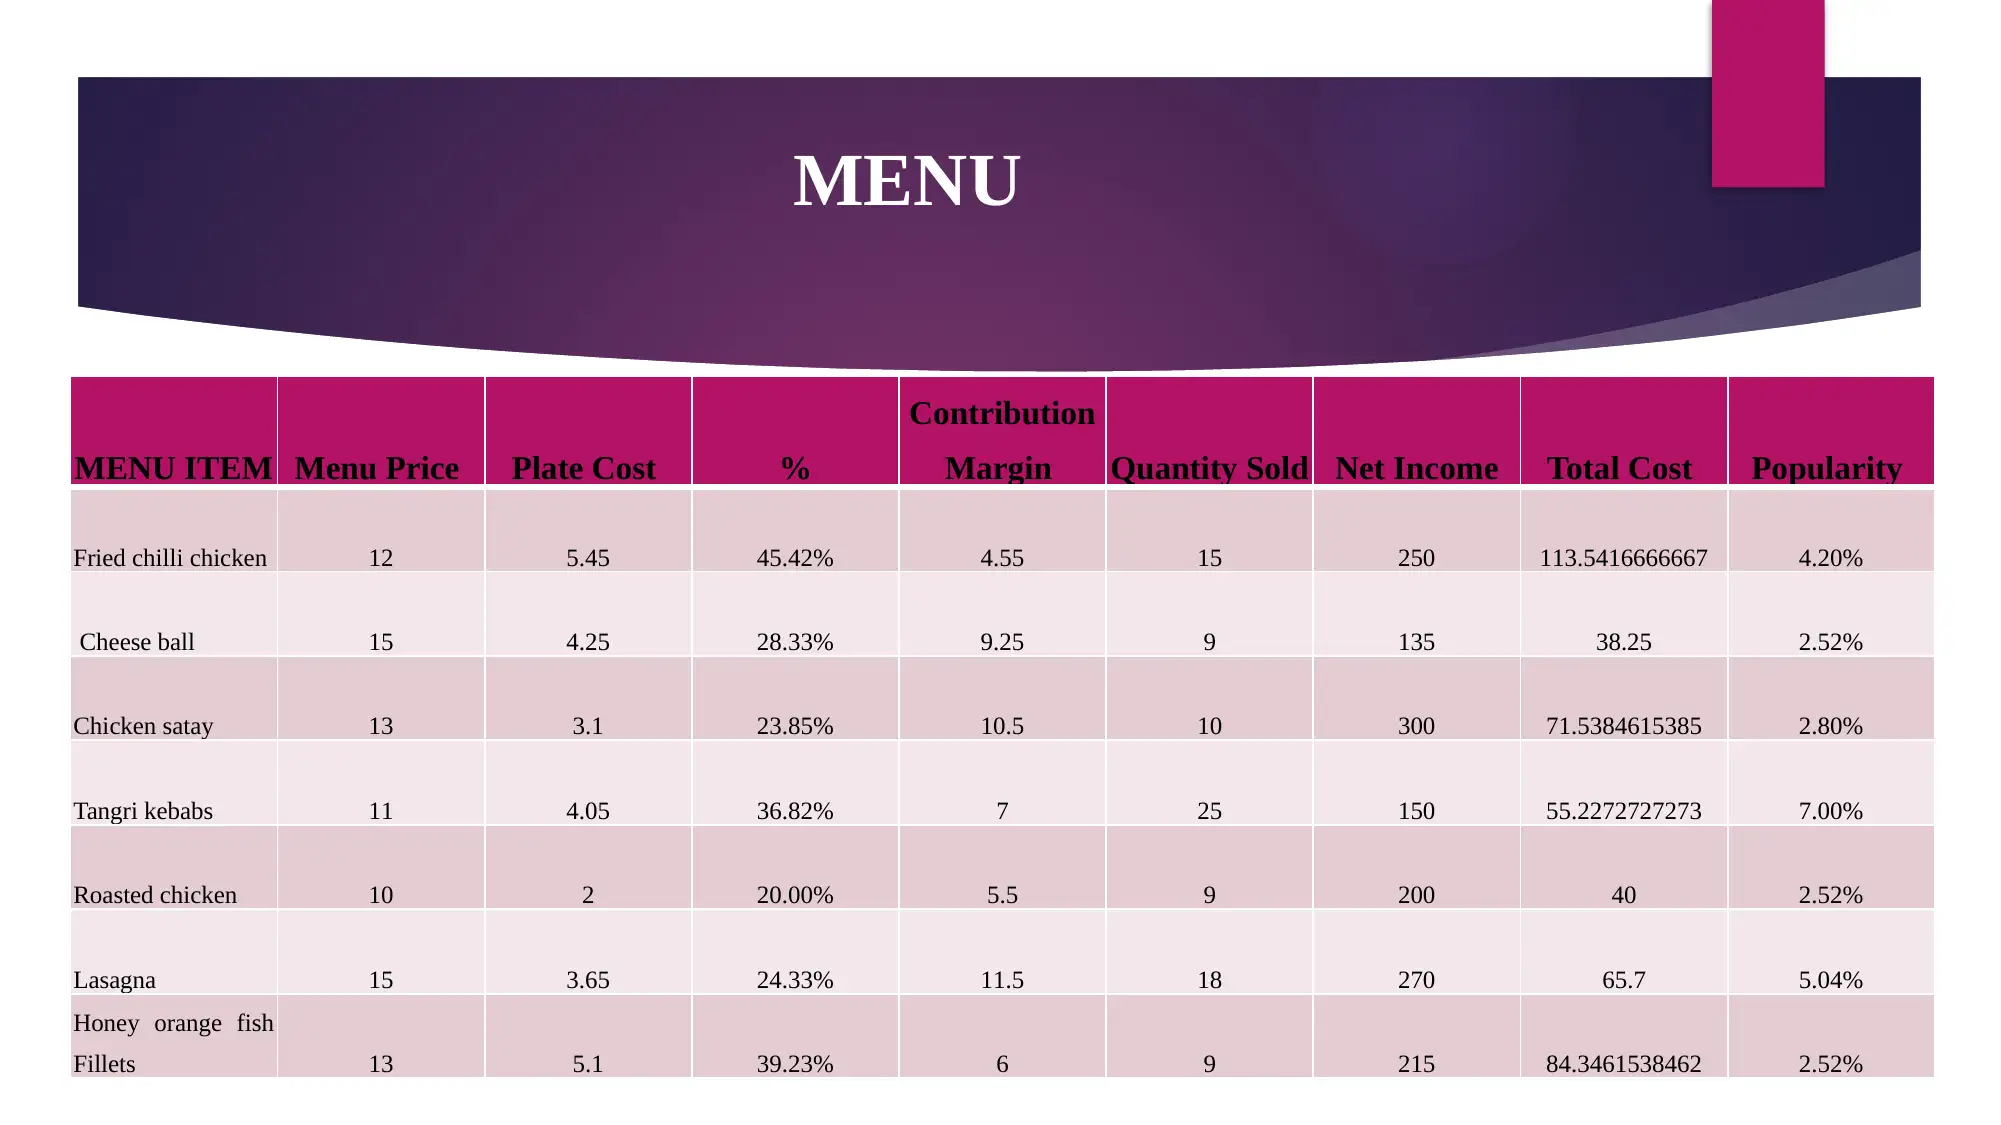
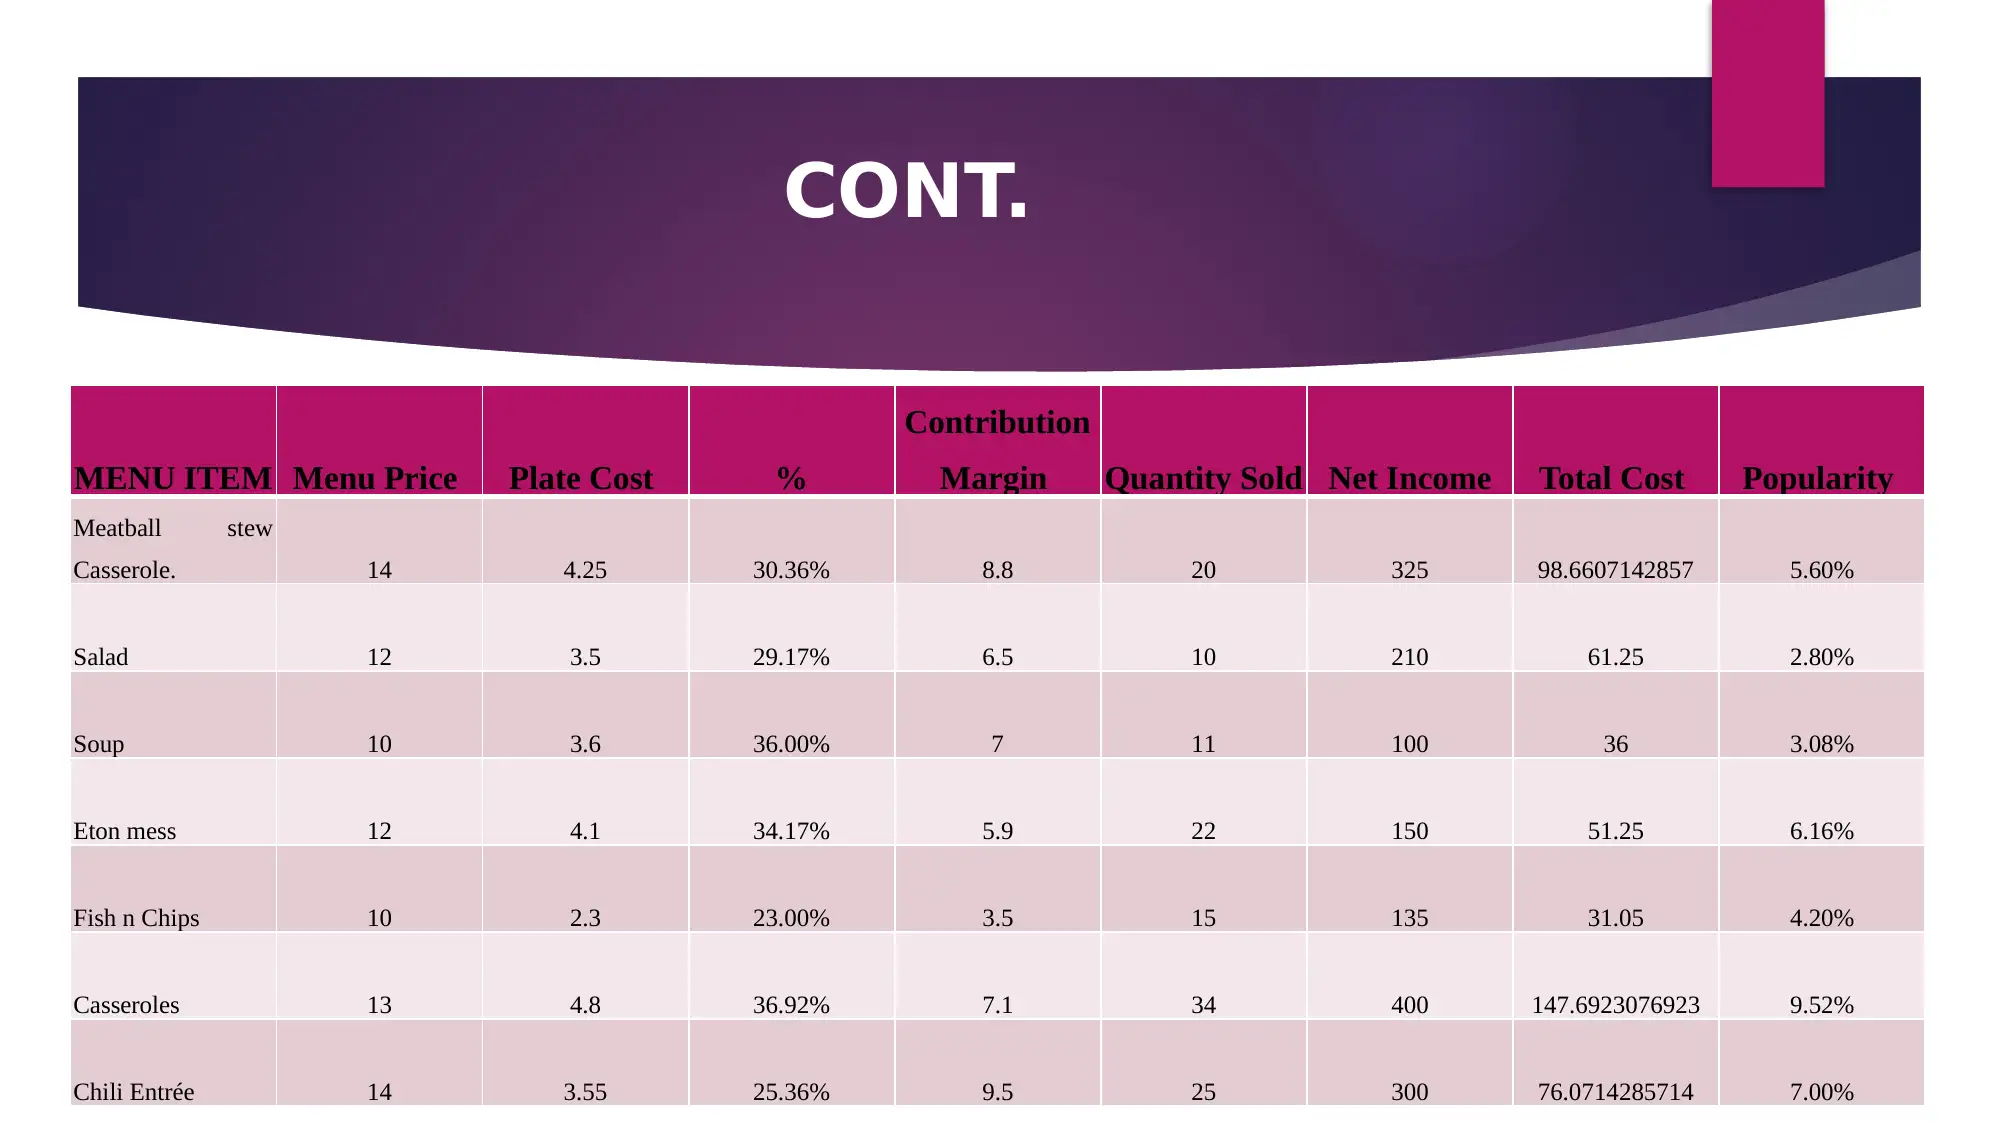
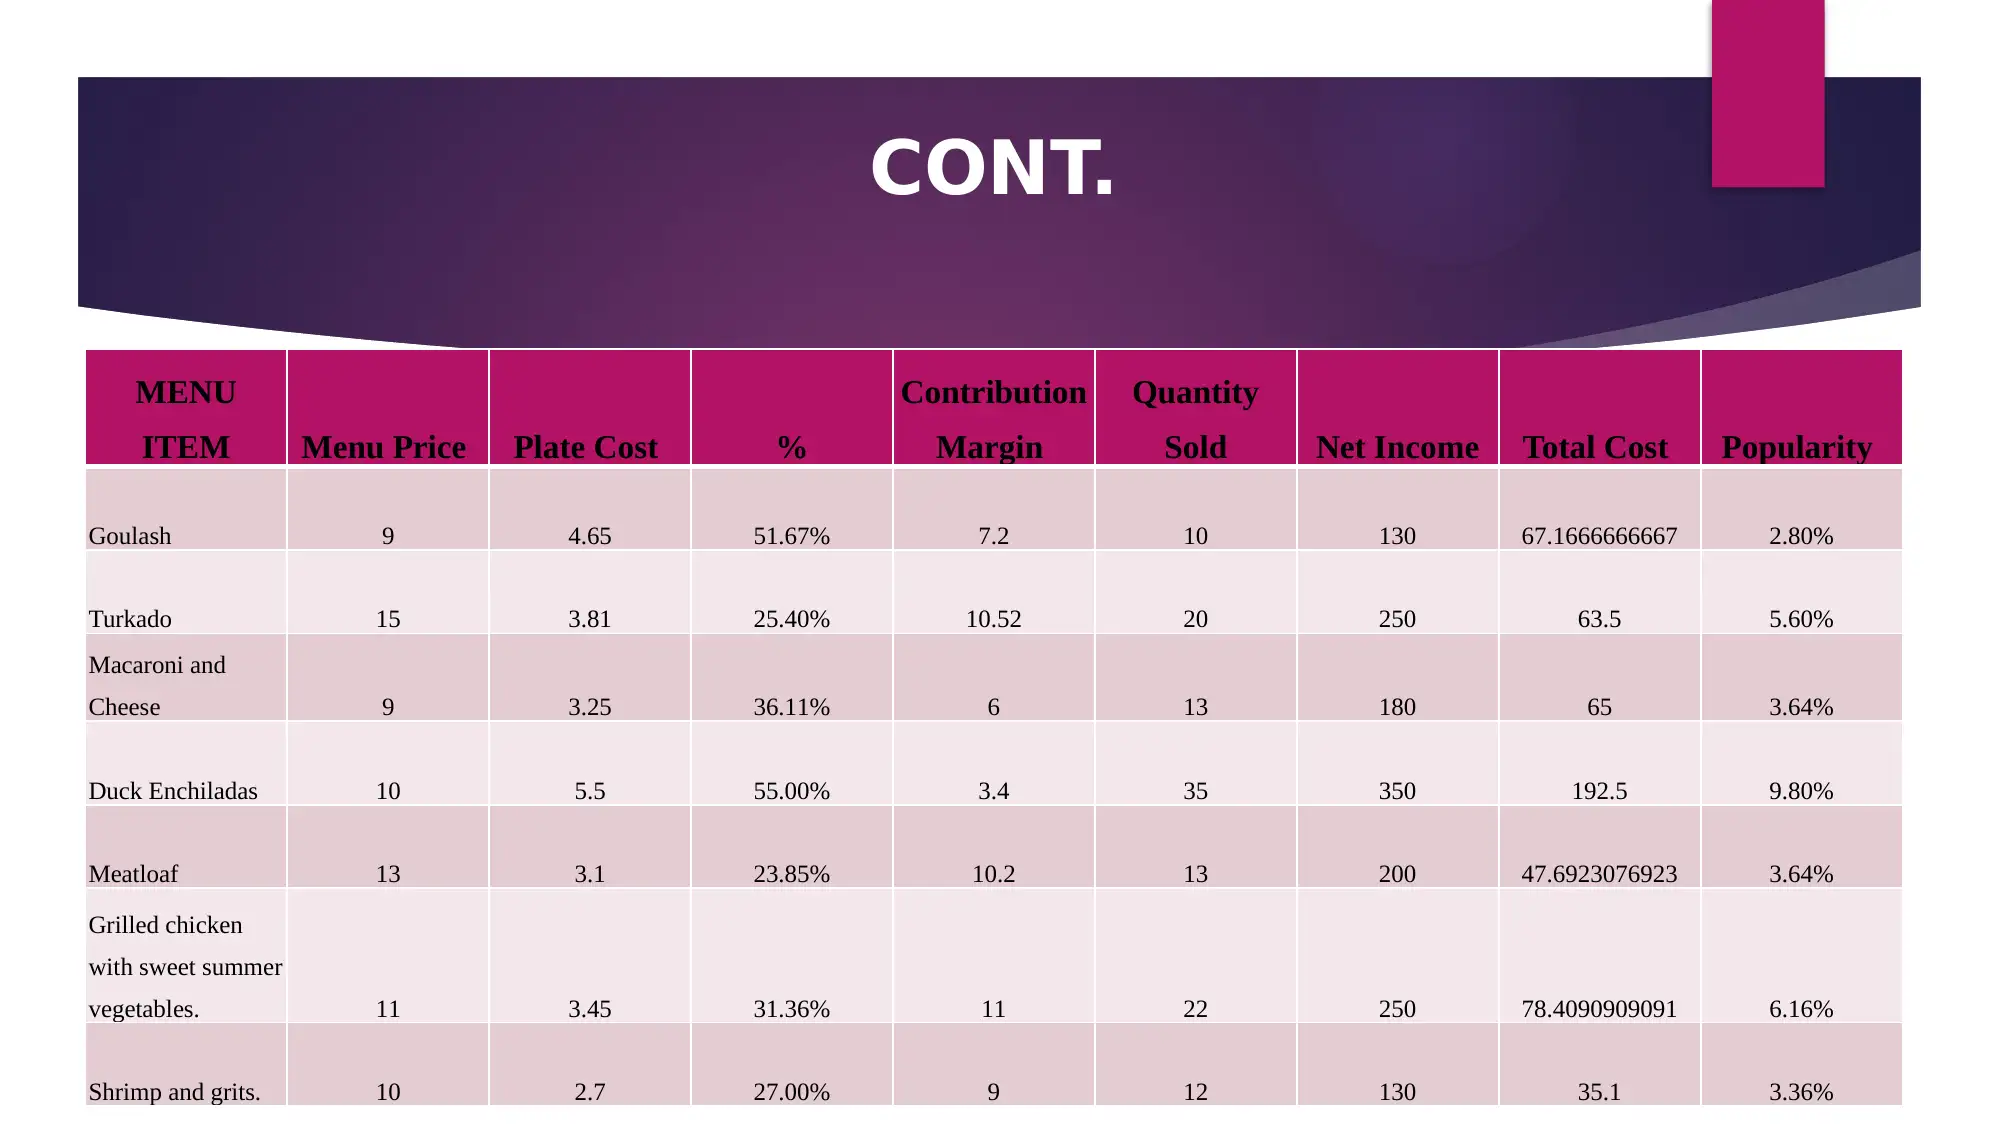
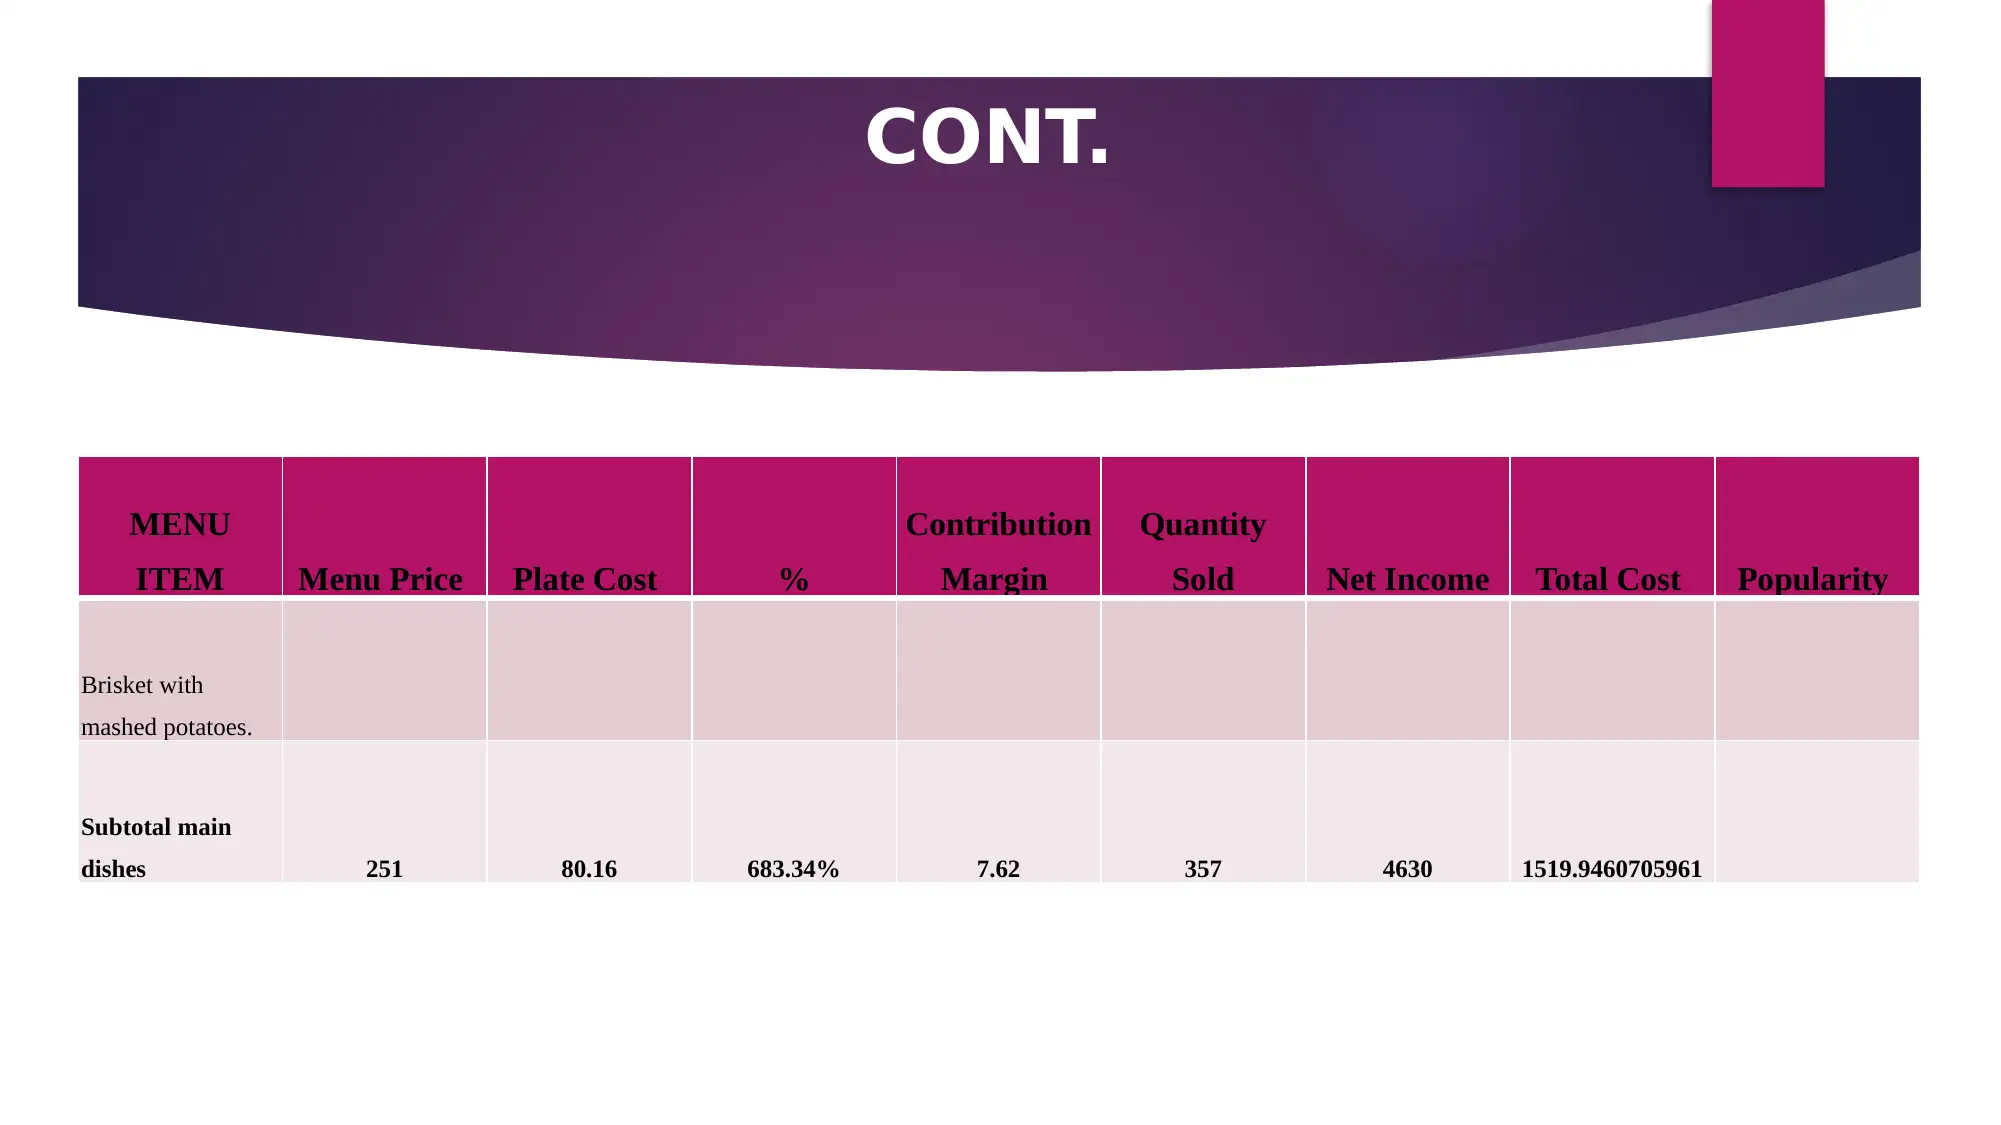
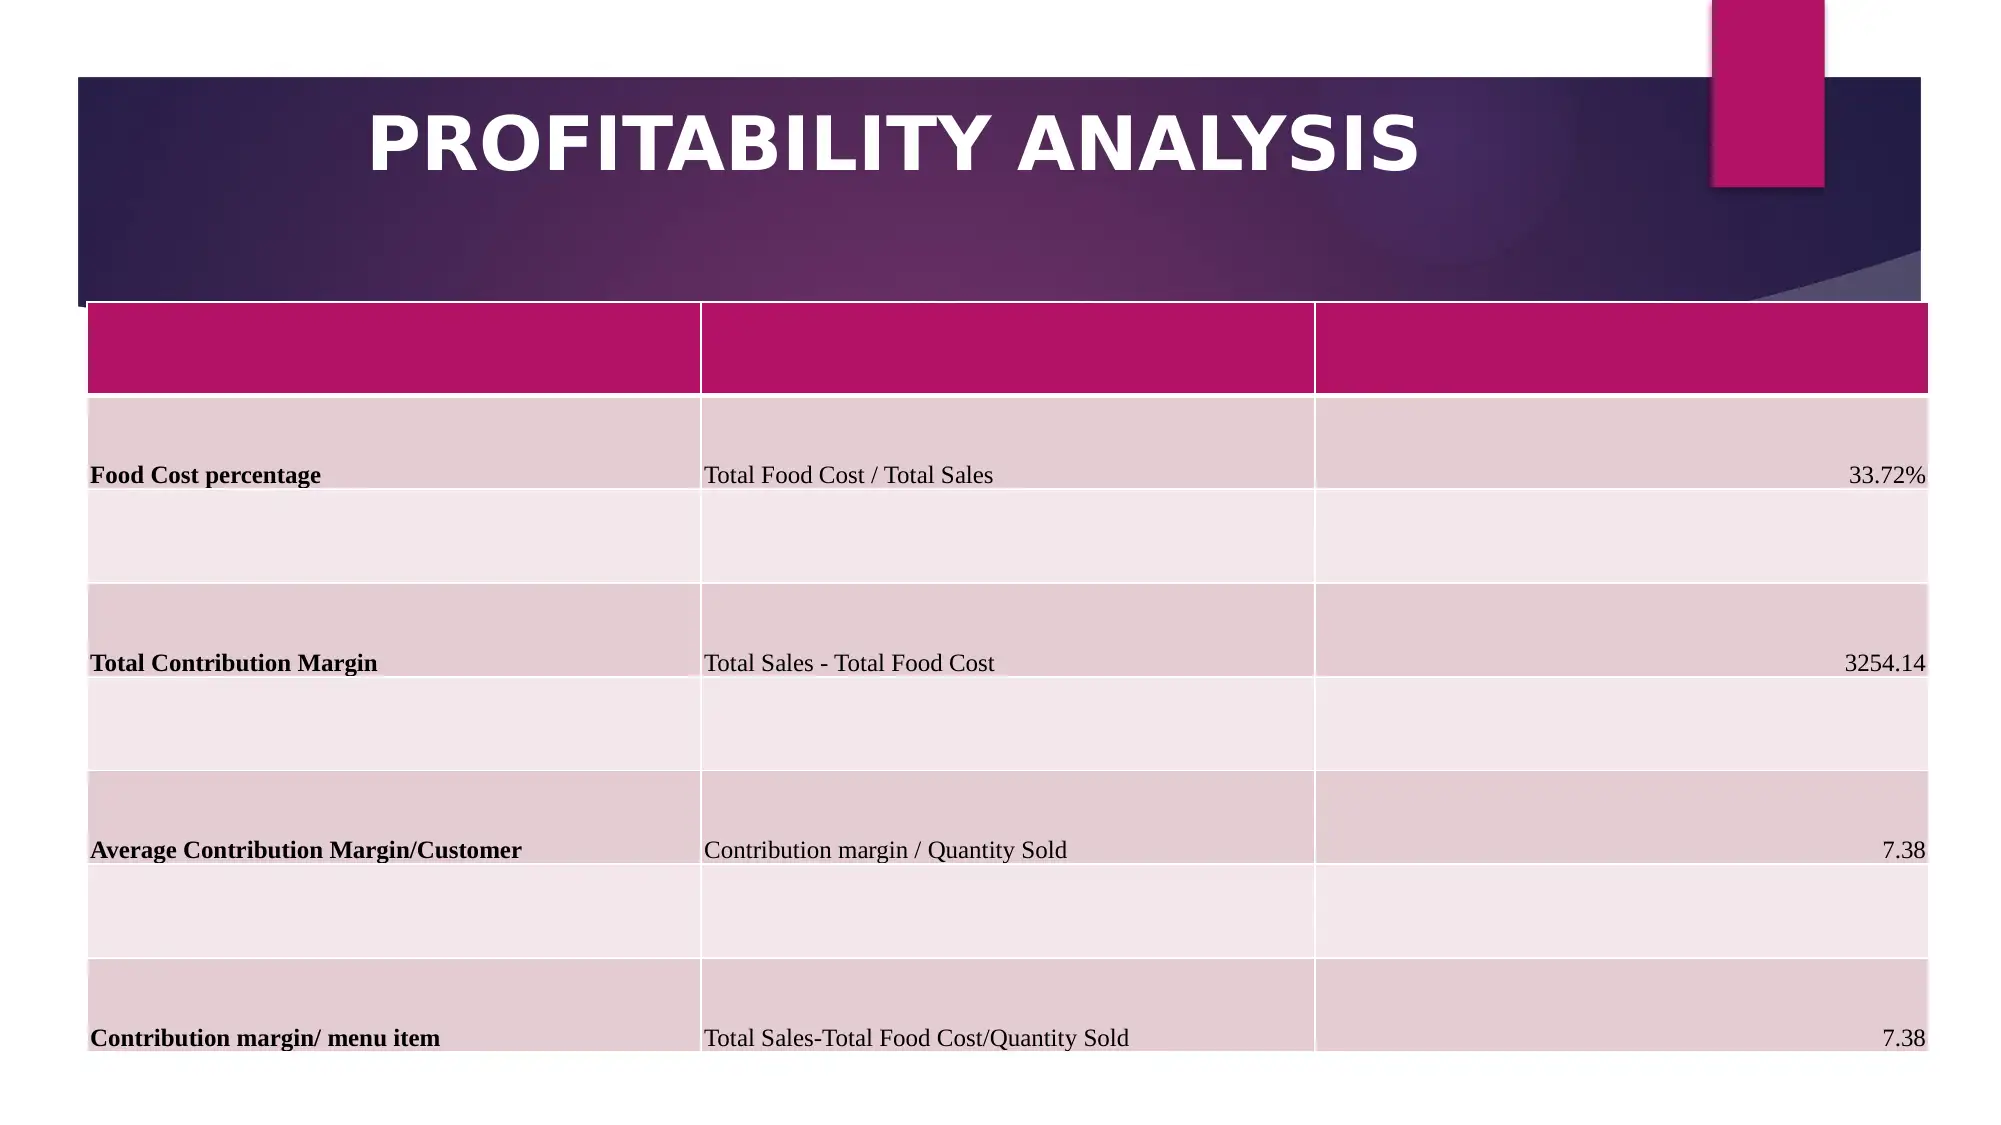
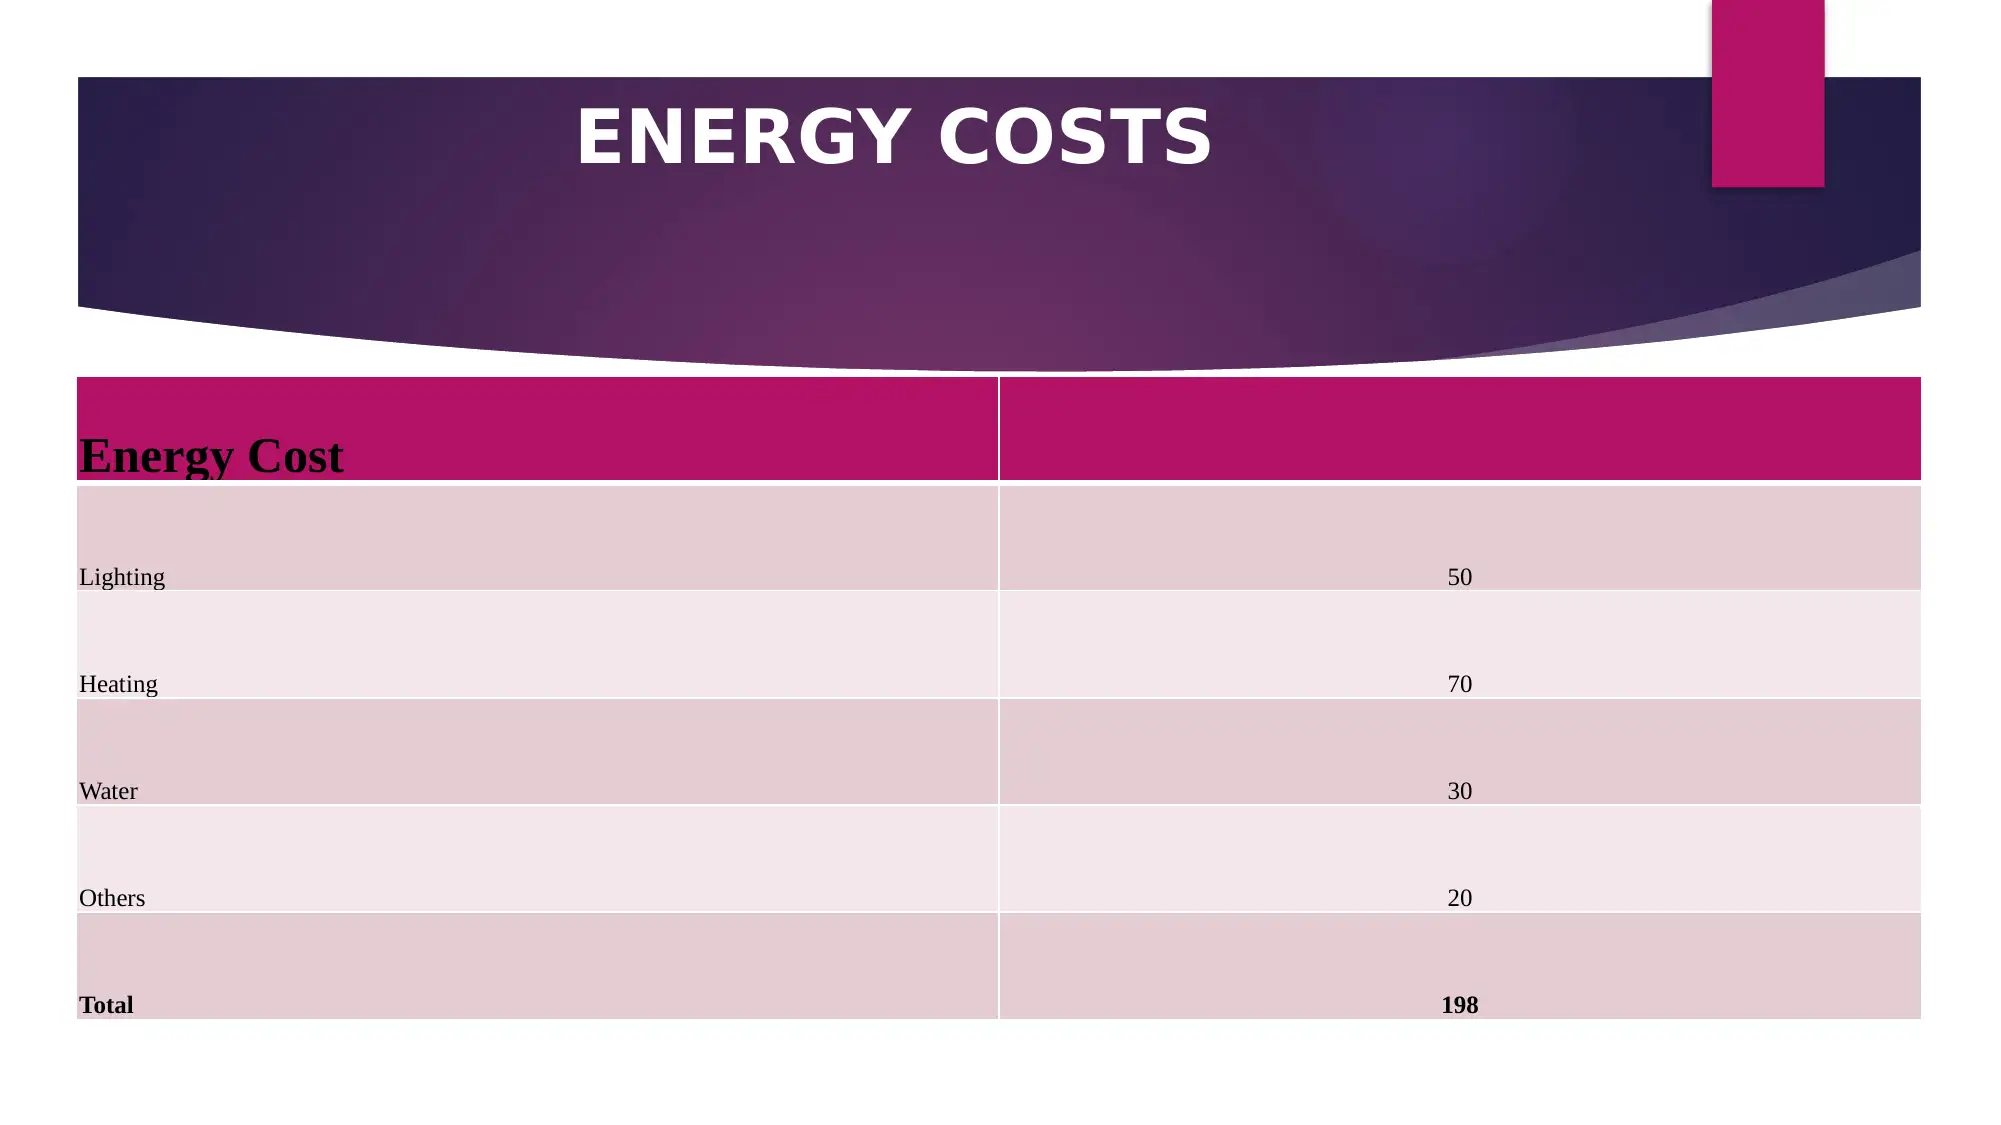
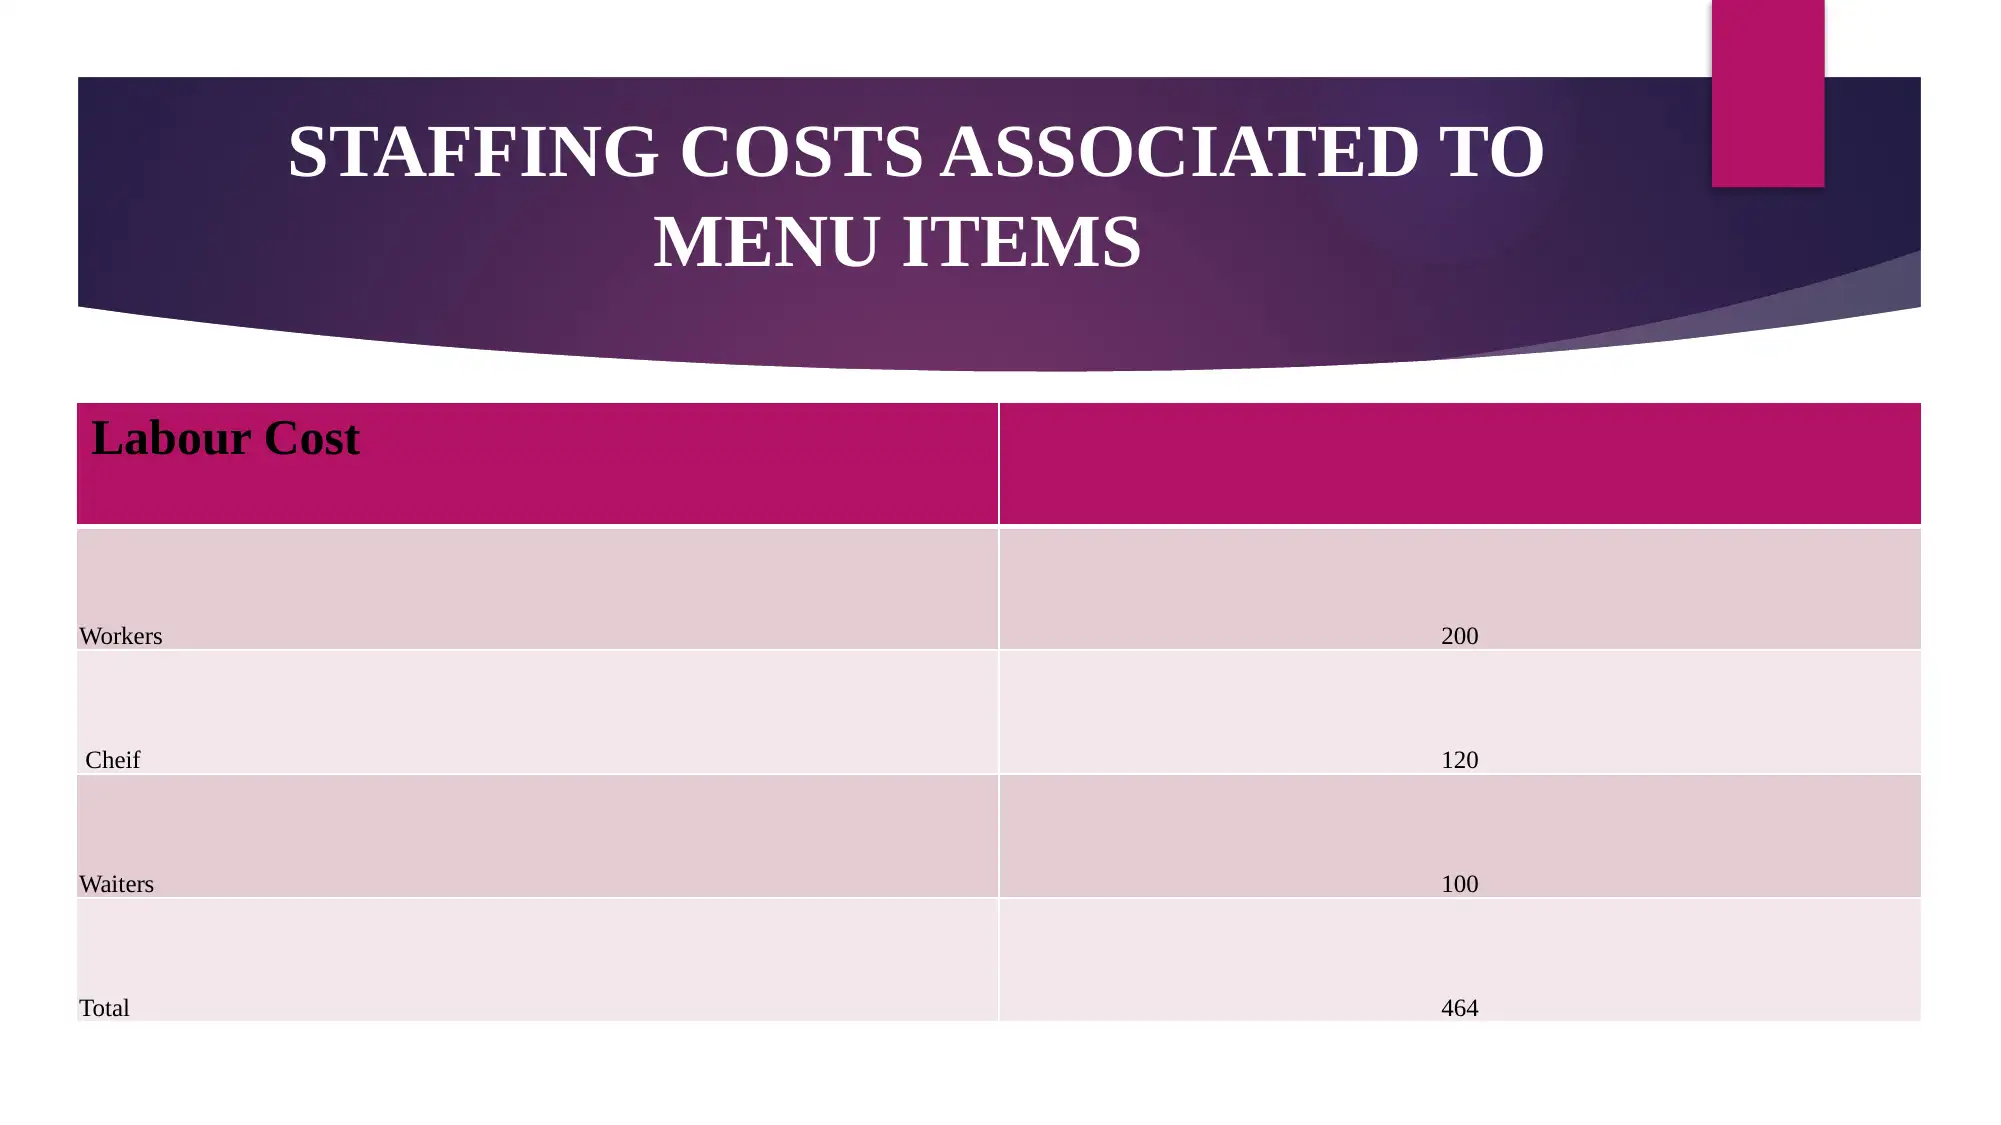
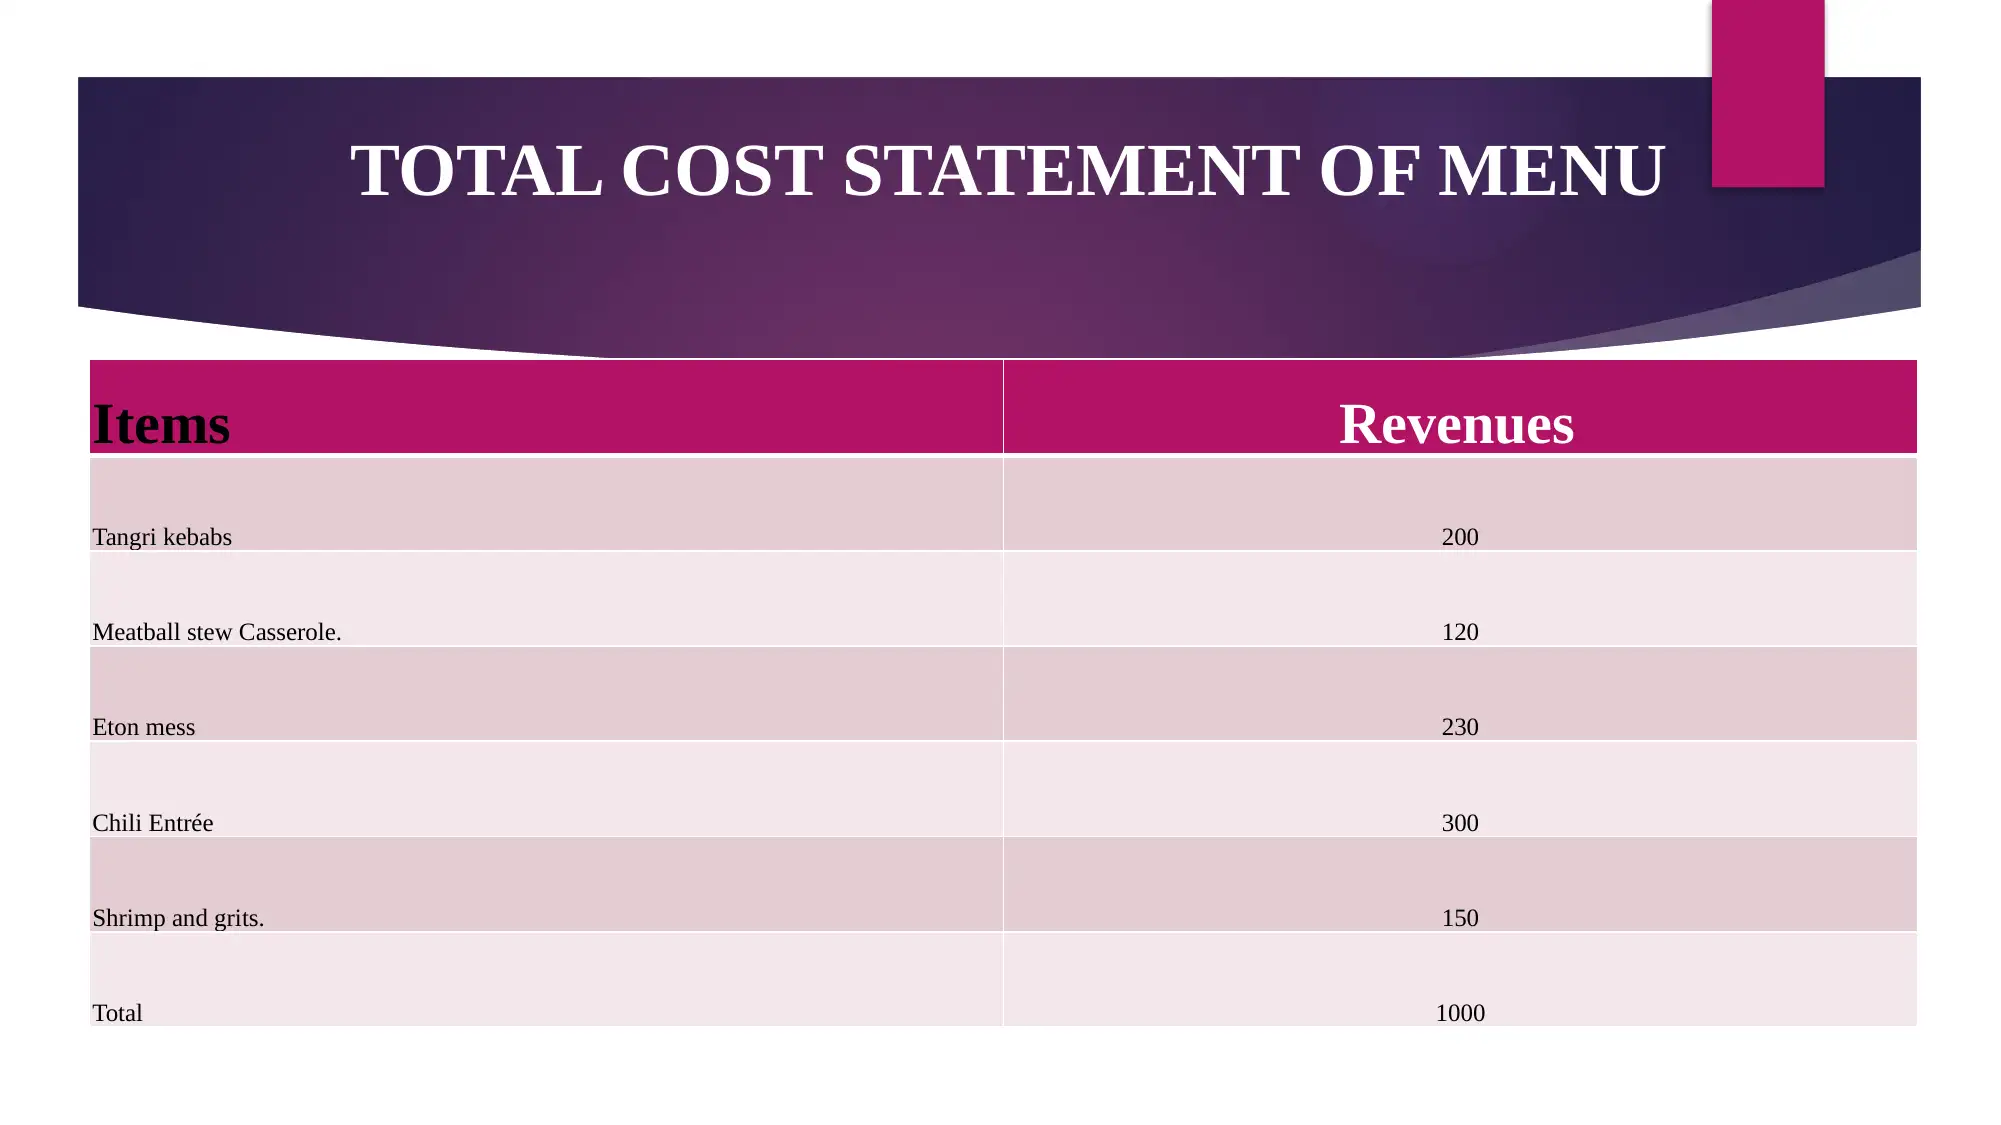
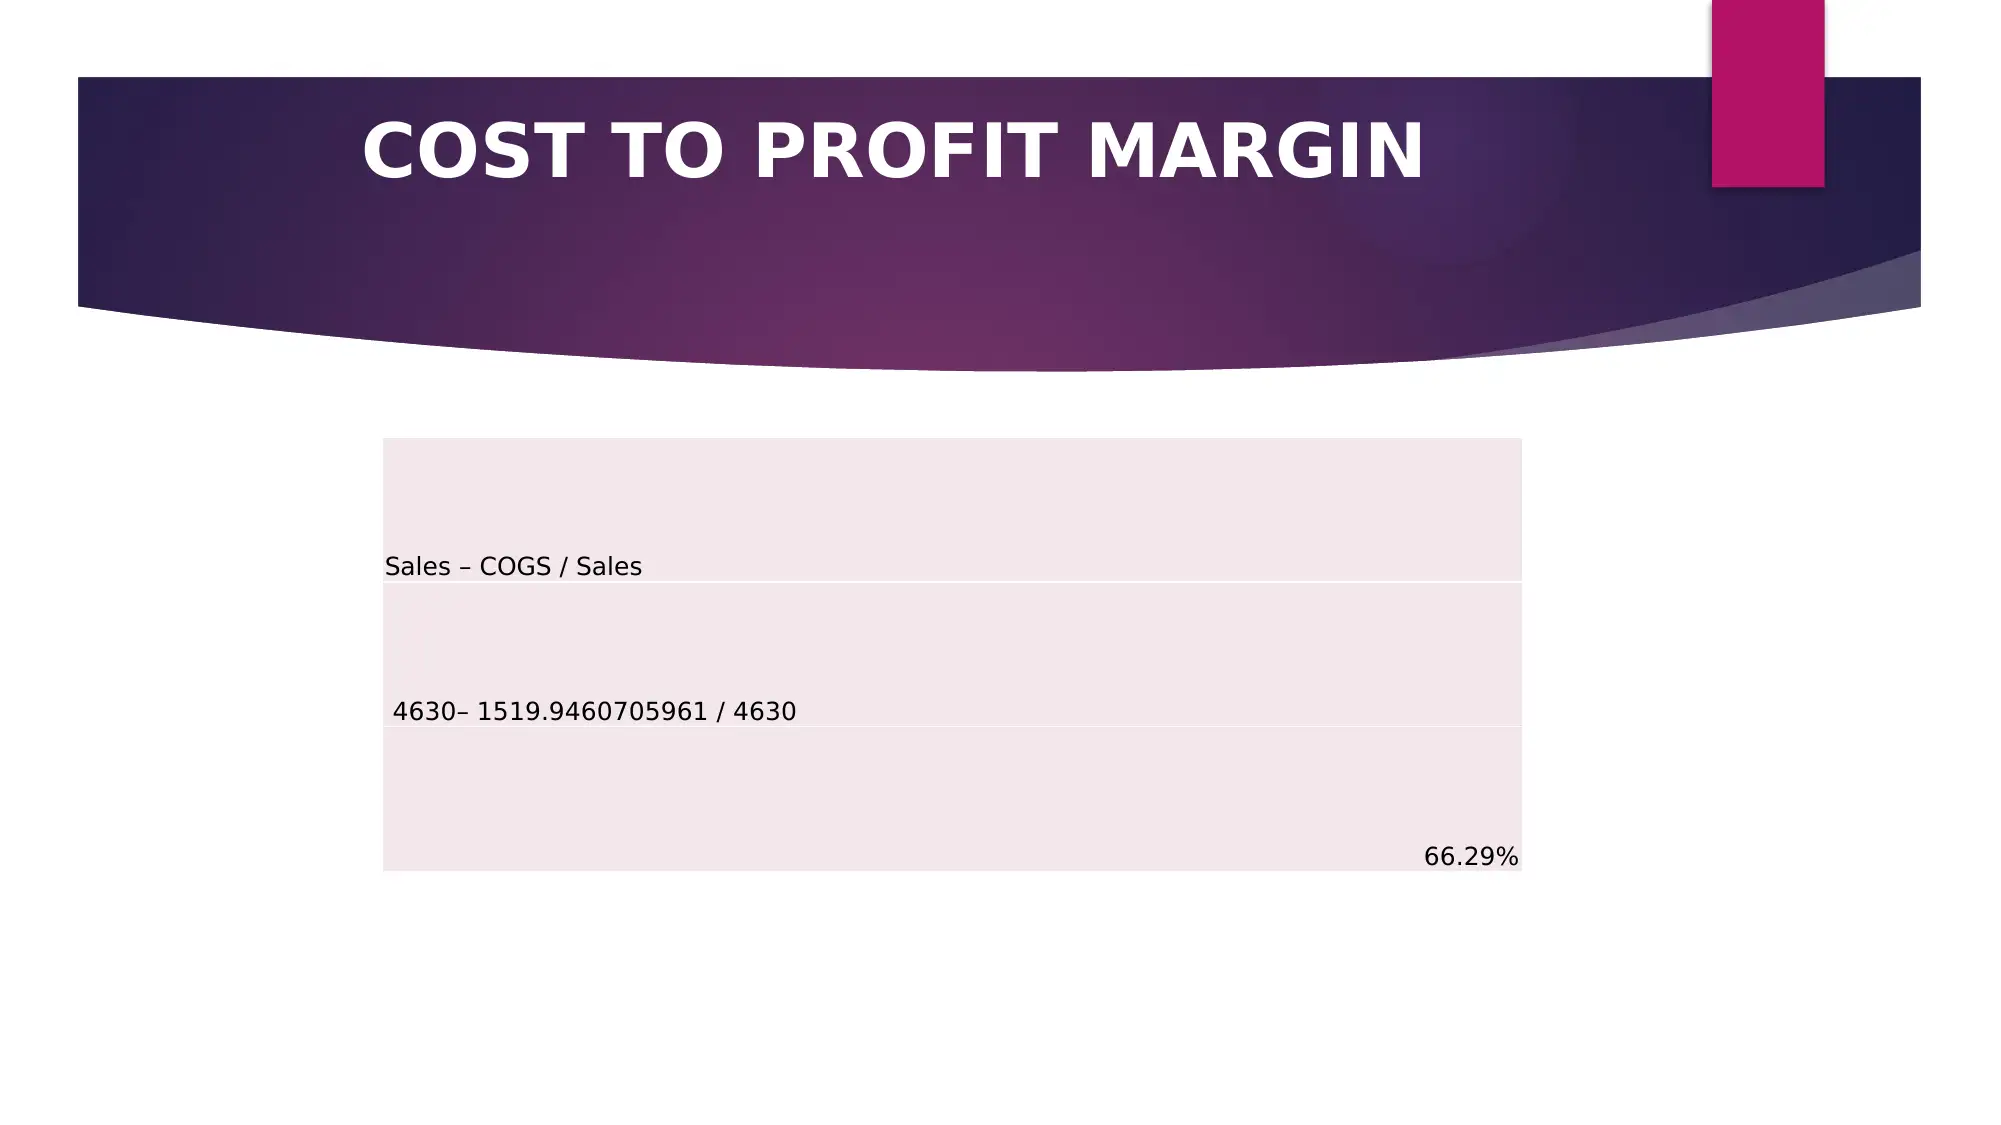
This report analyzes the development, planning, and design of a menu for a food and beverage company, focusing on attracting and retaining customers. It examines the importance of considering various factors like competitive pricing, demand, supply, and overhead expenses when determining menu costs and prices. The report provides a detailed menu with associated costs, prices, and profitability analysis, including food cost percentage, contribution margin, and break-even point. It also covers energy and staffing costs, revenue sources, and a cost statement. The conclusion emphasizes the importance of careful planning and strategic pricing for menu success and organizational growth. References to relevant academic articles are included to support the analysis.
Document Page
MENU DEVELOPMENT,
PLANNING AND DESIGN
tabler-icon-diamond-filled.svg

Paraphrase This Document

Need a fresh take? Get an instant paraphrase of this document with our AI Paraphraser
Document Page
INTRODUCTION
This report is about food and beverage company which is planning
to make a menu that could help in attracting and retaining number
of customers within organization for longer time frame.
Company needs to considered numerous points while taking
decision related to setting appropriate prices and cost of menu so
that people are motivated to select only specific firm for fulfilment
of needs of customers.
This presentation has included all necessary information related to
associated cost and price in context of budget for satisfaction of
different customers.
Document Page
Menu with associated cost and price in respected to set budget and meet different customers target
markets and justification of key consideration by manager while deciding cost and price of menu
Manager of food and beverage outlet of company needs to considered several things while deciding appropriate
cost and price of menu in order to influence more number of customers. The things which needs to be considered
by manager of Caravan can be stated as follows:
Competitive pricing
Demand and supply
Overhead expenses
Document Page
MENU
MENU ITEM Menu Price Plate Cost %
Contribution
Margin Quantity Sold Net Income Total Cost Popularity
Fried chilli chicken 12 5.45 45.42% 4.55 15 250 113.5416666667 4.20%
Cheese ball 15 4.25 28.33% 9.25 9 135 38.25 2.52%
Chicken satay 13 3.1 23.85% 10.5 10 300 71.5384615385 2.80%
Tangri kebabs 11 4.05 36.82% 7 25 150 55.2272727273 7.00%
Roasted chicken 10 2 20.00% 5.5 9 200 40 2.52%
Lasagna 15 3.65 24.33% 11.5 18 270 65.7 5.04%
Honey orange fish
Fillets 13 5.1 39.23% 6 9 215 84.3461538462 2.52%
tabler-icon-diamond-filled.svg

Paraphrase This Document

Need a fresh take? Get an instant paraphrase of this document with our AI Paraphraser
Document Page
CONT.
MENU ITEM Menu Price Plate Cost %
Contribution
Margin Quantity Sold Net Income Total Cost Popularity
Meatball stew
Casserole. 14 4.25 30.36% 8.8 20 325 98.6607142857 5.60%
Salad 12 3.5 29.17% 6.5 10 210 61.25 2.80%
Soup 10 3.6 36.00% 7 11 100 36 3.08%
Eton mess 12 4.1 34.17% 5.9 22 150 51.25 6.16%
Fish n Chips 10 2.3 23.00% 3.5 15 135 31.05 4.20%
Casseroles 13 4.8 36.92% 7.1 34 400 147.6923076923 9.52%
Chili Entrée 14 3.55 25.36% 9.5 25 300 76.0714285714 7.00%
Document Page
CONT.
MENU
ITEM Menu Price Plate Cost %
Contribution
Margin
Quantity
Sold Net Income Total Cost Popularity
Goulash 9 4.65 51.67% 7.2 10 130 67.1666666667 2.80%
Turkado 15 3.81 25.40% 10.52 20 250 63.5 5.60%
Macaroni and
Cheese 9 3.25 36.11% 6 13 180 65 3.64%
Duck Enchiladas 10 5.5 55.00% 3.4 35 350 192.5 9.80%
Meatloaf 13 3.1 23.85% 10.2 13 200 47.6923076923 3.64%
Grilled chicken
with sweet summer
vegetables. 11 3.45 31.36% 11 22 250 78.4090909091 6.16%
Shrimp and grits. 10 2.7 27.00% 9 12 130 35.1 3.36%
Document Page
CONT.
MENU
ITEM Menu Price Plate Cost %
Contribution
Margin
Quantity
Sold Net Income Total Cost Popularity
Brisket with
mashed potatoes.
Subtotal main
dishes 251 80.16 683.34% 7.62 357 4630 1519.9460705961
tabler-icon-diamond-filled.svg

Paraphrase This Document

Need a fresh take? Get an instant paraphrase of this document with our AI Paraphraser
Document Page
PROFITABILITY ANALYSIS
Food Cost percentage Total Food Cost / Total Sales 33.72%
Total Contribution Margin Total Sales - Total Food Cost 3254.14
Average Contribution Margin/Customer Contribution margin / Quantity Sold 7.38
Contribution margin/ menu item Total Sales-Total Food Cost/Quantity Sold 7.38
Document Page
ENERGY COSTS
Energy Cost
Lighting 50
Heating 70
Water 30
Others 20
Total 198
Document Page
STAFFING COSTS ASSOCIATED TO
MENU ITEMS
Labour Cost
Workers 200
Cheif 120
Waiters 100
Total 464
tabler-icon-diamond-filled.svg

Paraphrase This Document

Need a fresh take? Get an instant paraphrase of this document with our AI Paraphraser
Document Page
TOTAL COST STATEMENT OF MENU
Items Revenues
Tangri kebabs 200
Meatball stew Casserole. 120
Eton mess 230
Chili Entrée 300
Shrimp and grits. 150
Total 1000
Document Page
COST TO PROFIT MARGIN
Sales – COGS / Sales
4630– 1519.9460705961 / 4630
66.29%
chevron_up_icon
1 out of 17
circle_padding
hide_on_mobile
zoom_out_icon