Financial Analysis of Mercury NZ International (FIN600 Report)
VerifiedAdded on 2023/01/10
|14
|4390
|88
Report
AI Summary
This report offers a comprehensive financial and operating environment analysis of Mercury NZ International, an ASX-listed utilities company headquartered in New Zealand. The analysis focuses on the company's financial performance over 2017 and 2018, utilizing annual reports to evaluate its income statement, balance sheet, and cash flow statement. Ratio analysis, including profitability, efficiency, liquidity, and gearing ratios, is conducted to assess future growth potential and compare performance with industry averages. The report also examines external factors, such as political and social influences, and ethical considerations affecting the company. Overall, the assignment demonstrates the application of accounting knowledge and skills in understanding the financial and operational aspects of a real-world company.
MERCURY NZ
INTERNATIONAL
FIN600 TX YYYY
NAME:
STUDENT ID:
INTERNATIONAL
FIN600 TX YYYY
NAME:
STUDENT ID:
Paraphrase This Document
Need a fresh take? Get an instant paraphrase of this document with our AI Paraphraser
Student name – ID FIN600 TX YYYY
Assignment –Mercury NZ International
Executive Summary-
The report takes into account financial and operating environment analysis of an ASX listed
company Mercury NZ International having its headquarters in New Zealand. It operates as a
utilities industry providing electricity services to the consumers.
Through the analysis, an overview of the company and its financial performance over the last two
years has been established. Annual report for the year 2018 and 2017 of Mercury NZ are being
considered for such analysis. For the purpose of establishing the future growth potential and
continuity of the company, ratio analysis considering the factors of profitability, efficiency, liquidity
etc has been undertaken along with comparison with the industry averages for certain ratios. At last,
external factors such as political and social factors along with ethical issues faced by the company
during the years have been discussed to elaborate the position of the company.
Overall, the assignment provides an understanding of the various aspects of financial as well
operating environment of a real existent company whilst applying the accounting knowledge and
skills.
1
Student name – ID FIN600 TX YYYY
Assignment –Mercury NZ International
Contents
Page Number
1 Introduction 3
1.1 Background and Business
2 Company Analysis
2.1 Analysis of financial statements of the business 3
Current Financial performance, economic outlook
3 Ratio Analysis
3.1 Profitability ratios 4
3.2 Efficiency ratios 5
3.3 Liquidity ratios 6
3.4 Gearing ratios 7
4 Recommendations and overall assessment 8
5 References/Bibliography 9
Appendices – attached Excel Spreadsheet
2
⊘ This is a preview!⊘
Do you want full access?
Subscribe today to unlock all pages.
Trusted by 1+ million students worldwide
Student name – ID FIN600 TX YYYY
Assignment –Mercury NZ International
1 Introduction-
1.1 Background and Business
Mercury NZ International is a government owned company, headquartered in Auckland however
listed on both Australian as well as New Zealand Stock exchanges. It was earlier known as Mighty
River Power Limited and believes in making the world better, energy-efficient and wonderful. The
logo with which the company swears by is “Bee” symbolizing constant life and energy generation.
The company is engaged in retail trading of electricity for both domestic and commercial usage
across the country through its 100 percent renewable energy sources of power generation. It
generates electricity through its nine hydro generation and five geothermal plants located mainly in
the North Island of the country and retails the energy so generated in form of electricity through
various brand names such as Tiny Mighty, GLOBUG and Bosco. These remain fully functional
throughout the year considering huge resource potential with the country and Mercury’s constant
efforts to keep them sustainable. This not only provides the advantages of being at the lowest cost
electricity providers but also makes them one of the largest electricity suppliers and generators in
the country. Apart from its energy market segment, the company also provides metering
infrastructure and solar power installation services to the industries across the country.
2 Company Analysis-
2.1 Financial statements, Current Financial performance, economic outlook
In order to obtain an understanding of the company; Mercury NZ and the financial and economic
scenario prevalent, annual reports for the year 2017 and 2018 have been taken into consideration.
An analysis of the financial statements comprising income statement, balance sheet, cash flow
statement and other notes attached to them gives an insight of its operations over the years and
helps in evaluating its financial performance.
The year 2018 was marked as another record setting year for the company with core earnings of
$561 million, an expansion of $38 million on the past budgetary year. Accordingly, the net profits
for the company increased and stood at $ 234 million providing an increase of around $ 50 million.
This is due to the efforts of the company in keeping its operating costs at standstill of $ 214 million
over the last five years with a constant increase in its revenue. Apart from this, increased hydro
power generation during the year 2018 pinned the growth in profits.
The company provided an increase in its asset base by over $ 945 million due to the healthy
acquisitions made during 2018 of Tilt Renewable in NZX. Buy-back of $ 50 million provided a
flexible balance sheet with treasury stock along with reduced gearing levels as the debt portion
increased by $ 211 million during the year.
The company has started FY 2019 on a strong note with hydro power generation at 84th percentile
3
Paraphrase This Document
Need a fresh take? Get an instant paraphrase of this document with our AI Paraphraser
Student name – ID FIN600 TX YYYY
Assignment –Mercury NZ International
and sustained heavy competition with incarsed churn for the quarter ending September 2018.
Thus, overall the current financial performance of the company is healthy and positive looking. The
indicators of growth are being clearly visible from its financial position.
The outlook of the company is clear as it continues to deliver positive results for its first quarter of
FY 2019. The forecasted statements for the next five years established the fact of ongoing growth
and justified execution of plans being made. The company aims at delivering more meaningful
growth for its stakeholders considering the competition at retail levels. It highlights key activities
for the years coming forth with continual promotion of low-cost product along with development of
its brand name and loyalty of customers. A road show evaluating the economy for New Zealand
provides clear indication of competitive prices and thus the dependence on renewable sources is
advantageous to the company.
3 Ratio Analysis-
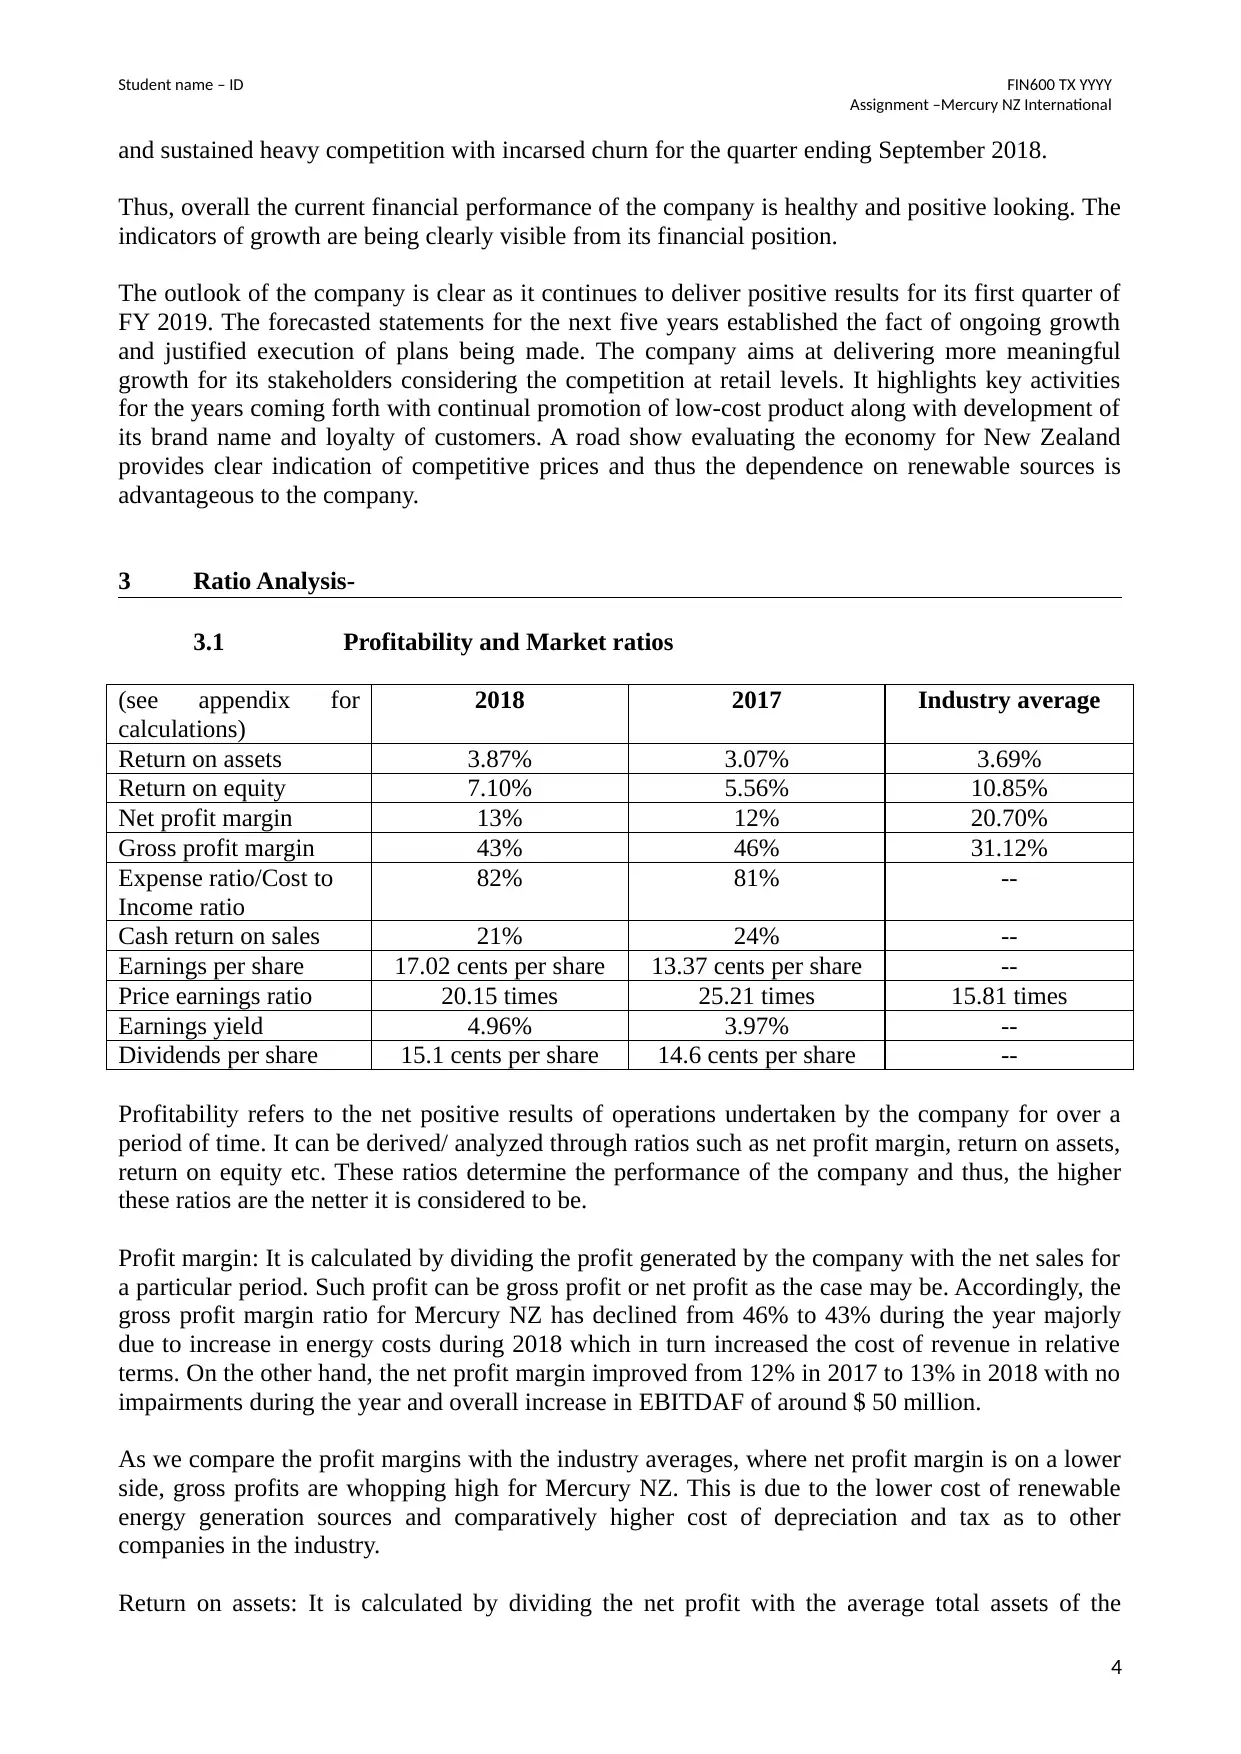
3.1 Profitability and Market ratios
(see appendix for
calculations)
2018 2017 Industry average
Return on assets 3.87% 3.07% 3.69%
Return on equity 7.10% 5.56% 10.85%
Net profit margin 13% 12% 20.70%
Gross profit margin 43% 46% 31.12%
Expense ratio/Cost to
Income ratio
82% 81% --
Cash return on sales 21% 24% --
Earnings per share 17.02 cents per share 13.37 cents per share --
Price earnings ratio 20.15 times 25.21 times 15.81 times
Earnings yield 4.96% 3.97% --
Dividends per share 15.1 cents per share 14.6 cents per share --
Profitability refers to the net positive results of operations undertaken by the company for over a
period of time. It can be derived/ analyzed through ratios such as net profit margin, return on assets,
return on equity etc. These ratios determine the performance of the company and thus, the higher
these ratios are the netter it is considered to be.
Profit margin: It is calculated by dividing the profit generated by the company with the net sales for
a particular period. Such profit can be gross profit or net profit as the case may be. Accordingly, the
gross profit margin ratio for Mercury NZ has declined from 46% to 43% during the year majorly
due to increase in energy costs during 2018 which in turn increased the cost of revenue in relative
terms. On the other hand, the net profit margin improved from 12% in 2017 to 13% in 2018 with no
impairments during the year and overall increase in EBITDAF of around $ 50 million.
As we compare the profit margins with the industry averages, where net profit margin is on a lower
side, gross profits are whopping high for Mercury NZ. This is due to the lower cost of renewable
energy generation sources and comparatively higher cost of depreciation and tax as to other
companies in the industry.
Return on assets: It is calculated by dividing the net profit with the average total assets of the
4
Assignment –Mercury NZ International
and sustained heavy competition with incarsed churn for the quarter ending September 2018.
Thus, overall the current financial performance of the company is healthy and positive looking. The
indicators of growth are being clearly visible from its financial position.
The outlook of the company is clear as it continues to deliver positive results for its first quarter of
FY 2019. The forecasted statements for the next five years established the fact of ongoing growth
and justified execution of plans being made. The company aims at delivering more meaningful
growth for its stakeholders considering the competition at retail levels. It highlights key activities
for the years coming forth with continual promotion of low-cost product along with development of
its brand name and loyalty of customers. A road show evaluating the economy for New Zealand
provides clear indication of competitive prices and thus the dependence on renewable sources is
advantageous to the company.
3 Ratio Analysis-
3.1 Profitability and Market ratios
(see appendix for
calculations)
2018 2017 Industry average
Return on assets 3.87% 3.07% 3.69%
Return on equity 7.10% 5.56% 10.85%
Net profit margin 13% 12% 20.70%
Gross profit margin 43% 46% 31.12%
Expense ratio/Cost to
Income ratio
82% 81% --
Cash return on sales 21% 24% --
Earnings per share 17.02 cents per share 13.37 cents per share --
Price earnings ratio 20.15 times 25.21 times 15.81 times
Earnings yield 4.96% 3.97% --
Dividends per share 15.1 cents per share 14.6 cents per share --
Profitability refers to the net positive results of operations undertaken by the company for over a
period of time. It can be derived/ analyzed through ratios such as net profit margin, return on assets,
return on equity etc. These ratios determine the performance of the company and thus, the higher
these ratios are the netter it is considered to be.
Profit margin: It is calculated by dividing the profit generated by the company with the net sales for
a particular period. Such profit can be gross profit or net profit as the case may be. Accordingly, the
gross profit margin ratio for Mercury NZ has declined from 46% to 43% during the year majorly
due to increase in energy costs during 2018 which in turn increased the cost of revenue in relative
terms. On the other hand, the net profit margin improved from 12% in 2017 to 13% in 2018 with no
impairments during the year and overall increase in EBITDAF of around $ 50 million.
As we compare the profit margins with the industry averages, where net profit margin is on a lower
side, gross profits are whopping high for Mercury NZ. This is due to the lower cost of renewable
energy generation sources and comparatively higher cost of depreciation and tax as to other
companies in the industry.
Return on assets: It is calculated by dividing the net profit with the average total assets of the
4
Student name – ID FIN600 TX YYYY
Assignment –Mercury NZ International
company. Mercury NZ demonstrates an increase in return on assets ratio during the year from
3.07% in 2017 to 3.87% in 2018. The improvement in return is backed by increase in net profit
during 2018 due to hydro power generation at huge capacity levels.
Return on equity: It is calculated by dividing the net profit of the year with the total shareholders’
equity of the company. In line with return on assets, Mercury NZ’s return on equity also improved
during 2018. It increased from 5.56% in 2017 to 7.10% in 2018 with increase in net profits and
simultaneous decrease in total shareholders ‘equity due to buy-back undertaken by Mercury of $ 50
million during 2018.
Comparison to industry averages provide return on assets of Mercury NZ to be at higher levels as
compared to return on equity which are at lower sides. This can be understood in a manner that the
company incurs depreciation costs on varying levels due to its higher asset base and thus suffers
difference in net profits. Also, considering the EBITDAF to evaluate return, Mercury NZ shall
overshadow the averages and outshine ahead of its peers.
Market ratios are derived to evaluate the movement in share price over the year of the company and
that whether it is was over-valued or under- valued. It encompasses ratios such as earnings yield, PE
ratio etc. As calculated for Mercury NZ International, an increase in earnings per share and also
dividend per share is being observed over the year majorly due to increase in net profits and share
buy-backs. The yield on earnings supports the above as it also increased during 2018. The PE ratio
for the company calculated on the basis of market price of shares however has declined from 25.21
times in 2017 to 20.15 times in 2018 which can be aligned to earlier over valuation of shares and on
decreased shareholders expectation of growth for the next year.
Further, the comparison of PE ratio for the company with the industry averages clearly
demonstrates over valuation of shares. Thus, it can be concluded as Mercury NZ is still at a higher
growth pace than its competitors and industry peers.
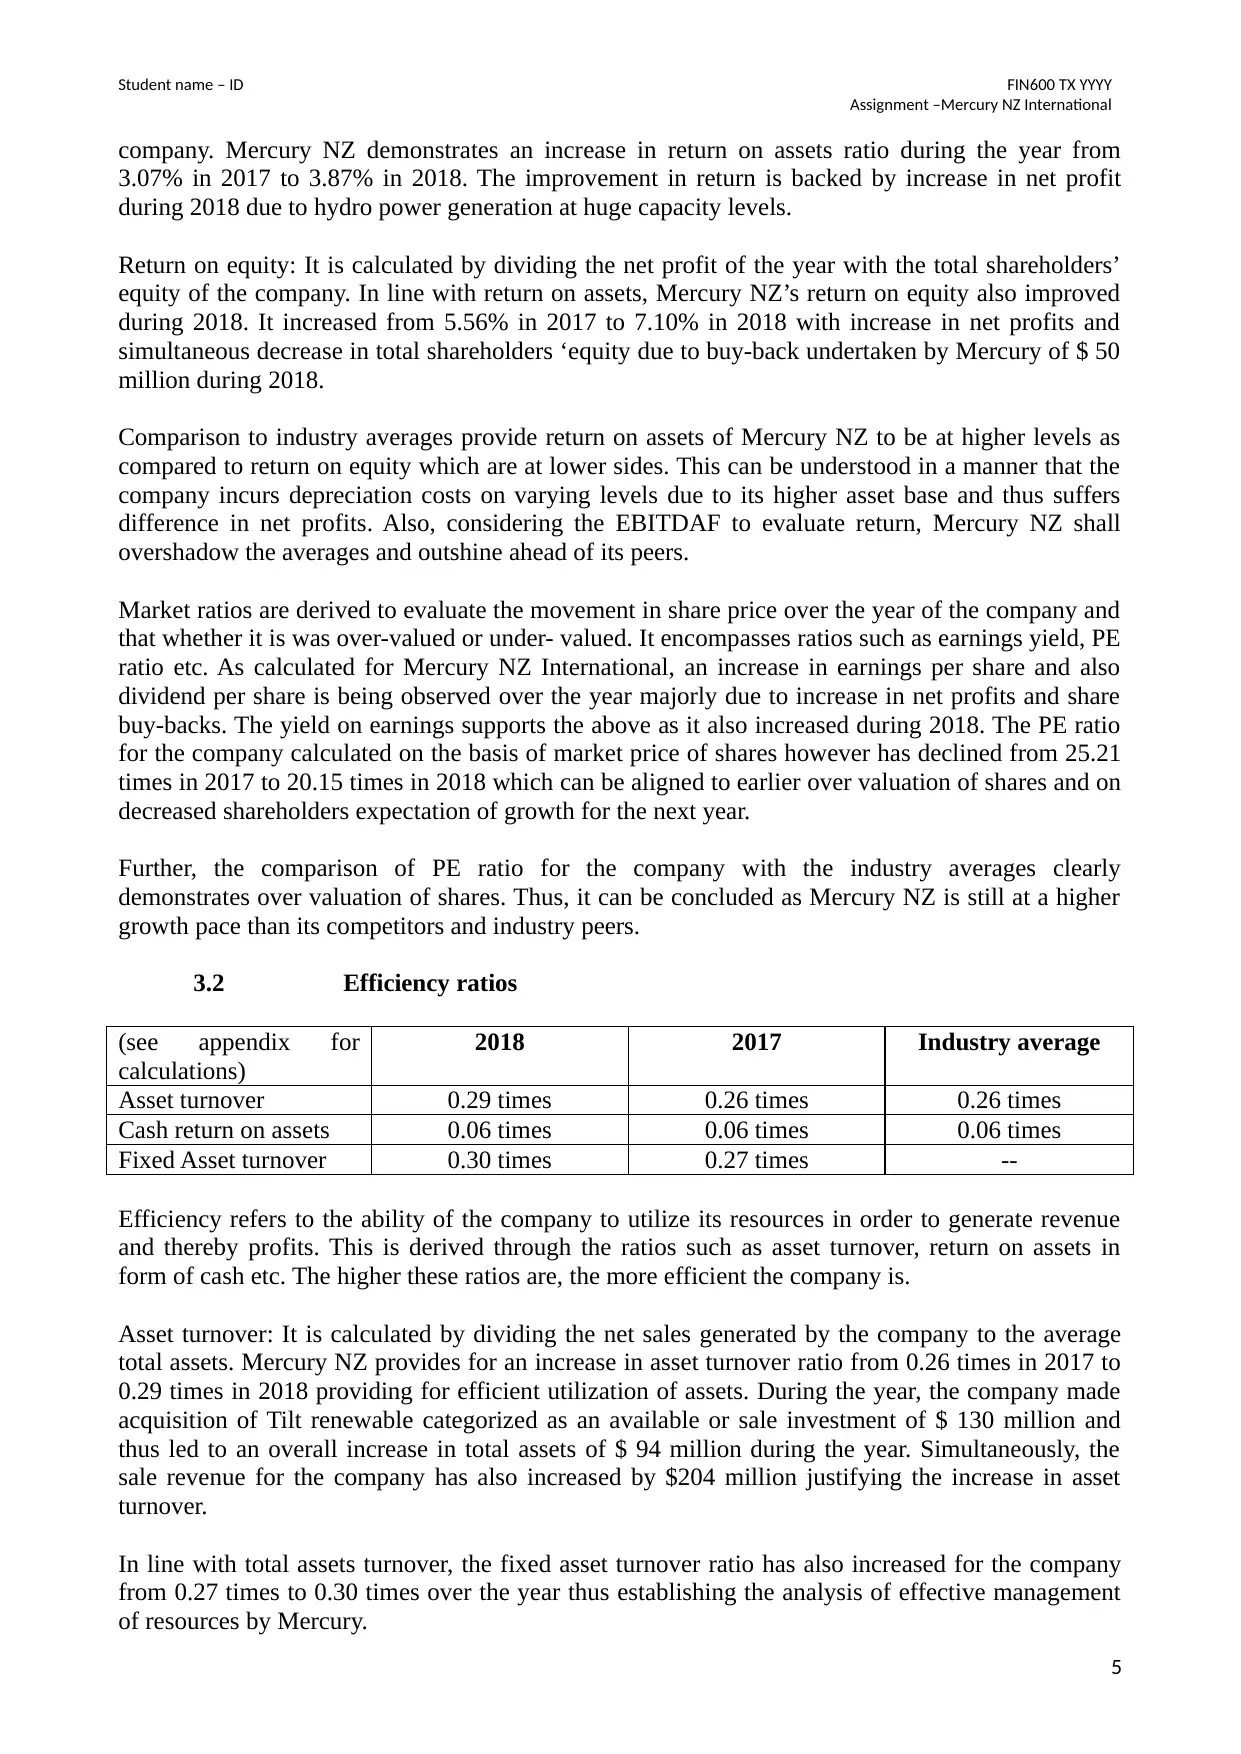
3.2 Efficiency ratios
(see appendix for
calculations)
2018 2017 Industry average
Asset turnover 0.29 times 0.26 times 0.26 times
Cash return on assets 0.06 times 0.06 times 0.06 times
Fixed Asset turnover 0.30 times 0.27 times --
Efficiency refers to the ability of the company to utilize its resources in order to generate revenue
and thereby profits. This is derived through the ratios such as asset turnover, return on assets in
form of cash etc. The higher these ratios are, the more efficient the company is.
Asset turnover: It is calculated by dividing the net sales generated by the company to the average
total assets. Mercury NZ provides for an increase in asset turnover ratio from 0.26 times in 2017 to
0.29 times in 2018 providing for efficient utilization of assets. During the year, the company made
acquisition of Tilt renewable categorized as an available or sale investment of $ 130 million and
thus led to an overall increase in total assets of $ 94 million during the year. Simultaneously, the
sale revenue for the company has also increased by $204 million justifying the increase in asset
turnover.
In line with total assets turnover, the fixed asset turnover ratio has also increased for the company
from 0.27 times to 0.30 times over the year thus establishing the analysis of effective management
of resources by Mercury.
5
Assignment –Mercury NZ International
company. Mercury NZ demonstrates an increase in return on assets ratio during the year from
3.07% in 2017 to 3.87% in 2018. The improvement in return is backed by increase in net profit
during 2018 due to hydro power generation at huge capacity levels.
Return on equity: It is calculated by dividing the net profit of the year with the total shareholders’
equity of the company. In line with return on assets, Mercury NZ’s return on equity also improved
during 2018. It increased from 5.56% in 2017 to 7.10% in 2018 with increase in net profits and
simultaneous decrease in total shareholders ‘equity due to buy-back undertaken by Mercury of $ 50
million during 2018.
Comparison to industry averages provide return on assets of Mercury NZ to be at higher levels as
compared to return on equity which are at lower sides. This can be understood in a manner that the
company incurs depreciation costs on varying levels due to its higher asset base and thus suffers
difference in net profits. Also, considering the EBITDAF to evaluate return, Mercury NZ shall
overshadow the averages and outshine ahead of its peers.
Market ratios are derived to evaluate the movement in share price over the year of the company and
that whether it is was over-valued or under- valued. It encompasses ratios such as earnings yield, PE
ratio etc. As calculated for Mercury NZ International, an increase in earnings per share and also
dividend per share is being observed over the year majorly due to increase in net profits and share
buy-backs. The yield on earnings supports the above as it also increased during 2018. The PE ratio
for the company calculated on the basis of market price of shares however has declined from 25.21
times in 2017 to 20.15 times in 2018 which can be aligned to earlier over valuation of shares and on
decreased shareholders expectation of growth for the next year.
Further, the comparison of PE ratio for the company with the industry averages clearly
demonstrates over valuation of shares. Thus, it can be concluded as Mercury NZ is still at a higher
growth pace than its competitors and industry peers.
3.2 Efficiency ratios
(see appendix for
calculations)
2018 2017 Industry average
Asset turnover 0.29 times 0.26 times 0.26 times
Cash return on assets 0.06 times 0.06 times 0.06 times
Fixed Asset turnover 0.30 times 0.27 times --
Efficiency refers to the ability of the company to utilize its resources in order to generate revenue
and thereby profits. This is derived through the ratios such as asset turnover, return on assets in
form of cash etc. The higher these ratios are, the more efficient the company is.
Asset turnover: It is calculated by dividing the net sales generated by the company to the average
total assets. Mercury NZ provides for an increase in asset turnover ratio from 0.26 times in 2017 to
0.29 times in 2018 providing for efficient utilization of assets. During the year, the company made
acquisition of Tilt renewable categorized as an available or sale investment of $ 130 million and
thus led to an overall increase in total assets of $ 94 million during the year. Simultaneously, the
sale revenue for the company has also increased by $204 million justifying the increase in asset
turnover.
In line with total assets turnover, the fixed asset turnover ratio has also increased for the company
from 0.27 times to 0.30 times over the year thus establishing the analysis of effective management
of resources by Mercury.
5
⊘ This is a preview!⊘
Do you want full access?
Subscribe today to unlock all pages.
Trusted by 1+ million students worldwide
Student name – ID FIN600 TX YYYY
Assignment –Mercury NZ International
The industry average has been lower as compared to Mercury’s asset turnover and thus provides for
better off position for the company.
Cash return on assets: This is a measure of performance derived in relation to industry averages for
any company. It is calculated by dividing the cash flow from operations to the average total assets.
As calculated, the cash return on assets has remained at 6% for the two years under preview and is
in line to the cash returns provided by the industry. The cash flow from operations has remained
constant at about $ 370million due to increased tax payment on account of imputation credits for
dividend which led to constant cash return on assets. Effect of increase on assets has be minimal on
return on assets in form of cash.
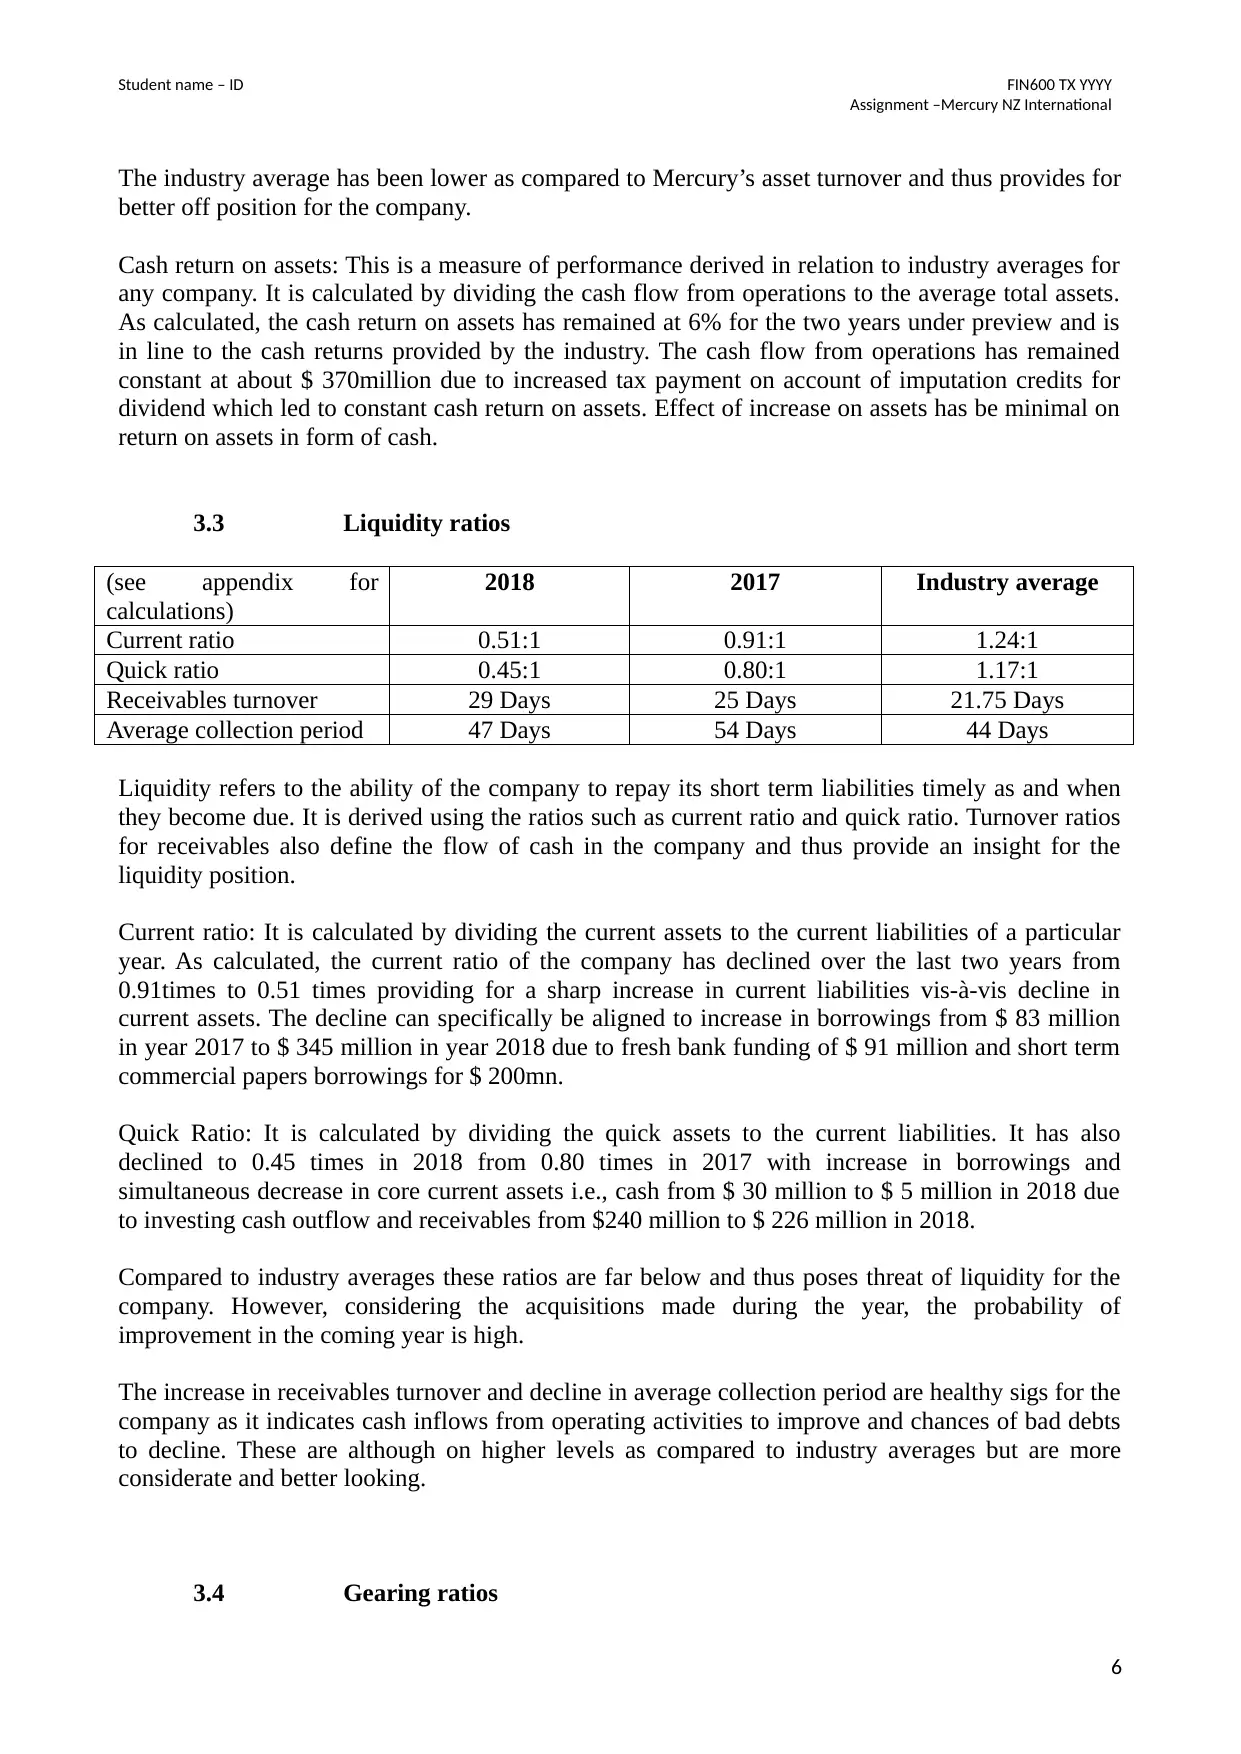
3.3 Liquidity ratios
(see appendix for
calculations)
2018 2017 Industry average
Current ratio 0.51:1 0.91:1 1.24:1
Quick ratio 0.45:1 0.80:1 1.17:1
Receivables turnover 29 Days 25 Days 21.75 Days
Average collection period 47 Days 54 Days 44 Days
Liquidity refers to the ability of the company to repay its short term liabilities timely as and when
they become due. It is derived using the ratios such as current ratio and quick ratio. Turnover ratios
for receivables also define the flow of cash in the company and thus provide an insight for the
liquidity position.
Current ratio: It is calculated by dividing the current assets to the current liabilities of a particular
year. As calculated, the current ratio of the company has declined over the last two years from
0.91times to 0.51 times providing for a sharp increase in current liabilities vis-à-vis decline in
current assets. The decline can specifically be aligned to increase in borrowings from $ 83 million
in year 2017 to $ 345 million in year 2018 due to fresh bank funding of $ 91 million and short term
commercial papers borrowings for $ 200mn.
Quick Ratio: It is calculated by dividing the quick assets to the current liabilities. It has also
declined to 0.45 times in 2018 from 0.80 times in 2017 with increase in borrowings and
simultaneous decrease in core current assets i.e., cash from $ 30 million to $ 5 million in 2018 due
to investing cash outflow and receivables from $240 million to $ 226 million in 2018.
Compared to industry averages these ratios are far below and thus poses threat of liquidity for the
company. However, considering the acquisitions made during the year, the probability of
improvement in the coming year is high.
The increase in receivables turnover and decline in average collection period are healthy sigs for the
company as it indicates cash inflows from operating activities to improve and chances of bad debts
to decline. These are although on higher levels as compared to industry averages but are more
considerate and better looking.
3.4 Gearing ratios
6
Assignment –Mercury NZ International
The industry average has been lower as compared to Mercury’s asset turnover and thus provides for
better off position for the company.
Cash return on assets: This is a measure of performance derived in relation to industry averages for
any company. It is calculated by dividing the cash flow from operations to the average total assets.
As calculated, the cash return on assets has remained at 6% for the two years under preview and is
in line to the cash returns provided by the industry. The cash flow from operations has remained
constant at about $ 370million due to increased tax payment on account of imputation credits for
dividend which led to constant cash return on assets. Effect of increase on assets has be minimal on
return on assets in form of cash.
3.3 Liquidity ratios
(see appendix for
calculations)
2018 2017 Industry average
Current ratio 0.51:1 0.91:1 1.24:1
Quick ratio 0.45:1 0.80:1 1.17:1
Receivables turnover 29 Days 25 Days 21.75 Days
Average collection period 47 Days 54 Days 44 Days
Liquidity refers to the ability of the company to repay its short term liabilities timely as and when
they become due. It is derived using the ratios such as current ratio and quick ratio. Turnover ratios
for receivables also define the flow of cash in the company and thus provide an insight for the
liquidity position.
Current ratio: It is calculated by dividing the current assets to the current liabilities of a particular
year. As calculated, the current ratio of the company has declined over the last two years from
0.91times to 0.51 times providing for a sharp increase in current liabilities vis-à-vis decline in
current assets. The decline can specifically be aligned to increase in borrowings from $ 83 million
in year 2017 to $ 345 million in year 2018 due to fresh bank funding of $ 91 million and short term
commercial papers borrowings for $ 200mn.
Quick Ratio: It is calculated by dividing the quick assets to the current liabilities. It has also
declined to 0.45 times in 2018 from 0.80 times in 2017 with increase in borrowings and
simultaneous decrease in core current assets i.e., cash from $ 30 million to $ 5 million in 2018 due
to investing cash outflow and receivables from $240 million to $ 226 million in 2018.
Compared to industry averages these ratios are far below and thus poses threat of liquidity for the
company. However, considering the acquisitions made during the year, the probability of
improvement in the coming year is high.
The increase in receivables turnover and decline in average collection period are healthy sigs for the
company as it indicates cash inflows from operating activities to improve and chances of bad debts
to decline. These are although on higher levels as compared to industry averages but are more
considerate and better looking.
3.4 Gearing ratios
6
Paraphrase This Document
Need a fresh take? Get an instant paraphrase of this document with our AI Paraphraser
Student name – ID FIN600 TX YYYY
Assignment –Mercury NZ International
(see appendix for
calculations)
2018 2017 Industry average*
Debt to equity ratio 39.71 % 33.46 % 174.78%
Debt ratio 21% 18% --
Equity ratio 54% 55% --
Cash debt coverage 14% 14% --
Interest cover ratio 4.53 times 3.66 times 9.27 Times
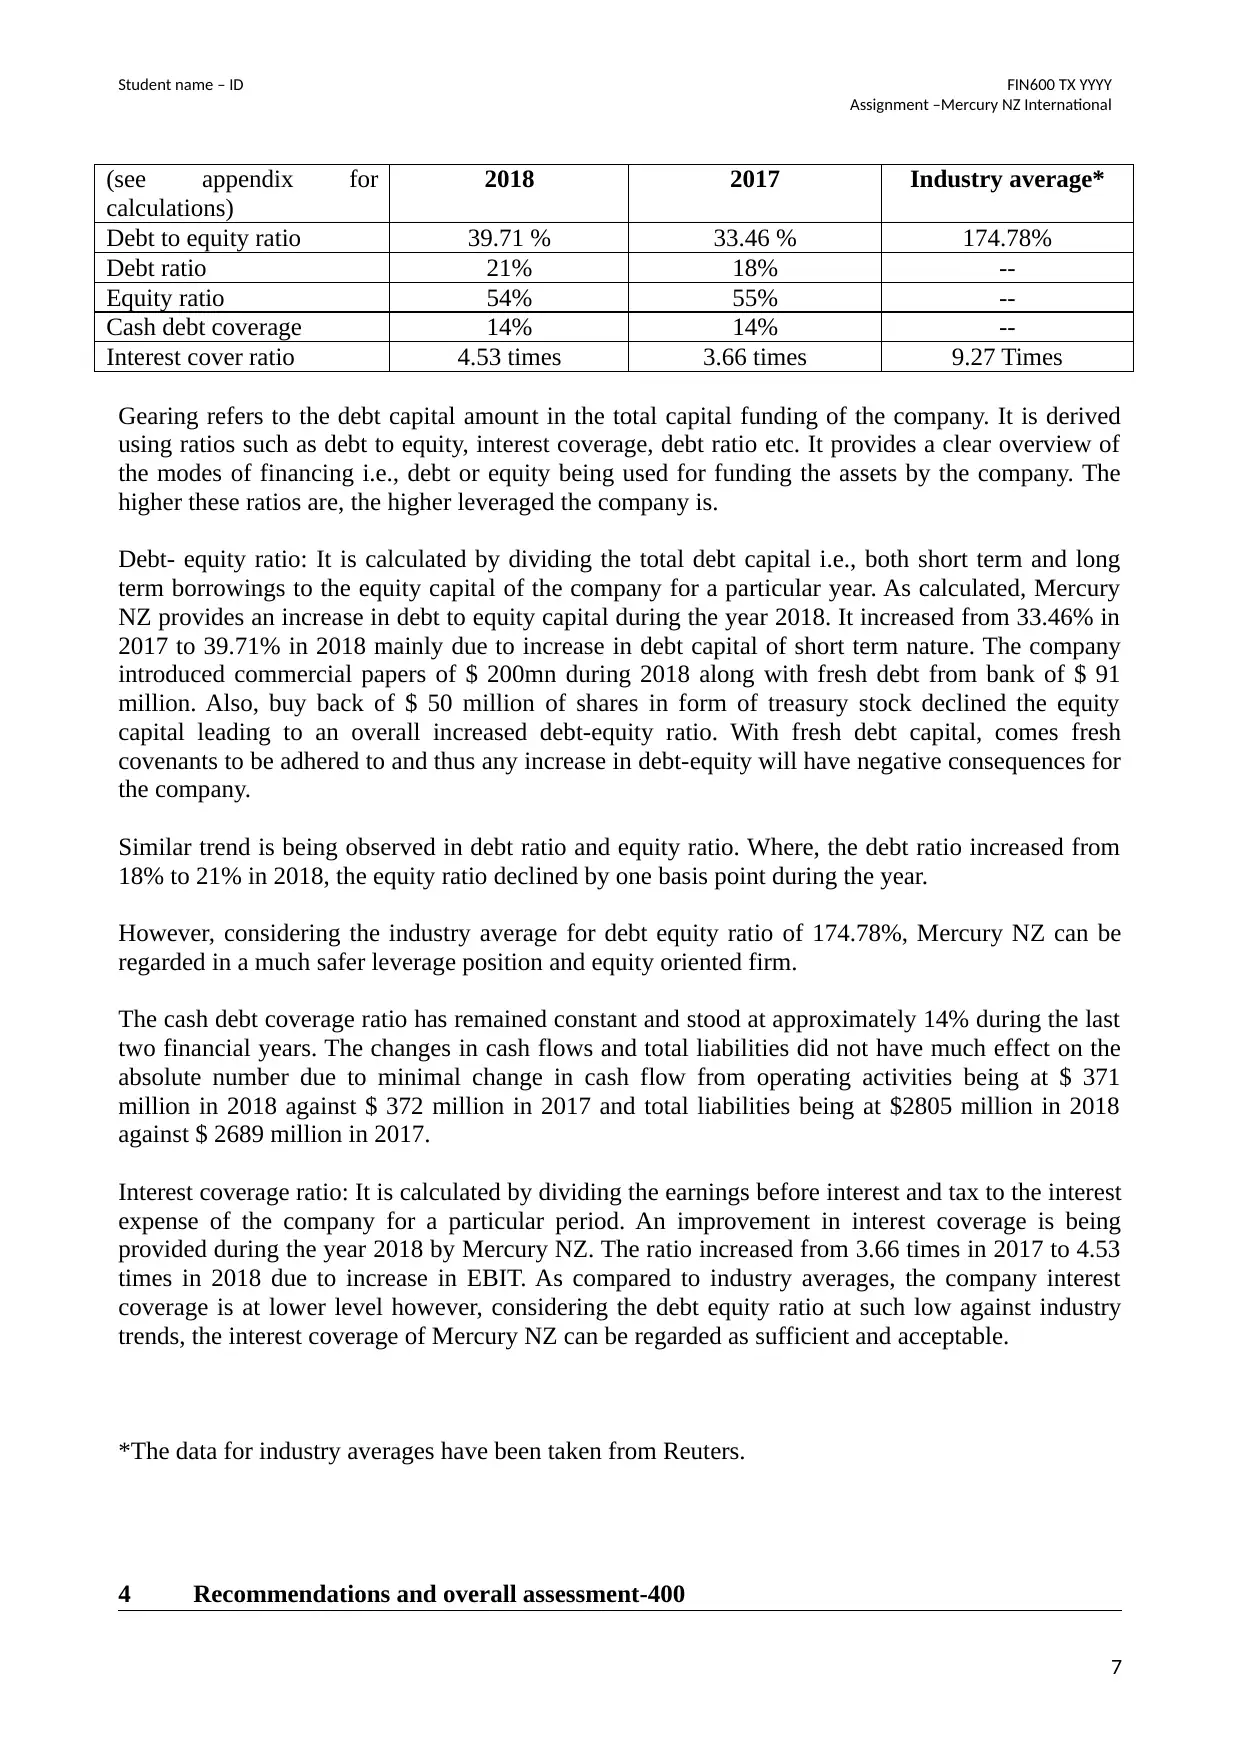
Gearing refers to the debt capital amount in the total capital funding of the company. It is derived
using ratios such as debt to equity, interest coverage, debt ratio etc. It provides a clear overview of
the modes of financing i.e., debt or equity being used for funding the assets by the company. The
higher these ratios are, the higher leveraged the company is.
Debt- equity ratio: It is calculated by dividing the total debt capital i.e., both short term and long
term borrowings to the equity capital of the company for a particular year. As calculated, Mercury
NZ provides an increase in debt to equity capital during the year 2018. It increased from 33.46% in
2017 to 39.71% in 2018 mainly due to increase in debt capital of short term nature. The company
introduced commercial papers of $ 200mn during 2018 along with fresh debt from bank of $ 91
million. Also, buy back of $ 50 million of shares in form of treasury stock declined the equity
capital leading to an overall increased debt-equity ratio. With fresh debt capital, comes fresh
covenants to be adhered to and thus any increase in debt-equity will have negative consequences for
the company.
Similar trend is being observed in debt ratio and equity ratio. Where, the debt ratio increased from
18% to 21% in 2018, the equity ratio declined by one basis point during the year.
However, considering the industry average for debt equity ratio of 174.78%, Mercury NZ can be
regarded in a much safer leverage position and equity oriented firm.
The cash debt coverage ratio has remained constant and stood at approximately 14% during the last
two financial years. The changes in cash flows and total liabilities did not have much effect on the
absolute number due to minimal change in cash flow from operating activities being at $ 371
million in 2018 against $ 372 million in 2017 and total liabilities being at $2805 million in 2018
against $ 2689 million in 2017.
Interest coverage ratio: It is calculated by dividing the earnings before interest and tax to the interest
expense of the company for a particular period. An improvement in interest coverage is being
provided during the year 2018 by Mercury NZ. The ratio increased from 3.66 times in 2017 to 4.53
times in 2018 due to increase in EBIT. As compared to industry averages, the company interest
coverage is at lower level however, considering the debt equity ratio at such low against industry
trends, the interest coverage of Mercury NZ can be regarded as sufficient and acceptable.
*The data for industry averages have been taken from Reuters.
4 Recommendations and overall assessment-400
7
Assignment –Mercury NZ International
(see appendix for
calculations)
2018 2017 Industry average*
Debt to equity ratio 39.71 % 33.46 % 174.78%
Debt ratio 21% 18% --
Equity ratio 54% 55% --
Cash debt coverage 14% 14% --
Interest cover ratio 4.53 times 3.66 times 9.27 Times
Gearing refers to the debt capital amount in the total capital funding of the company. It is derived
using ratios such as debt to equity, interest coverage, debt ratio etc. It provides a clear overview of
the modes of financing i.e., debt or equity being used for funding the assets by the company. The
higher these ratios are, the higher leveraged the company is.
Debt- equity ratio: It is calculated by dividing the total debt capital i.e., both short term and long
term borrowings to the equity capital of the company for a particular year. As calculated, Mercury
NZ provides an increase in debt to equity capital during the year 2018. It increased from 33.46% in
2017 to 39.71% in 2018 mainly due to increase in debt capital of short term nature. The company
introduced commercial papers of $ 200mn during 2018 along with fresh debt from bank of $ 91
million. Also, buy back of $ 50 million of shares in form of treasury stock declined the equity
capital leading to an overall increased debt-equity ratio. With fresh debt capital, comes fresh
covenants to be adhered to and thus any increase in debt-equity will have negative consequences for
the company.
Similar trend is being observed in debt ratio and equity ratio. Where, the debt ratio increased from
18% to 21% in 2018, the equity ratio declined by one basis point during the year.
However, considering the industry average for debt equity ratio of 174.78%, Mercury NZ can be
regarded in a much safer leverage position and equity oriented firm.
The cash debt coverage ratio has remained constant and stood at approximately 14% during the last
two financial years. The changes in cash flows and total liabilities did not have much effect on the
absolute number due to minimal change in cash flow from operating activities being at $ 371
million in 2018 against $ 372 million in 2017 and total liabilities being at $2805 million in 2018
against $ 2689 million in 2017.
Interest coverage ratio: It is calculated by dividing the earnings before interest and tax to the interest
expense of the company for a particular period. An improvement in interest coverage is being
provided during the year 2018 by Mercury NZ. The ratio increased from 3.66 times in 2017 to 4.53
times in 2018 due to increase in EBIT. As compared to industry averages, the company interest
coverage is at lower level however, considering the debt equity ratio at such low against industry
trends, the interest coverage of Mercury NZ can be regarded as sufficient and acceptable.
*The data for industry averages have been taken from Reuters.
4 Recommendations and overall assessment-400
7
Student name – ID FIN600 TX YYYY
Assignment –Mercury NZ International
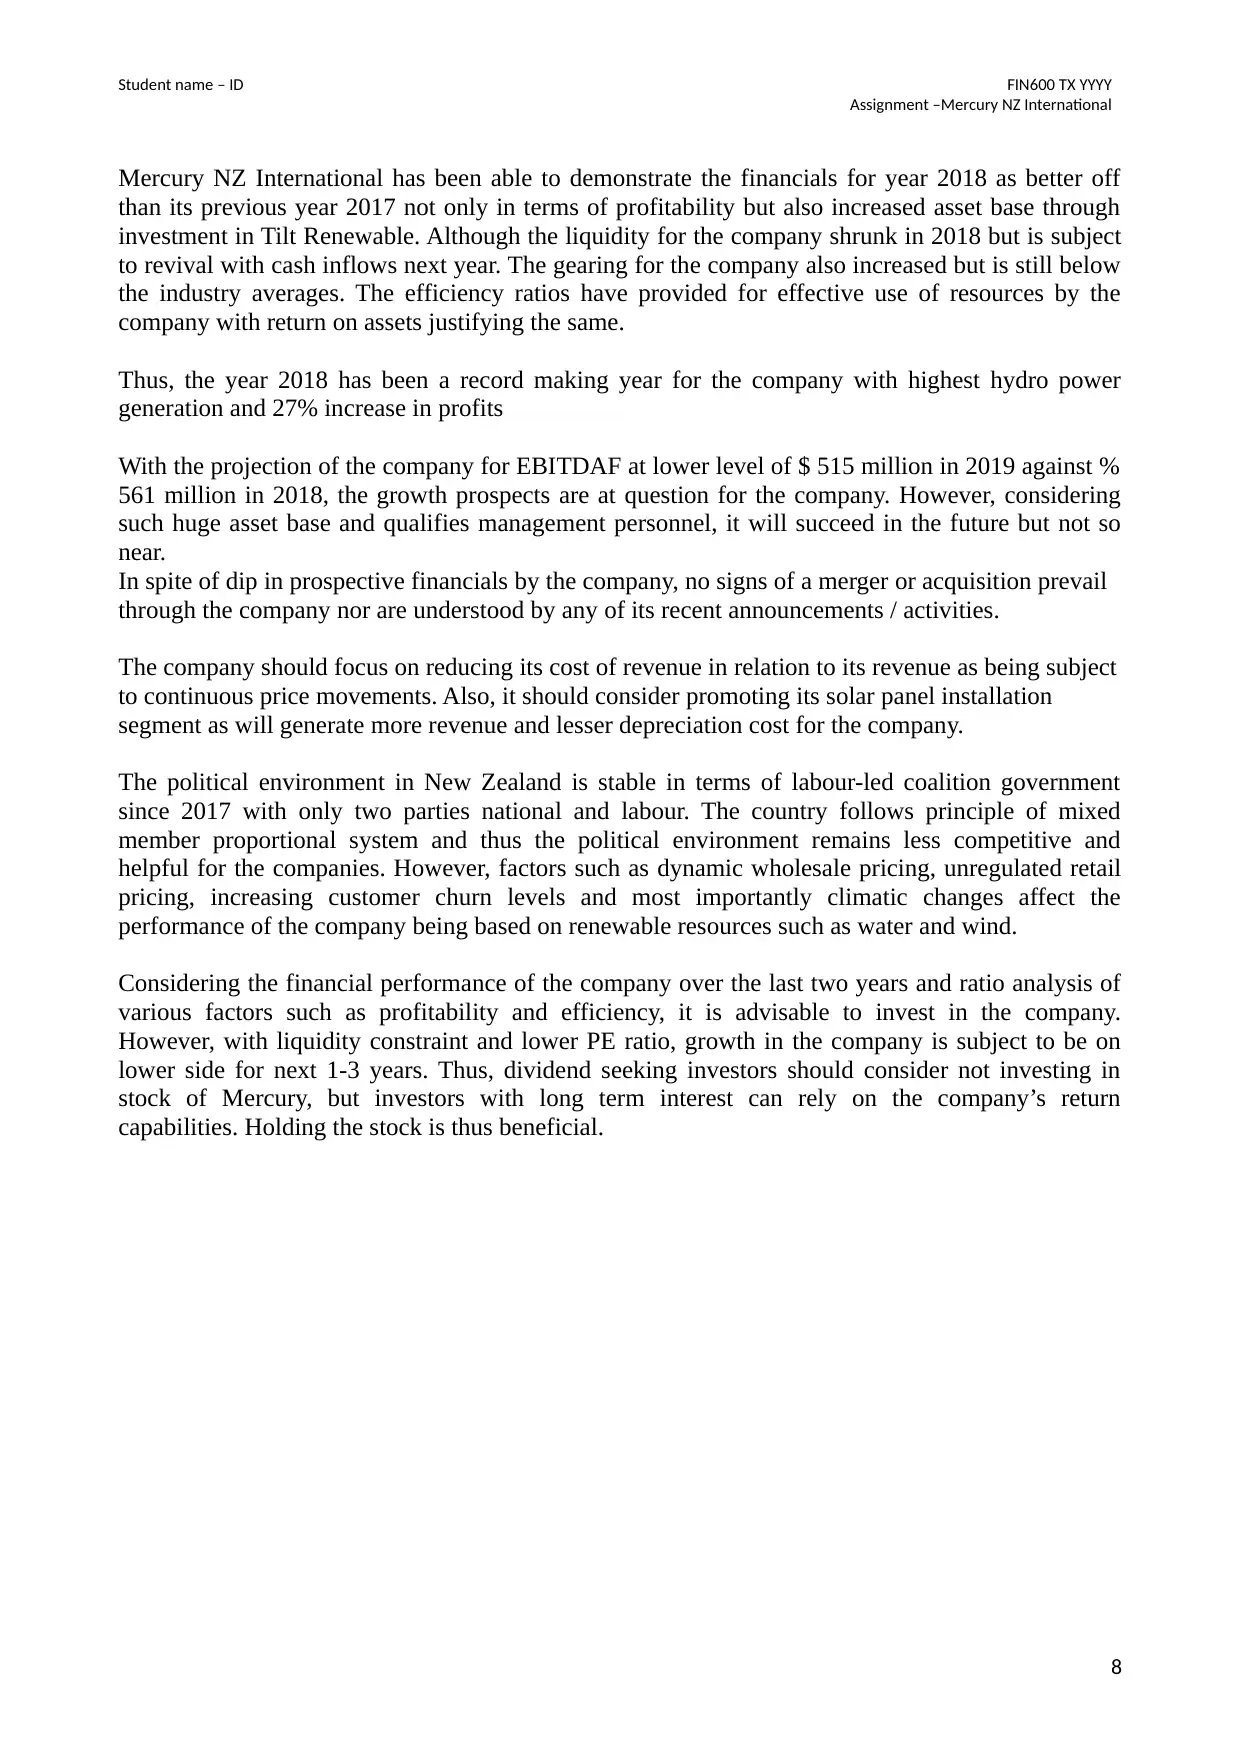
Mercury NZ International has been able to demonstrate the financials for year 2018 as better off
than its previous year 2017 not only in terms of profitability but also increased asset base through
investment in Tilt Renewable. Although the liquidity for the company shrunk in 2018 but is subject
to revival with cash inflows next year. The gearing for the company also increased but is still below
the industry averages. The efficiency ratios have provided for effective use of resources by the
company with return on assets justifying the same.
Thus, the year 2018 has been a record making year for the company with highest hydro power
generation and 27% increase in profits
With the projection of the company for EBITDAF at lower level of $ 515 million in 2019 against %
561 million in 2018, the growth prospects are at question for the company. However, considering
such huge asset base and qualifies management personnel, it will succeed in the future but not so
near.
In spite of dip in prospective financials by the company, no signs of a merger or acquisition prevail
through the company nor are understood by any of its recent announcements / activities.
The company should focus on reducing its cost of revenue in relation to its revenue as being subject
to continuous price movements. Also, it should consider promoting its solar panel installation
segment as will generate more revenue and lesser depreciation cost for the company.
The political environment in New Zealand is stable in terms of labour-led coalition government
since 2017 with only two parties national and labour. The country follows principle of mixed
member proportional system and thus the political environment remains less competitive and
helpful for the companies. However, factors such as dynamic wholesale pricing, unregulated retail
pricing, increasing customer churn levels and most importantly climatic changes affect the
performance of the company being based on renewable resources such as water and wind.
Considering the financial performance of the company over the last two years and ratio analysis of
various factors such as profitability and efficiency, it is advisable to invest in the company.
However, with liquidity constraint and lower PE ratio, growth in the company is subject to be on
lower side for next 1-3 years. Thus, dividend seeking investors should consider not investing in
stock of Mercury, but investors with long term interest can rely on the company’s return
capabilities. Holding the stock is thus beneficial.
8
Assignment –Mercury NZ International
Mercury NZ International has been able to demonstrate the financials for year 2018 as better off
than its previous year 2017 not only in terms of profitability but also increased asset base through
investment in Tilt Renewable. Although the liquidity for the company shrunk in 2018 but is subject
to revival with cash inflows next year. The gearing for the company also increased but is still below
the industry averages. The efficiency ratios have provided for effective use of resources by the
company with return on assets justifying the same.
Thus, the year 2018 has been a record making year for the company with highest hydro power
generation and 27% increase in profits
With the projection of the company for EBITDAF at lower level of $ 515 million in 2019 against %
561 million in 2018, the growth prospects are at question for the company. However, considering
such huge asset base and qualifies management personnel, it will succeed in the future but not so
near.
In spite of dip in prospective financials by the company, no signs of a merger or acquisition prevail
through the company nor are understood by any of its recent announcements / activities.
The company should focus on reducing its cost of revenue in relation to its revenue as being subject
to continuous price movements. Also, it should consider promoting its solar panel installation
segment as will generate more revenue and lesser depreciation cost for the company.
The political environment in New Zealand is stable in terms of labour-led coalition government
since 2017 with only two parties national and labour. The country follows principle of mixed
member proportional system and thus the political environment remains less competitive and
helpful for the companies. However, factors such as dynamic wholesale pricing, unregulated retail
pricing, increasing customer churn levels and most importantly climatic changes affect the
performance of the company being based on renewable resources such as water and wind.
Considering the financial performance of the company over the last two years and ratio analysis of
various factors such as profitability and efficiency, it is advisable to invest in the company.
However, with liquidity constraint and lower PE ratio, growth in the company is subject to be on
lower side for next 1-3 years. Thus, dividend seeking investors should consider not investing in
stock of Mercury, but investors with long term interest can rely on the company’s return
capabilities. Holding the stock is thus beneficial.
8
⊘ This is a preview!⊘
Do you want full access?
Subscribe today to unlock all pages.
Trusted by 1+ million students worldwide
Student name – ID FIN600 TX YYYY
Assignment –Mercury NZ International
5 References/Bibliography
1. MercuryNZ. (2018, August 21). Mercury Website- Annual report 2018. Retrieved November 27,
2018, from https://www.mercury.co.nz/Investors/Results-Reports/Annual-interim-reports.aspx
2. Morningstar. (2018, November 27). MCY Mercury NZ Ltd Stock Quote Price | Morningstar.
Retrieved November 27, 2018, from https://www.morningstar.com/stocks/XNZE/MCY/quote.html
3. Reuters. (2018). Mercury NZ Ltd (MCY.NZ) Financials. Retrieved November 27, 2018, from
https://www.reuters.com/finance/stocks/financial-highlights/MCY.NZ
4. NZ Government. (2018, June 29). Industry Averages. Retrieved November 27, 2018, from
https://www.stats.govt.nz/experimental/business-performance-benchmarker
5. NZ Government. (2017). Indicators and snapshots- Social and Political. Retrieved November 27,
2018, from https://www.stats.govt.nz/indicators-and-snapshots/
6. Bragg, S. (2018, February 14). Cash return on assets. Retrieved November 27, 2018, from
https://www.accountingtools.com/articles/cash-return-on-assets.html
7. MercuryNZ. (2018, November 19). Mercury- Investor Road show. Retrieved November 27,
2018, from https://www.mercury.co.nz/Investors/Results-Reports/Presentations.aspx
8. Pelletier, N. (2018, August 21). Mercury's net profit rises 27 percent on record hydro generation.
Retrieved November 27, 2018, from https://www.radionz.co.nz/news/business/364584/mercury-s-
net-profit-rises-27-percent-on-record-hydro-generation
9
Paraphrase This Document
Need a fresh take? Get an instant paraphrase of this document with our AI Paraphraser
Student name – ID FIN600 TX YYYY
Assignment –Mercury NZ International
Appendices – attached Excel Spreadsheet
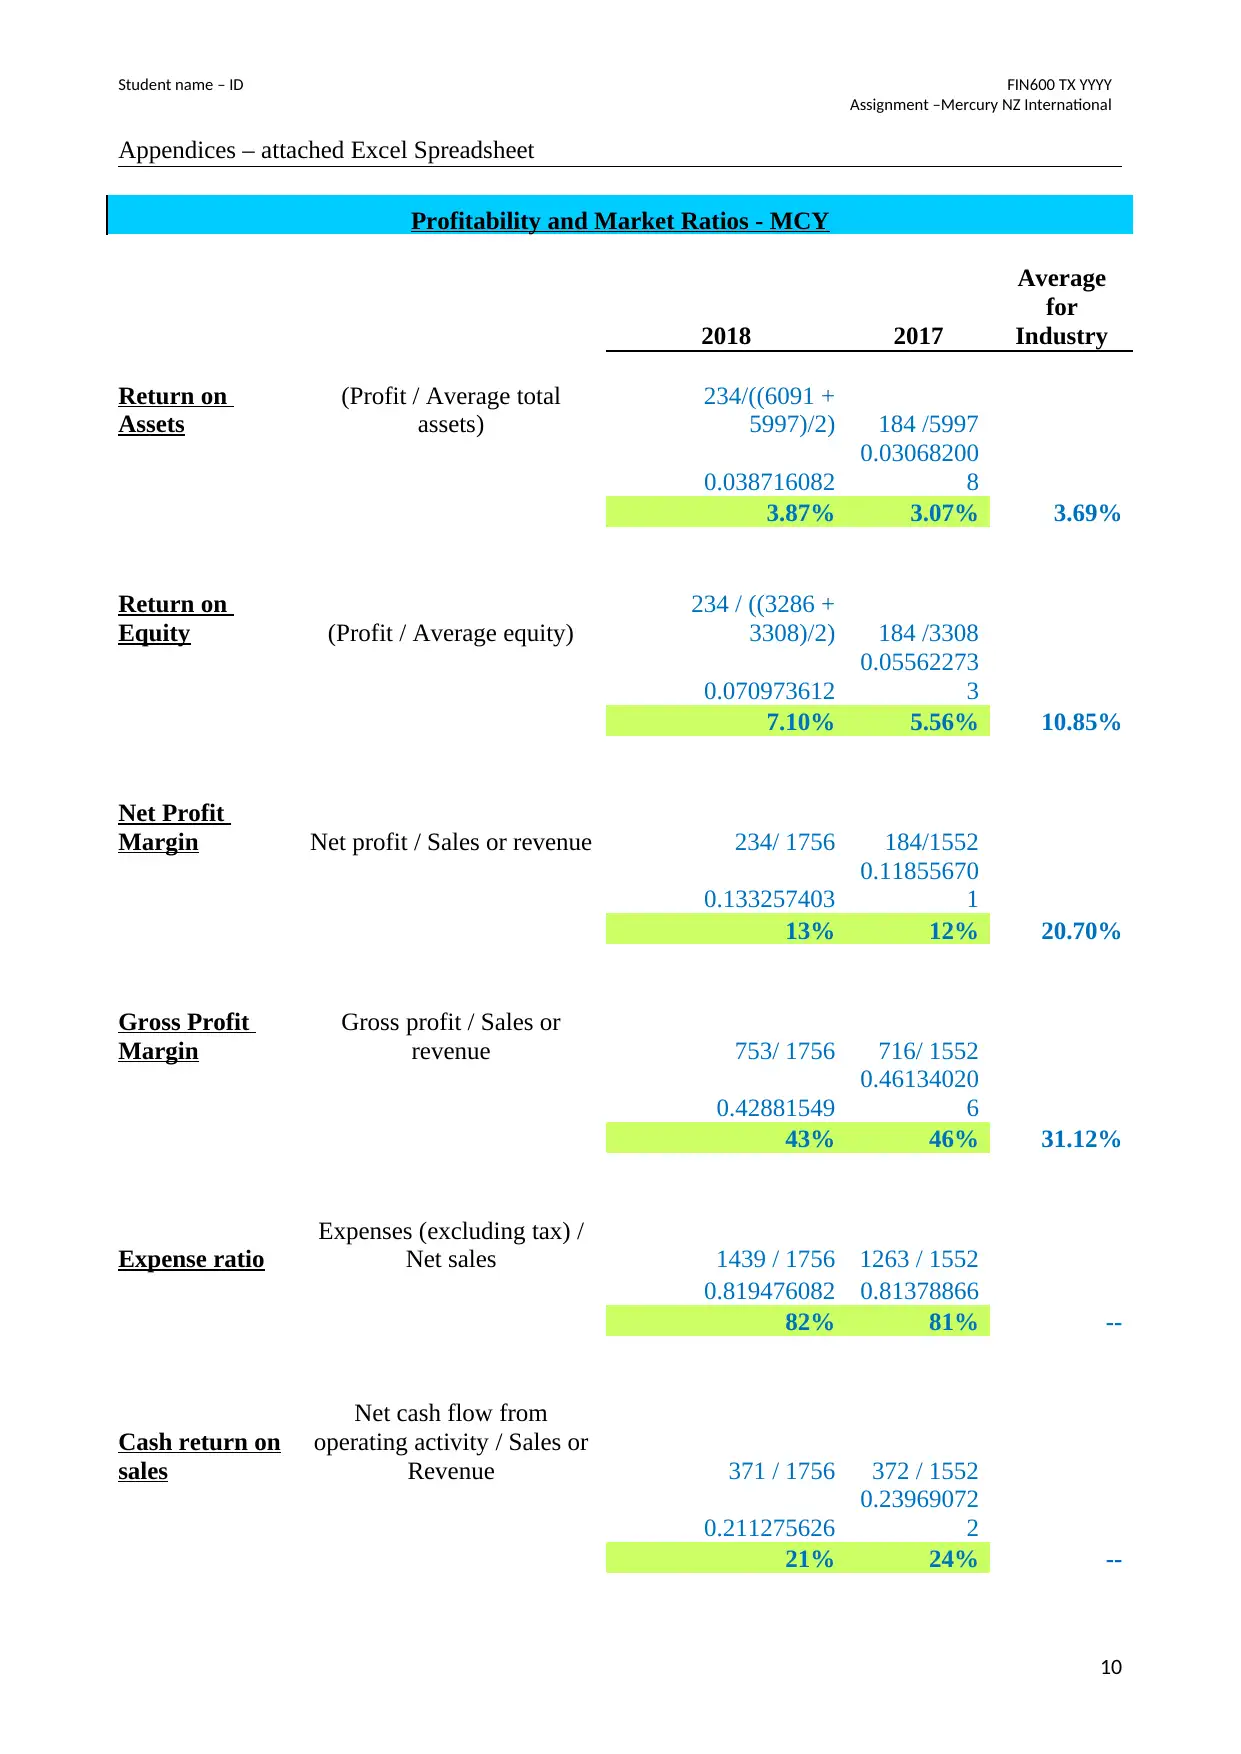
Profitability and Market Ratios - MCY
2018 2017
Average
for
Industry
Return on
Assets
(Profit / Average total
assets)
234/((6091 +
5997)/2) 184 /5997
0.038716082
0.03068200
8
3.87% 3.07% 3.69%
Return on
Equity (Profit / Average equity)
234 / ((3286 +
3308)/2) 184 /3308
0.070973612
0.05562273
3
7.10% 5.56% 10.85%
Net Profit
Margin Net profit / Sales or revenue 234/ 1756 184/1552
0.133257403
0.11855670
1
13% 12% 20.70%
Gross Profit
Margin
Gross profit / Sales or
revenue 753/ 1756 716/ 1552
0.42881549
0.46134020
6
43% 46% 31.12%
Expense ratio
Expenses (excluding tax) /
Net sales 1439 / 1756 1263 / 1552
0.819476082 0.81378866
82% 81% --
Cash return on
sales
Net cash flow from
operating activity / Sales or
Revenue 371 / 1756 372 / 1552
0.211275626
0.23969072
2
21% 24% --
10
Assignment –Mercury NZ International
Appendices – attached Excel Spreadsheet
Profitability and Market Ratios - MCY
2018 2017
Average
for
Industry
Return on
Assets
(Profit / Average total
assets)
234/((6091 +
5997)/2) 184 /5997
0.038716082
0.03068200
8
3.87% 3.07% 3.69%
Return on
Equity (Profit / Average equity)
234 / ((3286 +
3308)/2) 184 /3308
0.070973612
0.05562273
3
7.10% 5.56% 10.85%
Net Profit
Margin Net profit / Sales or revenue 234/ 1756 184/1552
0.133257403
0.11855670
1
13% 12% 20.70%
Gross Profit
Margin
Gross profit / Sales or
revenue 753/ 1756 716/ 1552
0.42881549
0.46134020
6
43% 46% 31.12%
Expense ratio
Expenses (excluding tax) /
Net sales 1439 / 1756 1263 / 1552
0.819476082 0.81378866
82% 81% --
Cash return on
sales
Net cash flow from
operating activity / Sales or
Revenue 371 / 1756 372 / 1552
0.211275626
0.23969072
2
21% 24% --
10
Student name – ID FIN600 TX YYYY
Assignment –Mercury NZ International
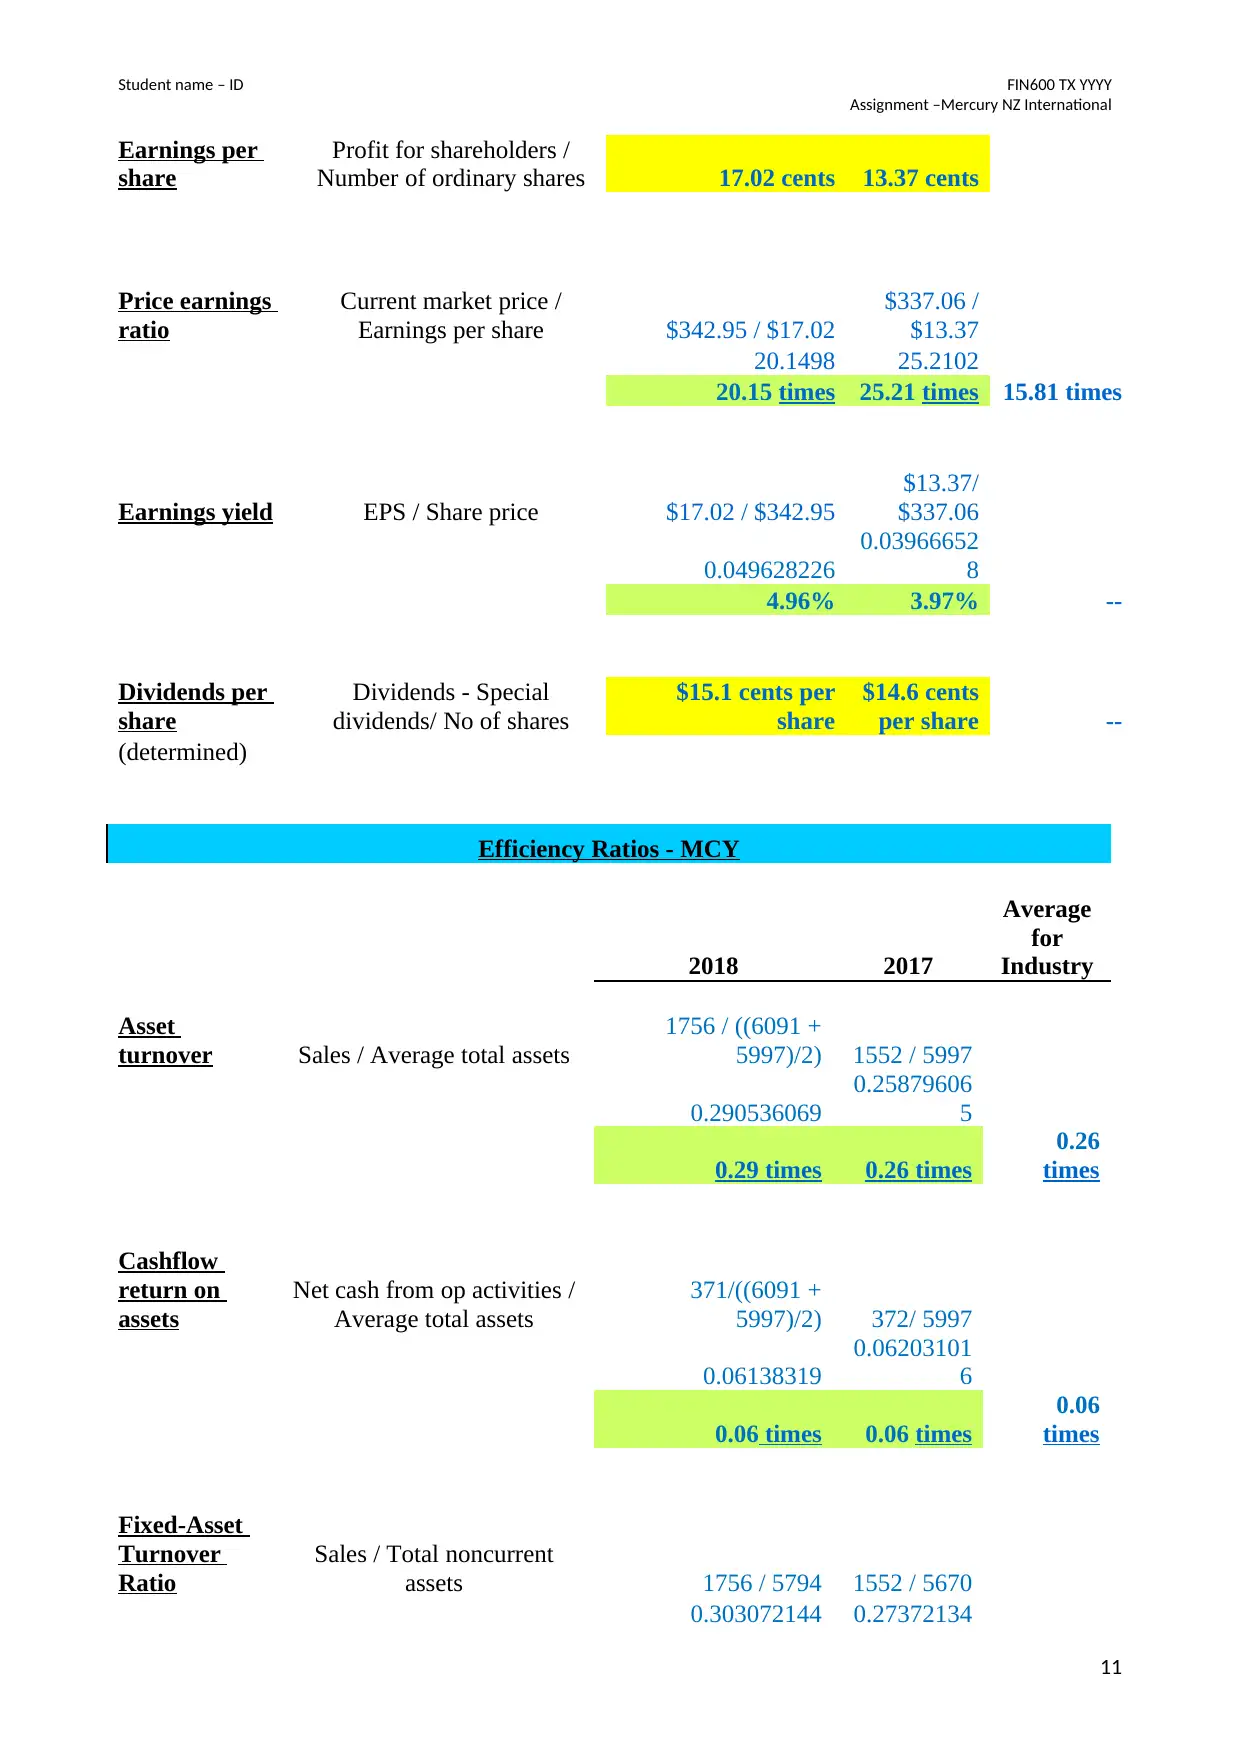
Earnings per
share
Profit for shareholders /
Number of ordinary shares 17.02 cents 13.37 cents
Price earnings
ratio
Current market price /
Earnings per share $342.95 / $17.02
$337.06 /
$13.37
20.1498 25.2102
20.15 times 25.21 times 15.81 times
Earnings yield EPS / Share price $17.02 / $342.95
$13.37/
$337.06
0.049628226
0.03966652
8
4.96% 3.97% --
Dividends per
share
Dividends - Special
dividends/ No of shares
$15.1 cents per
share
$14.6 cents
per share --
(determined)
Efficiency Ratios - MCY
2018 2017
Average
for
Industry
Asset
turnover Sales / Average total assets
1756 / ((6091 +
5997)/2) 1552 / 5997
0.290536069
0.25879606
5
0.29 times 0.26 times
0.26
times
Cashflow
return on
assets
Net cash from op activities /
Average total assets
371/((6091 +
5997)/2) 372/ 5997
0.06138319
0.06203101
6
0.06 times 0.06 times
0.06
times
Fixed-Asset
Turnover
Ratio
Sales / Total noncurrent
assets 1756 / 5794 1552 / 5670
0.303072144 0.27372134
11
Assignment –Mercury NZ International
Earnings per
share
Profit for shareholders /
Number of ordinary shares 17.02 cents 13.37 cents
Price earnings
ratio
Current market price /
Earnings per share $342.95 / $17.02
$337.06 /
$13.37
20.1498 25.2102
20.15 times 25.21 times 15.81 times
Earnings yield EPS / Share price $17.02 / $342.95
$13.37/
$337.06
0.049628226
0.03966652
8
4.96% 3.97% --
Dividends per
share
Dividends - Special
dividends/ No of shares
$15.1 cents per
share
$14.6 cents
per share --
(determined)
Efficiency Ratios - MCY
2018 2017
Average
for
Industry
Asset
turnover Sales / Average total assets
1756 / ((6091 +
5997)/2) 1552 / 5997
0.290536069
0.25879606
5
0.29 times 0.26 times
0.26
times
Cashflow
return on
assets
Net cash from op activities /
Average total assets
371/((6091 +
5997)/2) 372/ 5997
0.06138319
0.06203101
6
0.06 times 0.06 times
0.06
times
Fixed-Asset
Turnover
Ratio
Sales / Total noncurrent
assets 1756 / 5794 1552 / 5670
0.303072144 0.27372134
11
⊘ This is a preview!⊘
Do you want full access?
Subscribe today to unlock all pages.
Trusted by 1+ million students worldwide
1 out of 14
Related Documents


Your All-in-One AI-Powered Toolkit for Academic Success.
+13062052269
info@desklib.com
Available 24*7 on WhatsApp / Email
![[object Object]](/_next/static/media/star-bottom.7253800d.svg)
Unlock your academic potential
Copyright © 2020–2026 A2Z Services. All Rights Reserved. Developed and managed by ZUCOL.