Excelsia College IBRM 12: Data Analysis of Leadership Styles
VerifiedAdded on 2022/10/19
|21
|3518
|284
Report
AI Summary
This report presents an analysis of the impact of leadership styles on employee performance, focusing on a case study of Woolworths Limited. It details the data analysis design, including data preparation steps such as validation, editing, and coding. The report emphasizes the use of quantitative data analysis methods, particularly descriptive statistics like mean, median, mode, percentage, frequency, and range, and their application in summarizing data. The report also covers the use of tabulation and frequency tables to present survey responses related to different leadership styles (democratic, autocratic, and laissez-faire) and their perceived impact on employee performance. Furthermore, the report references the use of software such as Excel and SPSS for data analysis, and addresses problems such as median split and calculation of rank order. The assignment includes a discussion of how to interpret the results of the data analysis and the importance of data transformations.
Running head: IBRM
Assessment 4: Methods of Analysis of Data
Research title: An analysis of the impact of leadership style on employee’s
performance: A case study of Woolworths limited'
Assessment 4: Methods of Analysis of Data
Research title: An analysis of the impact of leadership style on employee’s
performance: A case study of Woolworths limited'
Paraphrase This Document
Need a fresh take? Get an instant paraphrase of this document with our AI Paraphraser
IBRM 2
Table of Contents
Data analysis design....................................................................................................................................3
Step 1: Data Validation............................................................................................................................3
Step 2: Data Editing.................................................................................................................................3
Step 3: Data Coding.................................................................................................................................4
Quantitative Data Analysis Method.............................................................................................................5
Descriptive Statistics...............................................................................................................................5
References.................................................................................................................................................20
IBRM 3
Data analysis design
Data Preparation
The initial phase for assessing data is the preparation of data in which, aim is to transform the
raw information into something readable as well as, meaningful. Followings are some phases for
assessing quantitative data:
Step 1: Data Validation
In this research study, initially, researcher would validate the data. Main aim of data validation is
to address whether data collection would be performed according to pre-set standards without
any partiality. Researcher would focus on given factors during data validation:
Fraud can be supposed with respect to whether each participant would be really
interrogated or not
Screening and ensuring that participants would be selected according to criteria of
investigation
The process is properly followed to assess whether data gathering would be considered
(Laitinen & Senoo, 2019).
An investigator would make sure that all questions would be asked with participants as compared
to few required ones. For completing this, an investigator would require to pick a random sample
for completing a survey as well as, validating the gathered information. This could be time
taking for surveys due to number of responses. For instance, survey would be conducted on 50
participants of Woolworths. Subsequently, an investigator would reach out via email and check
their responds on specific set of questions (Schaffner, et. al., 2015).
Step 2: Data Editing
⊘ This is a preview!⊘
Do you want full access?
Subscribe today to unlock all pages.
Trusted by 1+ million students worldwide
IBRM 4
In this step, researcher would create larger data sets because there is chances for occurring errors.
For illustration, respondents could fill fields inappropriately and skip them unintentionally. In
order to ensure that there would be no such error; an investigator would conduct basic
assessment of information, ensuring outliers, editing raw research information for addressing as
well as, clear out any point of information, which may hinder accurateness of outcomes (Stein,
et. al., 2017). For instance, an error can be in a field that would leave empty through participants.
When editing data, researcher would remove and fill all vacant fields. In addition, researcher
would focus on developing an organising as well as, compressed manner in terms of arranging
information via charts, text, and diagrams. This display would be supportive in order to
identifying themes, structures as well as, connections that support answering the evaluation
questions (Farmer, 2017). In this phase, researcher would focus on coding in which, they mark
passages of text that have the same message as well as, are linked in some manner. A researcher
will also write associated elucidation regarding what the selected passages have in common
(Render & Stair Jr, 2016).
Step 3: Data Coding
This is significant phase in preparation of data. In this phase, researcher will assign as well as,
creating set of values in responses within survey. For example, after selecting 50 individuals for
survey, researcher would address the number of participants through their average groups that is
shown as above table. An investigator would also develop age buckets as well as, categorizes age
of each of participants according to these codes. For illustration, participants among 25-30 years
were 60.00% and 31-40-years age of people were 20.00%.
In this phase, researcher would choose, emphasize, summarise as well as, transform data. The
procedure would be instructed through thinking regarding which information provides the best
Paraphrase This Document
Need a fresh take? Get an instant paraphrase of this document with our AI Paraphraser
IBRM 5
answer to evaluation questions. The procedure of transforming information would be related to
performing data analysis and identifying research objectives (Tricco, et. al., 2016).
Problems with Data Transformations
Median Split
A researcher would divide data set into two categories through placing participants below
median in one group as well as, participants above median in another. The strategy is best
implemented when data do certainly exhibition bimodal features. Infeasible collapsing of
constant variables and categorical variables avoids data within untransformed value (Turker,
Dunn, &Wilkie, 2017).
Calculating Rank Order
Ranking data would be summarized by performing a transformation of data. The transformation
would entail multiplying frequency by ranking score to each selection at the new scale.
Computer Programs for Analysis
In this investigation, spreadsheets could be used through Excel software. But, statistical software
i.e. SPSS (Statistical Package for Social Sciences) could be applied by a researcher to develop
better understanding regarding research issues.
Quantitative Data Analysis Method
Descriptive Statistics
The elementary change related to raw data in a manner defines the basic features like variability,
central tendency, and distribution. It is supportive for the investigator to summarise information
and address patterns. The given below are practiced for descriptive statistics:
Mean: Numerical average regarding the set of data
Median: Midpoint related to set of numerical amount
IBRM 6
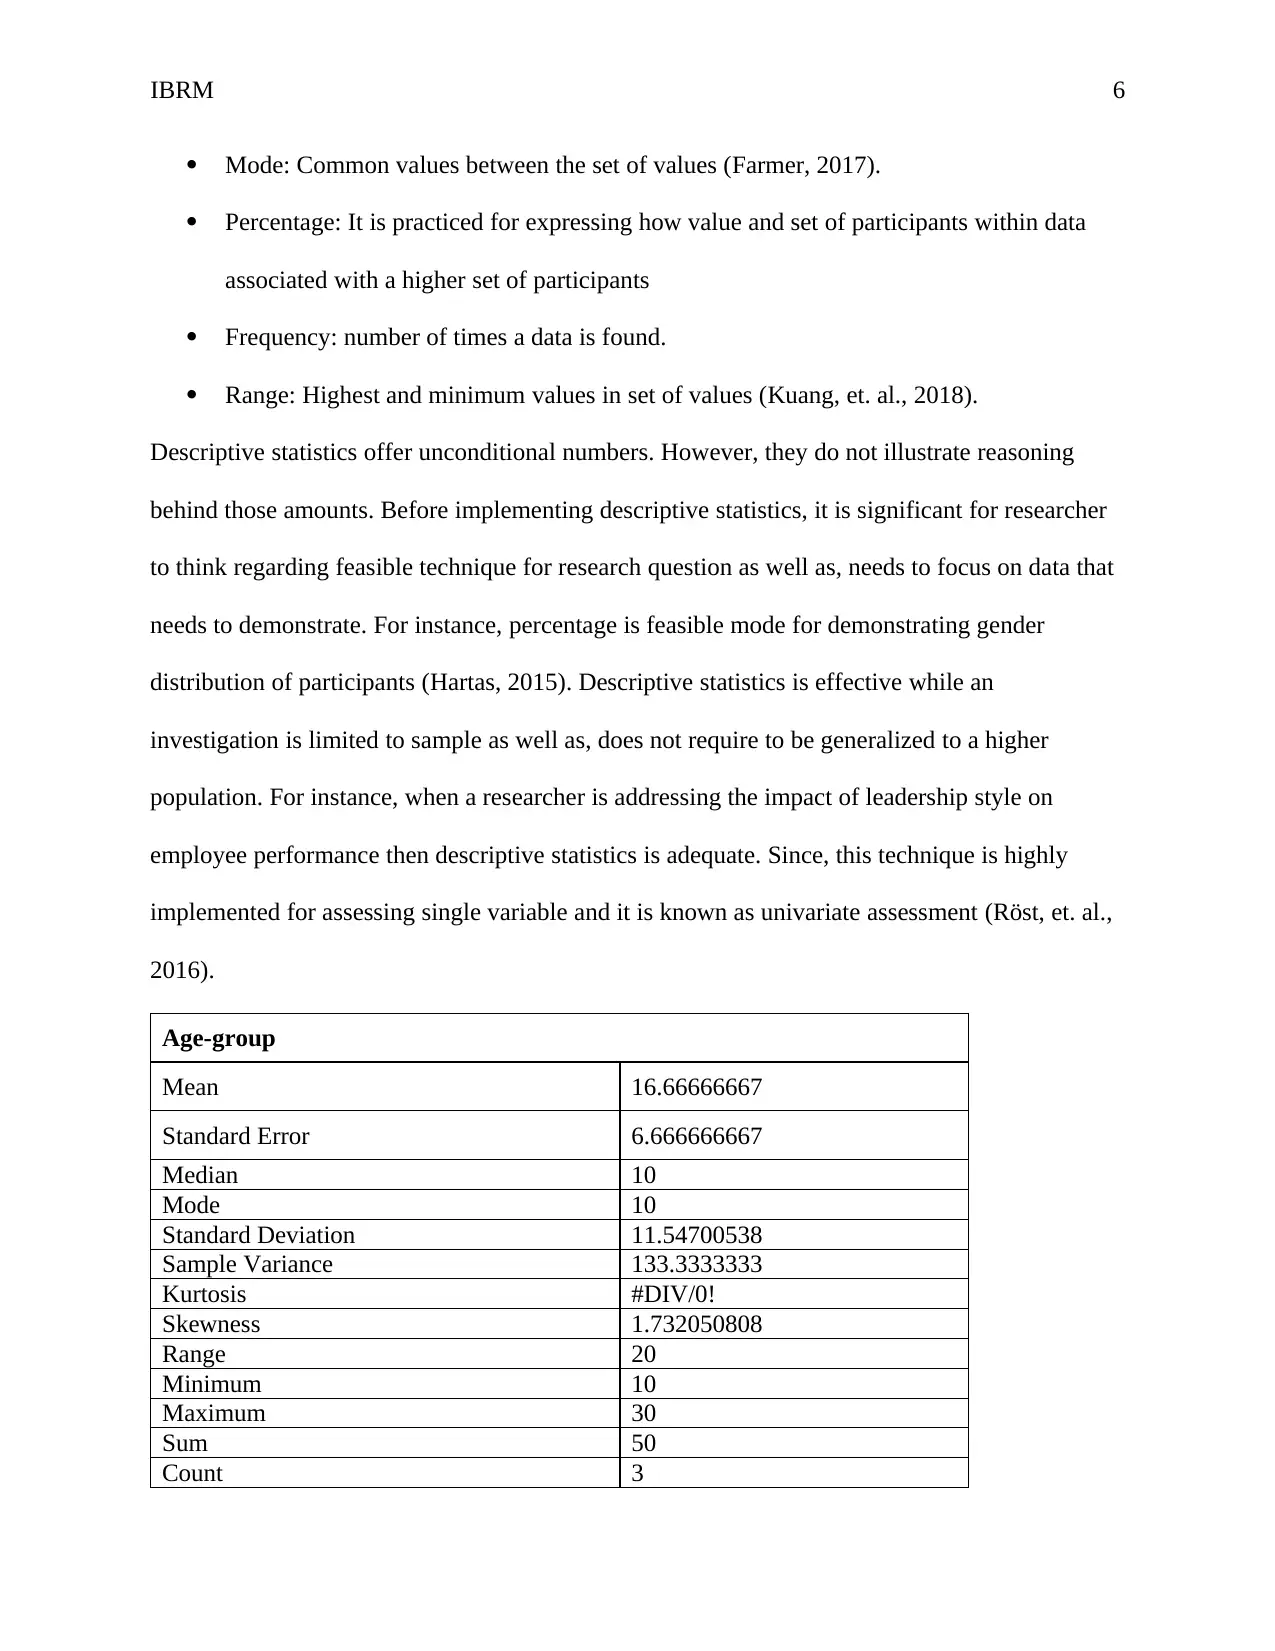
Mode: Common values between the set of values (Farmer, 2017).
Percentage: It is practiced for expressing how value and set of participants within data
associated with a higher set of participants
Frequency: number of times a data is found.
Range: Highest and minimum values in set of values (Kuang, et. al., 2018).
Descriptive statistics offer unconditional numbers. However, they do not illustrate reasoning
behind those amounts. Before implementing descriptive statistics, it is significant for researcher
to think regarding feasible technique for research question as well as, needs to focus on data that
needs to demonstrate. For instance, percentage is feasible mode for demonstrating gender
distribution of participants (Hartas, 2015). Descriptive statistics is effective while an
investigation is limited to sample as well as, does not require to be generalized to a higher
population. For instance, when a researcher is addressing the impact of leadership style on
employee performance then descriptive statistics is adequate. Since, this technique is highly
implemented for assessing single variable and it is known as univariate assessment (Röst, et. al.,
2016).
Age-group
Mean 16.66666667
Standard Error 6.666666667
Median 10
Mode 10
Standard Deviation 11.54700538
Sample Variance 133.3333333
Kurtosis #DIV/0!
Skewness 1.732050808
Range 20
Minimum 10
Maximum 30
Sum 50
Count 3
⊘ This is a preview!⊘
Do you want full access?
Subscribe today to unlock all pages.
Trusted by 1+ million students worldwide
IBRM 7
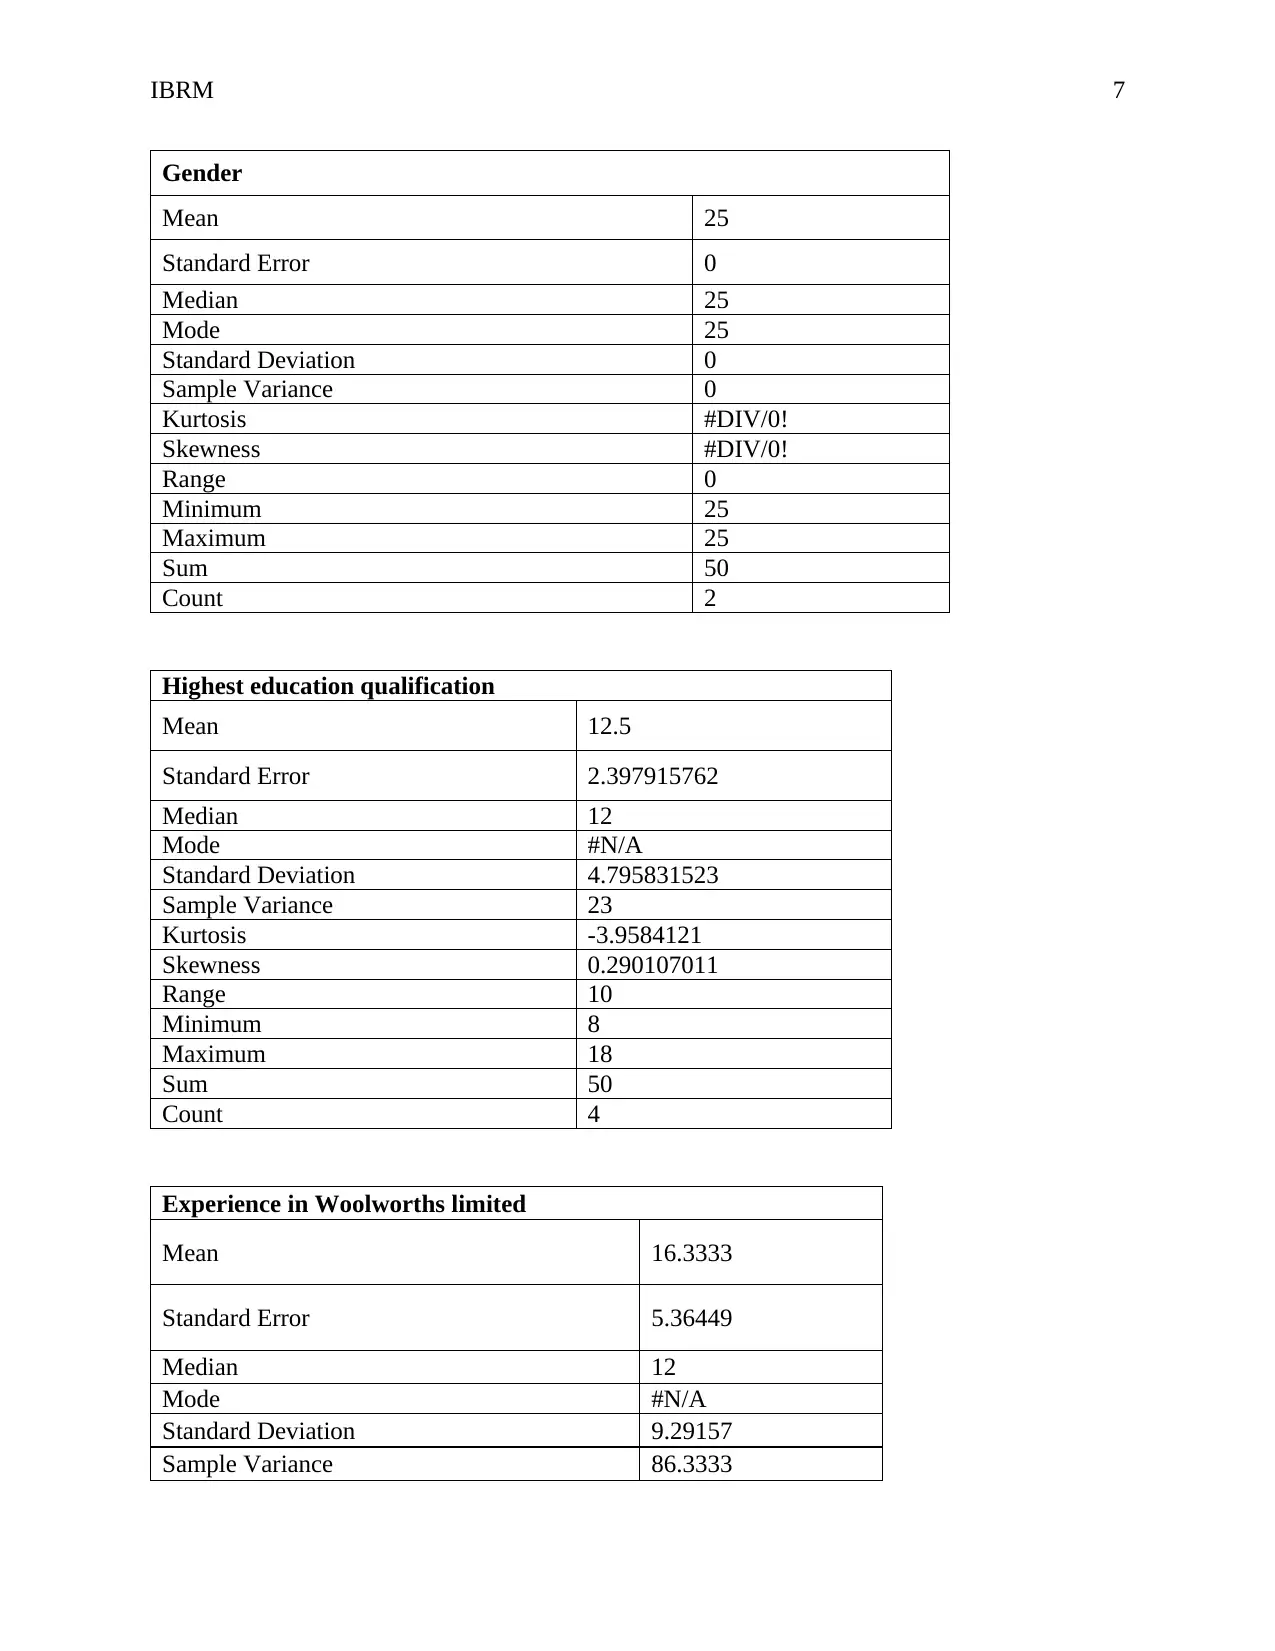
Gender
Mean 25
Standard Error 0
Median 25
Mode 25
Standard Deviation 0
Sample Variance 0
Kurtosis #DIV/0!
Skewness #DIV/0!
Range 0
Minimum 25
Maximum 25
Sum 50
Count 2
Highest education qualification
Mean 12.5
Standard Error 2.397915762
Median 12
Mode #N/A
Standard Deviation 4.795831523
Sample Variance 23
Kurtosis -3.9584121
Skewness 0.290107011
Range 10
Minimum 8
Maximum 18
Sum 50
Count 4
Experience in Woolworths limited
Mean 16.3333
Standard Error 5.36449
Median 12
Mode #N/A
Standard Deviation 9.29157
Sample Variance 86.3333
Paraphrase This Document
Need a fresh take? Get an instant paraphrase of this document with our AI Paraphraser
IBRM 8
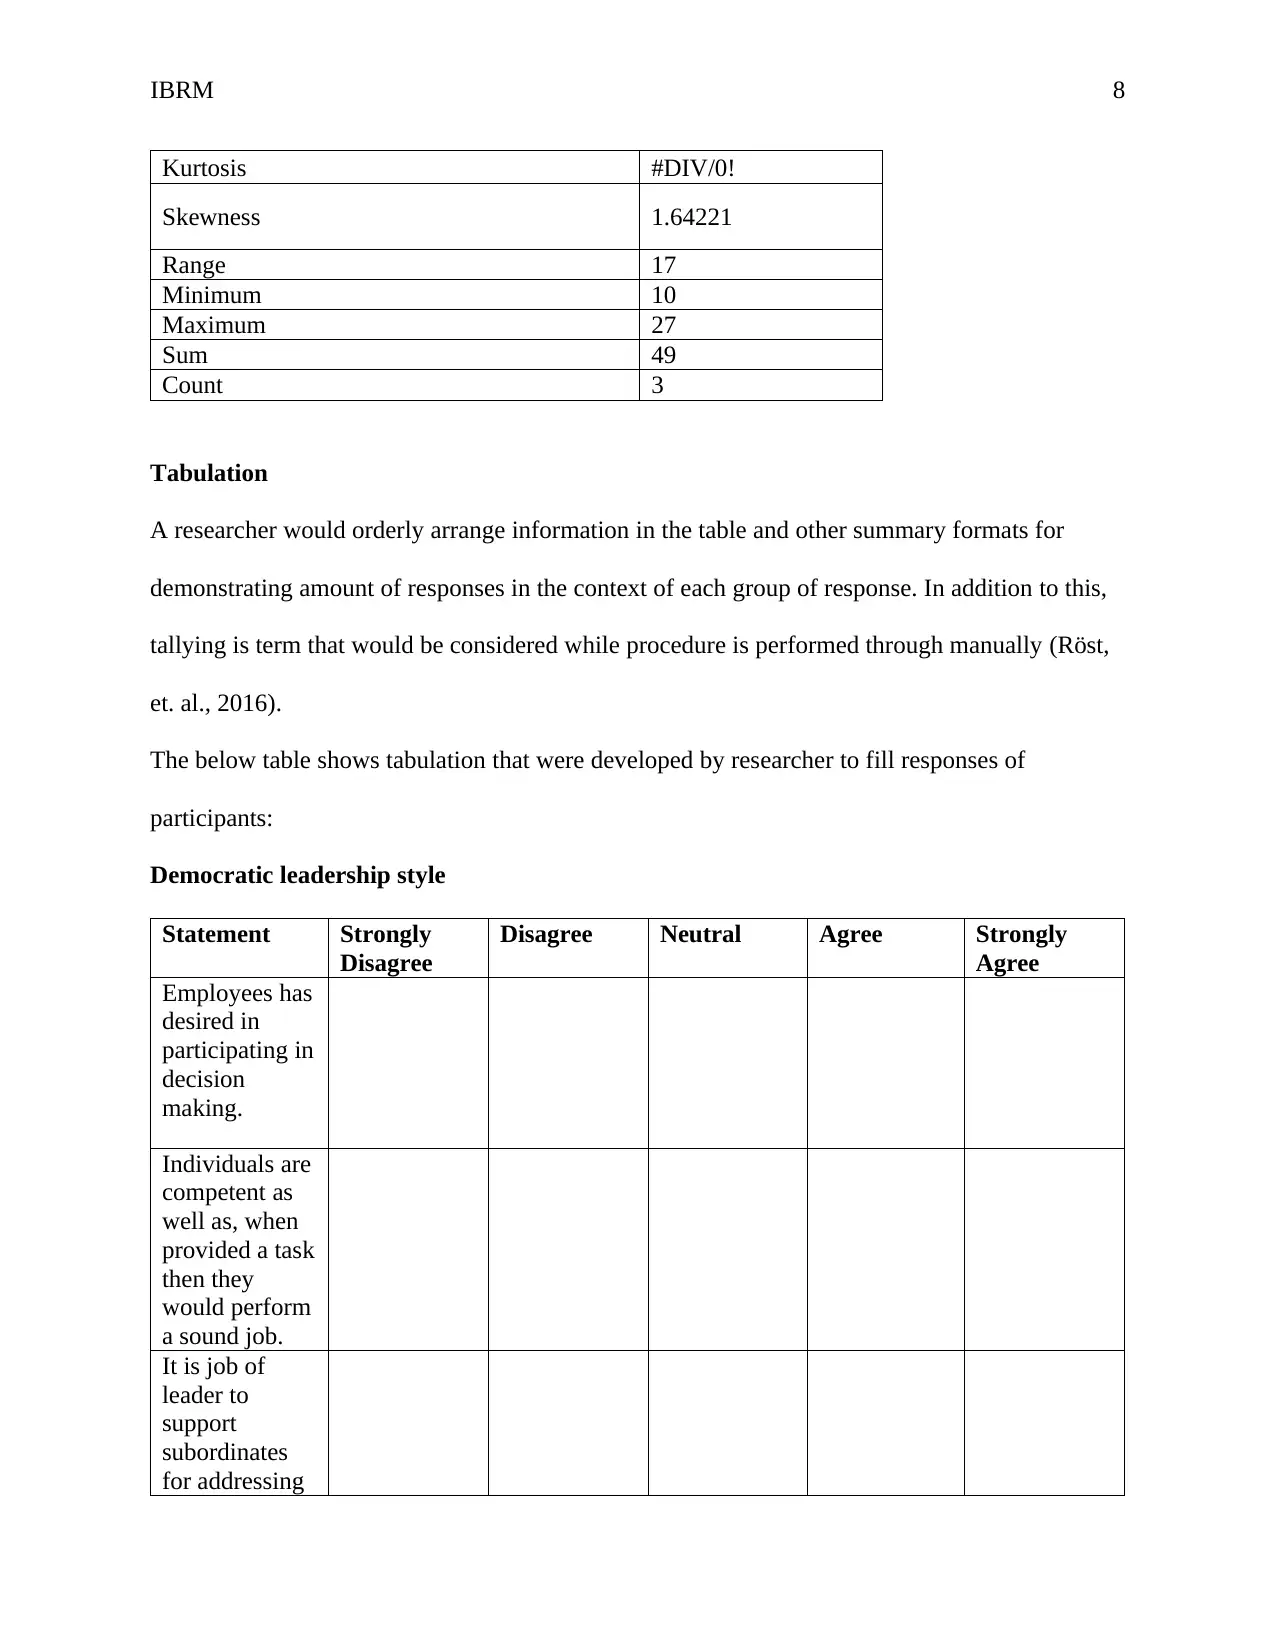
Kurtosis #DIV/0!
Skewness 1.64221
Range 17
Minimum 10
Maximum 27
Sum 49
Count 3
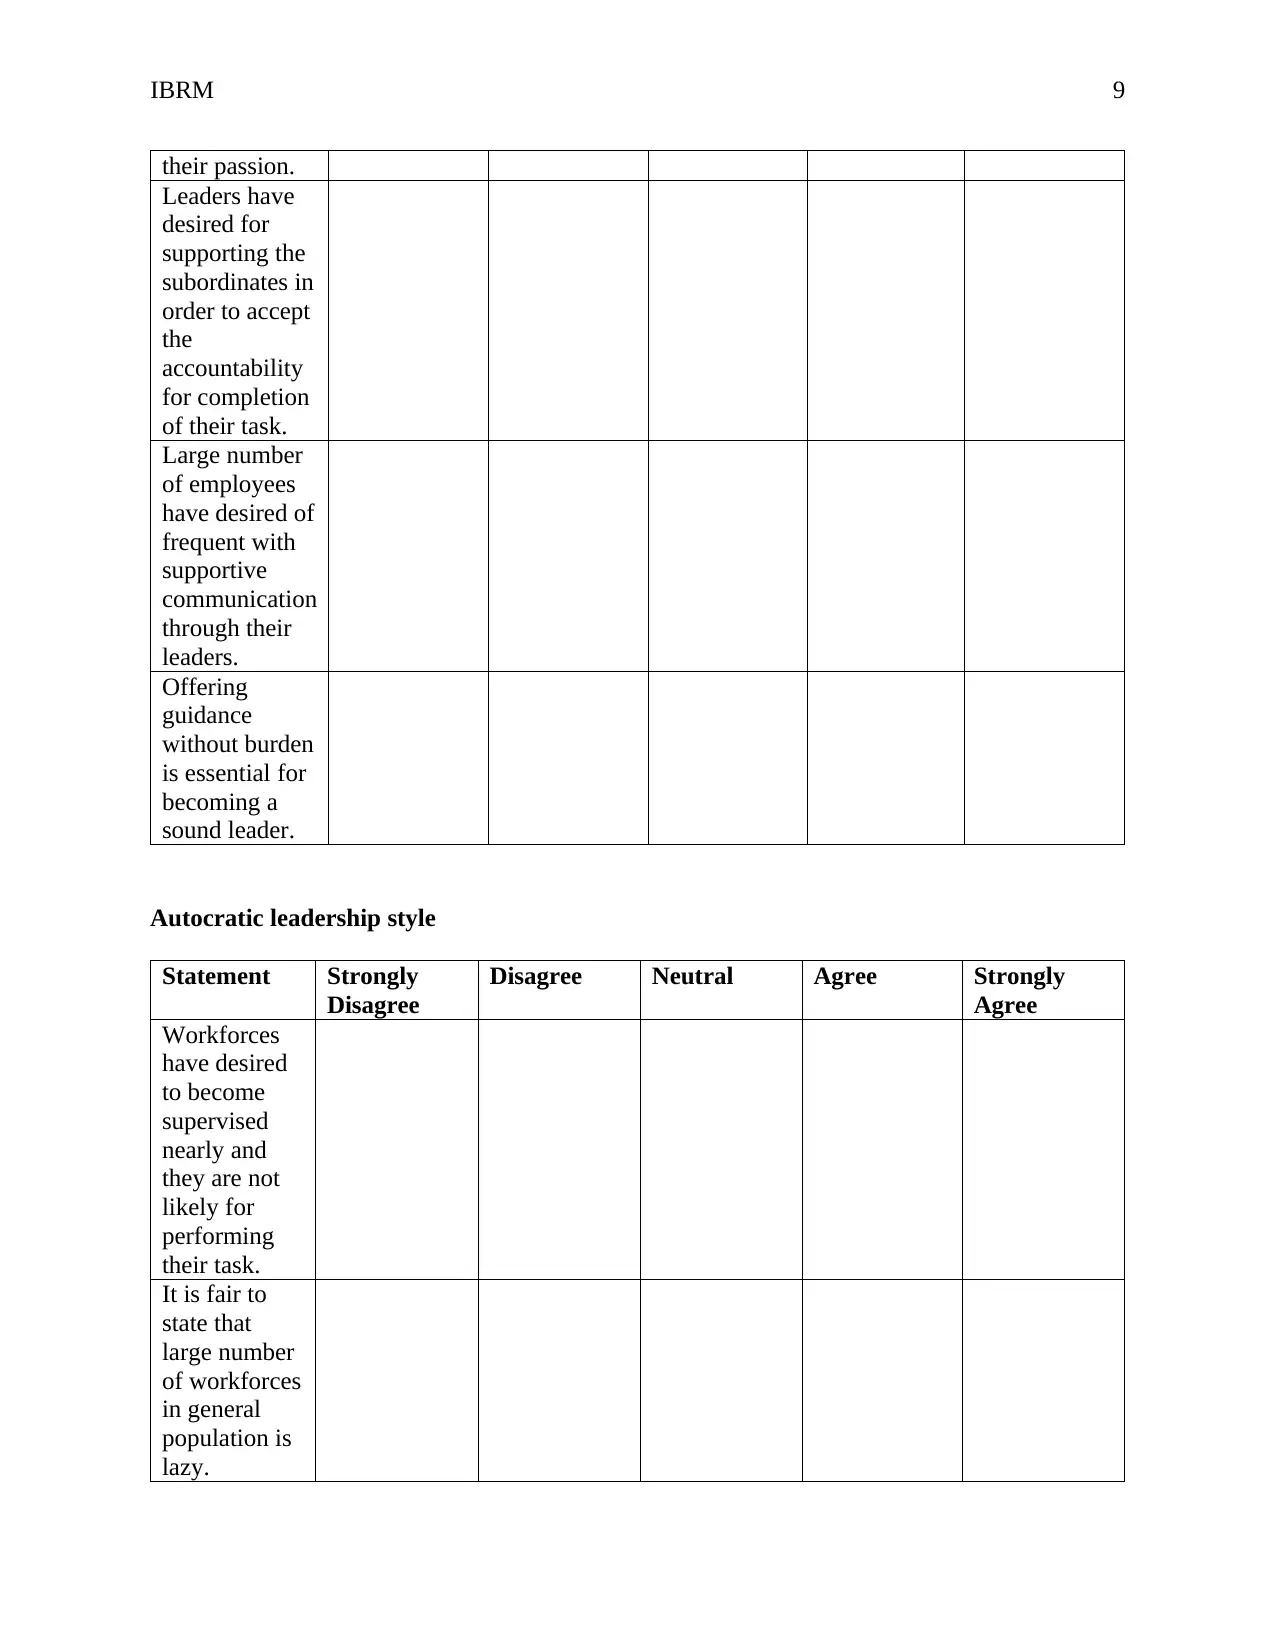
Tabulation
A researcher would orderly arrange information in the table and other summary formats for
demonstrating amount of responses in the context of each group of response. In addition to this,
tallying is term that would be considered while procedure is performed through manually (Röst,
et. al., 2016).
The below table shows tabulation that were developed by researcher to fill responses of
participants:
Democratic leadership style
Statement Strongly
Disagree
Disagree Neutral Agree Strongly
Agree
Employees has
desired in
participating in
decision
making.
Individuals are
competent as
well as, when
provided a task
then they
would perform
a sound job.
It is job of
leader to
support
subordinates
for addressing
Kurtosis #DIV/0!
Skewness 1.64221
Range 17
Minimum 10
Maximum 27
Sum 49
Count 3
Tabulation
A researcher would orderly arrange information in the table and other summary formats for
demonstrating amount of responses in the context of each group of response. In addition to this,
tallying is term that would be considered while procedure is performed through manually (Röst,
et. al., 2016).
The below table shows tabulation that were developed by researcher to fill responses of
participants:
Democratic leadership style
Statement Strongly
Disagree
Disagree Neutral Agree Strongly
Agree
Employees has
desired in
participating in
decision
making.
Individuals are
competent as
well as, when
provided a task
then they
would perform
a sound job.
It is job of
leader to
support
subordinates
for addressing
IBRM 9
their passion.
Leaders have
desired for
supporting the
subordinates in
order to accept
the
accountability
for completion
of their task.
Large number
of employees
have desired of
frequent with
supportive
communication
through their
leaders.
Offering
guidance
without burden
is essential for
becoming a
sound leader.
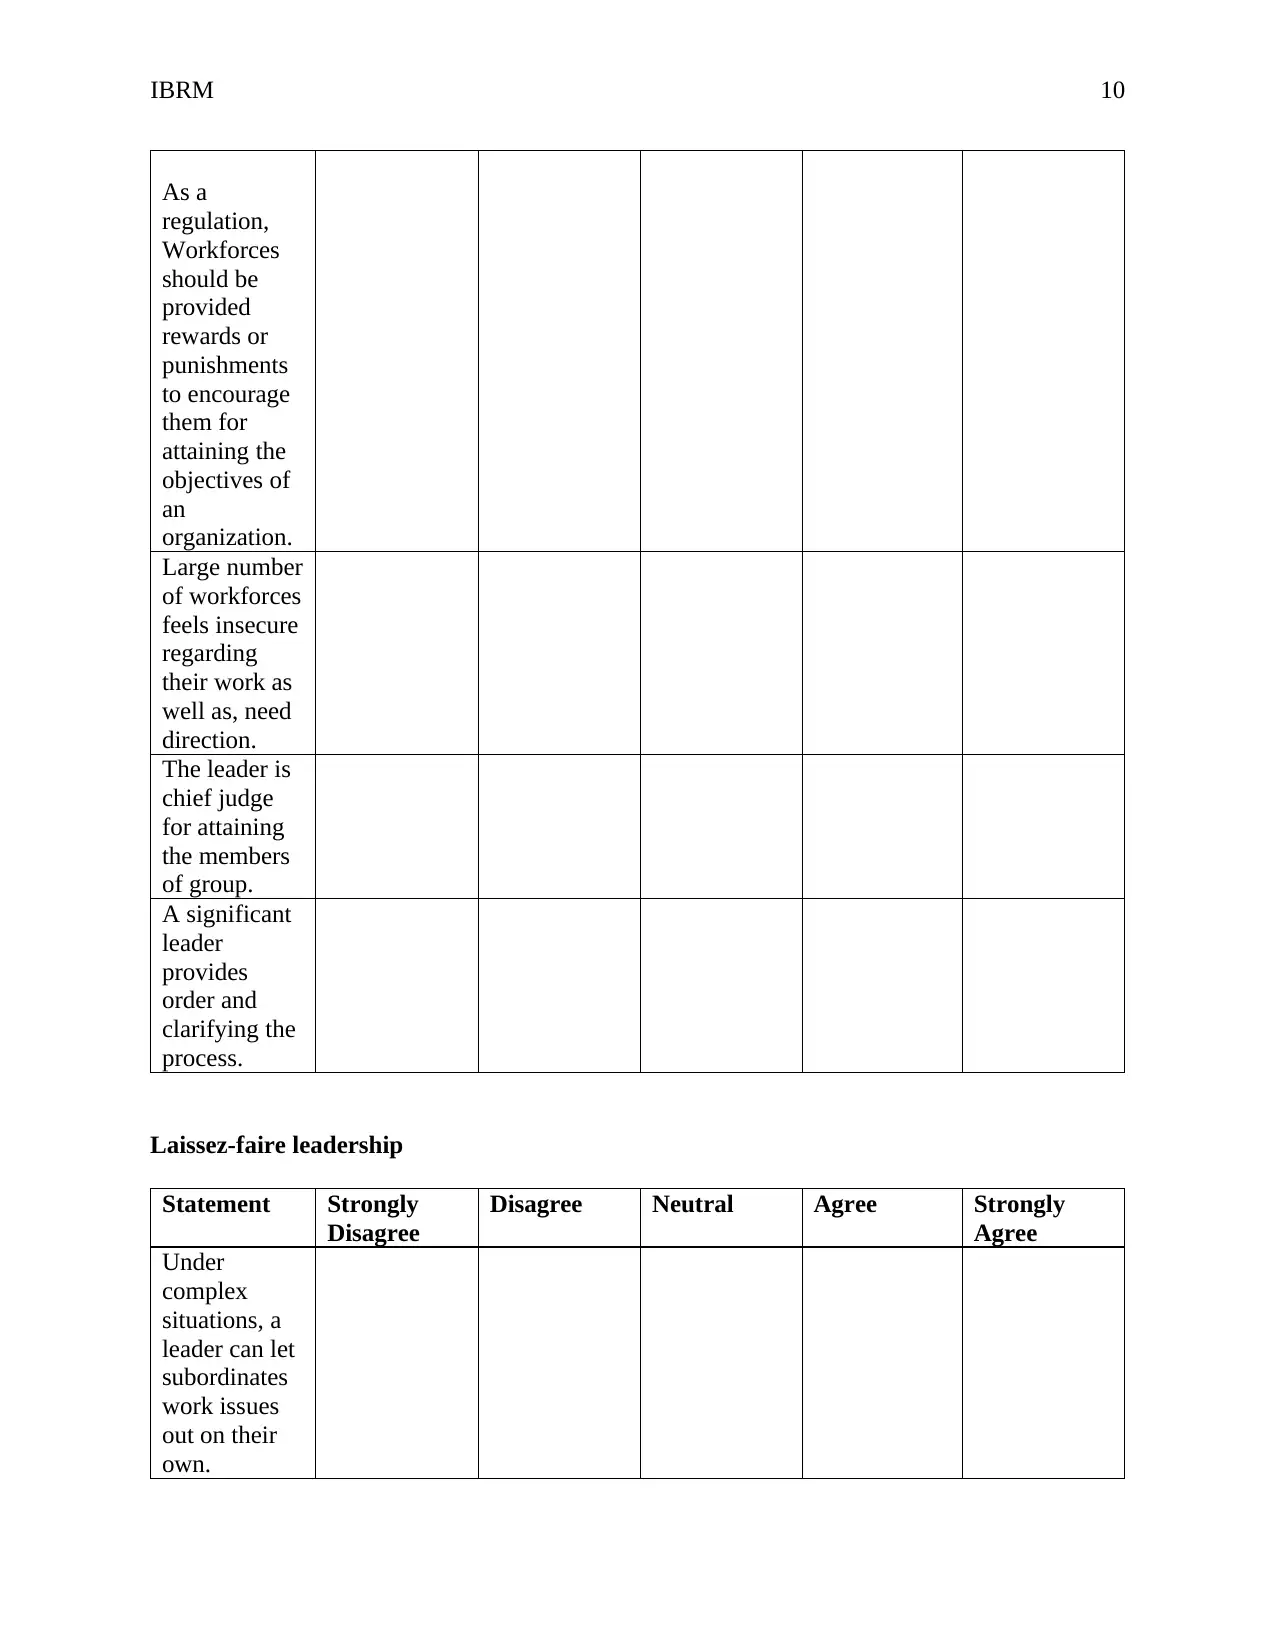
Autocratic leadership style
Statement Strongly
Disagree
Disagree Neutral Agree Strongly
Agree
Workforces
have desired
to become
supervised
nearly and
they are not
likely for
performing
their task.
It is fair to
state that
large number
of workforces
in general
population is
lazy.
their passion.
Leaders have
desired for
supporting the
subordinates in
order to accept
the
accountability
for completion
of their task.
Large number
of employees
have desired of
frequent with
supportive
communication
through their
leaders.
Offering
guidance
without burden
is essential for
becoming a
sound leader.
Autocratic leadership style
Statement Strongly
Disagree
Disagree Neutral Agree Strongly
Agree
Workforces
have desired
to become
supervised
nearly and
they are not
likely for
performing
their task.
It is fair to
state that
large number
of workforces
in general
population is
lazy.
⊘ This is a preview!⊘
Do you want full access?
Subscribe today to unlock all pages.
Trusted by 1+ million students worldwide
IBRM 10
As a
regulation,
Workforces
should be
provided
rewards or
punishments
to encourage
them for
attaining the
objectives of
an
organization.
Large number
of workforces
feels insecure
regarding
their work as
well as, need
direction.
The leader is
chief judge
for attaining
the members
of group.
A significant
leader
provides
order and
clarifying the
process.
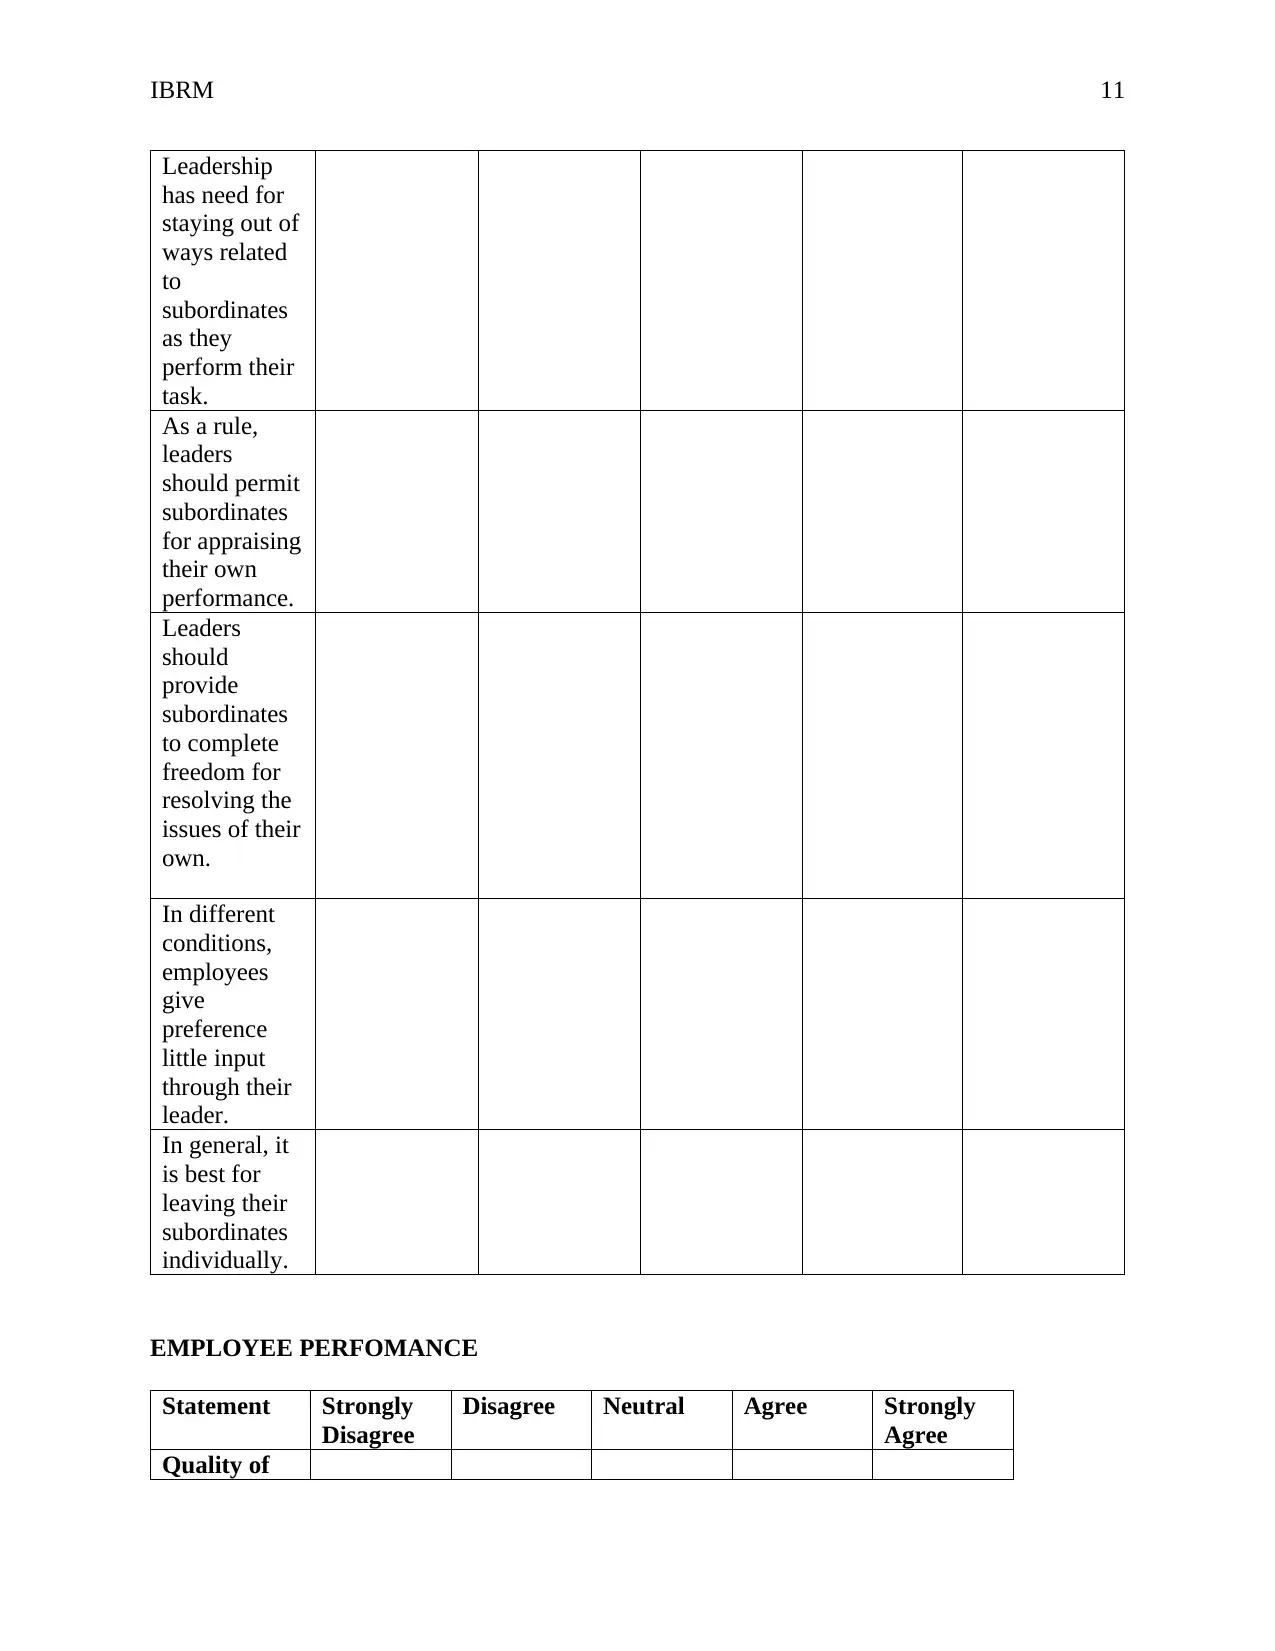
Laissez-faire leadership
Statement Strongly
Disagree
Disagree Neutral Agree Strongly
Agree
Under
complex
situations, a
leader can let
subordinates
work issues
out on their
own.
As a
regulation,
Workforces
should be
provided
rewards or
punishments
to encourage
them for
attaining the
objectives of
an
organization.
Large number
of workforces
feels insecure
regarding
their work as
well as, need
direction.
The leader is
chief judge
for attaining
the members
of group.
A significant
leader
provides
order and
clarifying the
process.
Laissez-faire leadership
Statement Strongly
Disagree
Disagree Neutral Agree Strongly
Agree
Under
complex
situations, a
leader can let
subordinates
work issues
out on their
own.
Paraphrase This Document
Need a fresh take? Get an instant paraphrase of this document with our AI Paraphraser
IBRM 11
Leadership
has need for
staying out of
ways related
to
subordinates
as they
perform their
task.
As a rule,
leaders
should permit
subordinates
for appraising
their own
performance.
Leaders
should
provide
subordinates
to complete
freedom for
resolving the
issues of their
own.
In different
conditions,
employees
give
preference
little input
through their
leader.
In general, it
is best for
leaving their
subordinates
individually.
EMPLOYEE PERFOMANCE
Statement Strongly
Disagree
Disagree Neutral Agree Strongly
Agree
Quality of
IBRM 12
your
performanc
e and
productivity
Please
provides
rating to
quality of
your
performance
?
Please
provides
rating to
productivity
on the job?
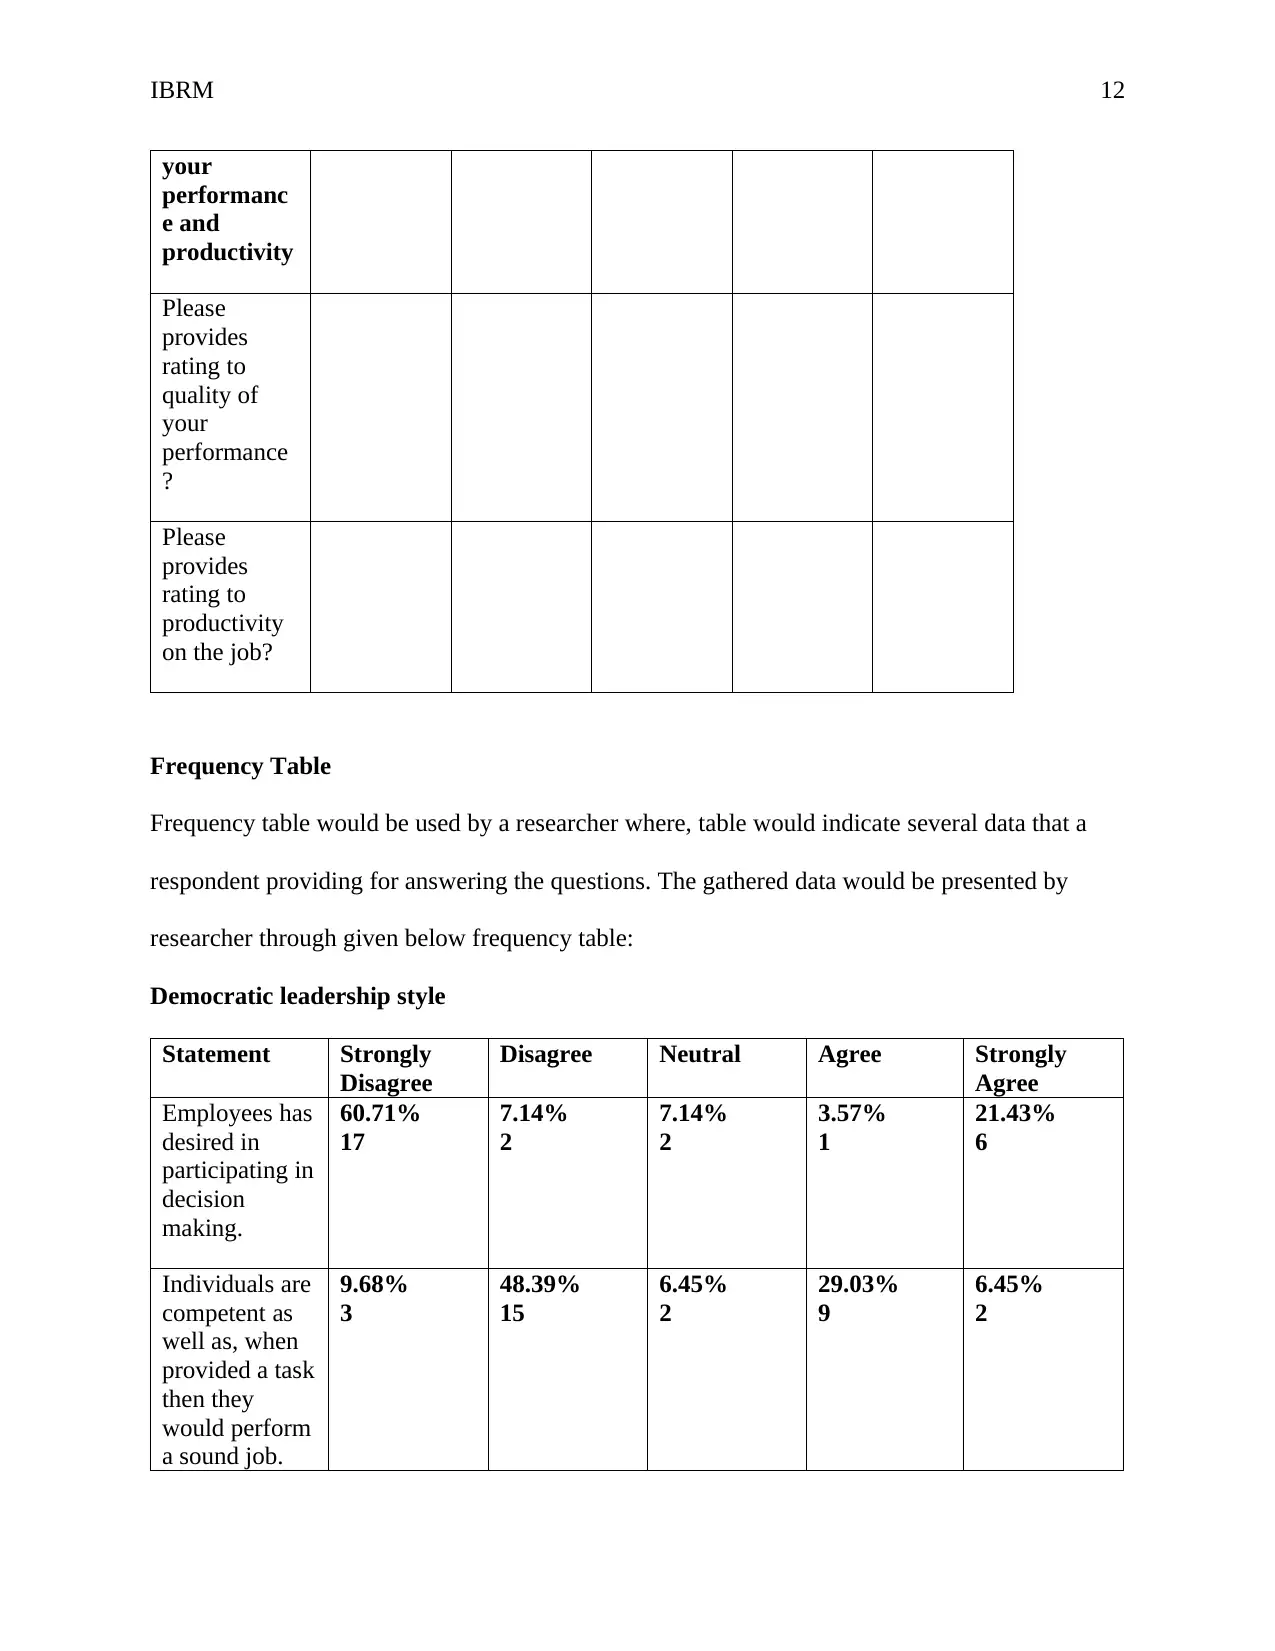
Frequency Table
Frequency table would be used by a researcher where, table would indicate several data that a
respondent providing for answering the questions. The gathered data would be presented by
researcher through given below frequency table:
Democratic leadership style
Statement Strongly
Disagree
Disagree Neutral Agree Strongly
Agree
Employees has
desired in
participating in
decision
making.
60.71%
17
7.14%
2
7.14%
2
3.57%
1
21.43%
6
Individuals are
competent as
well as, when
provided a task
then they
would perform
a sound job.
9.68%
3
48.39%
15
6.45%
2
29.03%
9
6.45%
2
your
performanc
e and
productivity
Please
provides
rating to
quality of
your
performance
?
Please
provides
rating to
productivity
on the job?
Frequency Table
Frequency table would be used by a researcher where, table would indicate several data that a
respondent providing for answering the questions. The gathered data would be presented by
researcher through given below frequency table:
Democratic leadership style
Statement Strongly
Disagree
Disagree Neutral Agree Strongly
Agree
Employees has
desired in
participating in
decision
making.
60.71%
17
7.14%
2
7.14%
2
3.57%
1
21.43%
6
Individuals are
competent as
well as, when
provided a task
then they
would perform
a sound job.
9.68%
3
48.39%
15
6.45%
2
29.03%
9
6.45%
2
⊘ This is a preview!⊘
Do you want full access?
Subscribe today to unlock all pages.
Trusted by 1+ million students worldwide
1 out of 21