Microeconomic Principles
VerifiedAdded on 2022/12/20
|13
|1955
|1
AI Summary
This document discusses various topics in microeconomic principles, including allocative efficiency, advantages and disadvantages of a single seller, perfectly competitive market, monopolistic competition, oligopoly market, subsidies, taxation, and more.
Contribute Materials
Your contribution can guide someone’s learning journey. Share your
documents today.
Running head: MICROECONOMIC PRINCIPLES
1
Microeconomic Principles
Student’s name
Professor
Course
Date
1
Microeconomic Principles
Student’s name
Professor
Course
Date
Secure Best Marks with AI Grader
Need help grading? Try our AI Grader for instant feedback on your assignments.
MICROECONOMIC PRINCIPLES
2
Question 1
a.
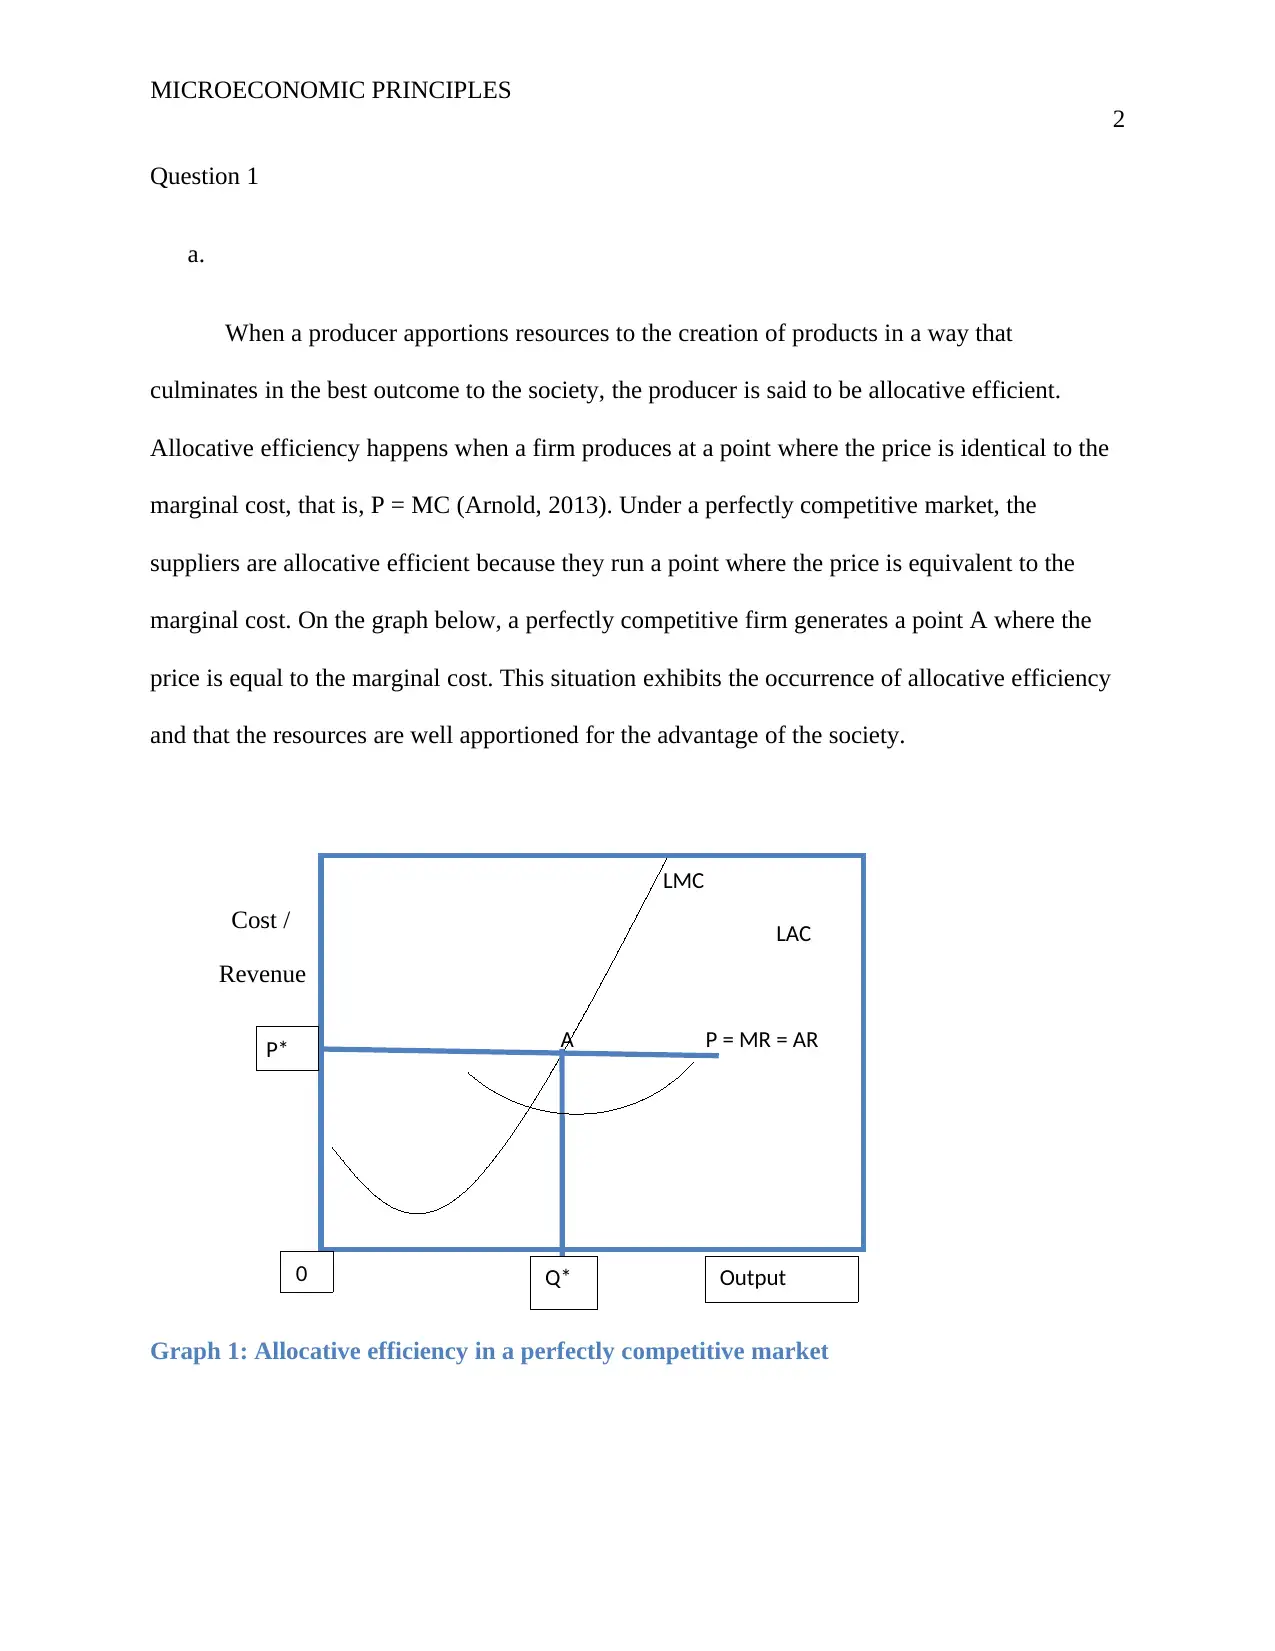
When a producer apportions resources to the creation of products in a way that
culminates in the best outcome to the society, the producer is said to be allocative efficient.
Allocative efficiency happens when a firm produces at a point where the price is identical to the
marginal cost, that is, P = MC (Arnold, 2013). Under a perfectly competitive market, the
suppliers are allocative efficient because they run a point where the price is equivalent to the
marginal cost. On the graph below, a perfectly competitive firm generates a point A where the
price is equal to the marginal cost. This situation exhibits the occurrence of allocative efficiency
and that the resources are well apportioned for the advantage of the society.
Cost /
Revenue
Graph 1: Allocative efficiency in a perfectly competitive market
LMC
LAC
A P = MR = ARP*
Q*0 Output
2
Question 1
a.
When a producer apportions resources to the creation of products in a way that
culminates in the best outcome to the society, the producer is said to be allocative efficient.
Allocative efficiency happens when a firm produces at a point where the price is identical to the
marginal cost, that is, P = MC (Arnold, 2013). Under a perfectly competitive market, the
suppliers are allocative efficient because they run a point where the price is equivalent to the
marginal cost. On the graph below, a perfectly competitive firm generates a point A where the
price is equal to the marginal cost. This situation exhibits the occurrence of allocative efficiency
and that the resources are well apportioned for the advantage of the society.
Cost /
Revenue
Graph 1: Allocative efficiency in a perfectly competitive market
LMC
LAC
A P = MR = ARP*
Q*0 Output
MICROECONOMIC PRINCIPLES
3
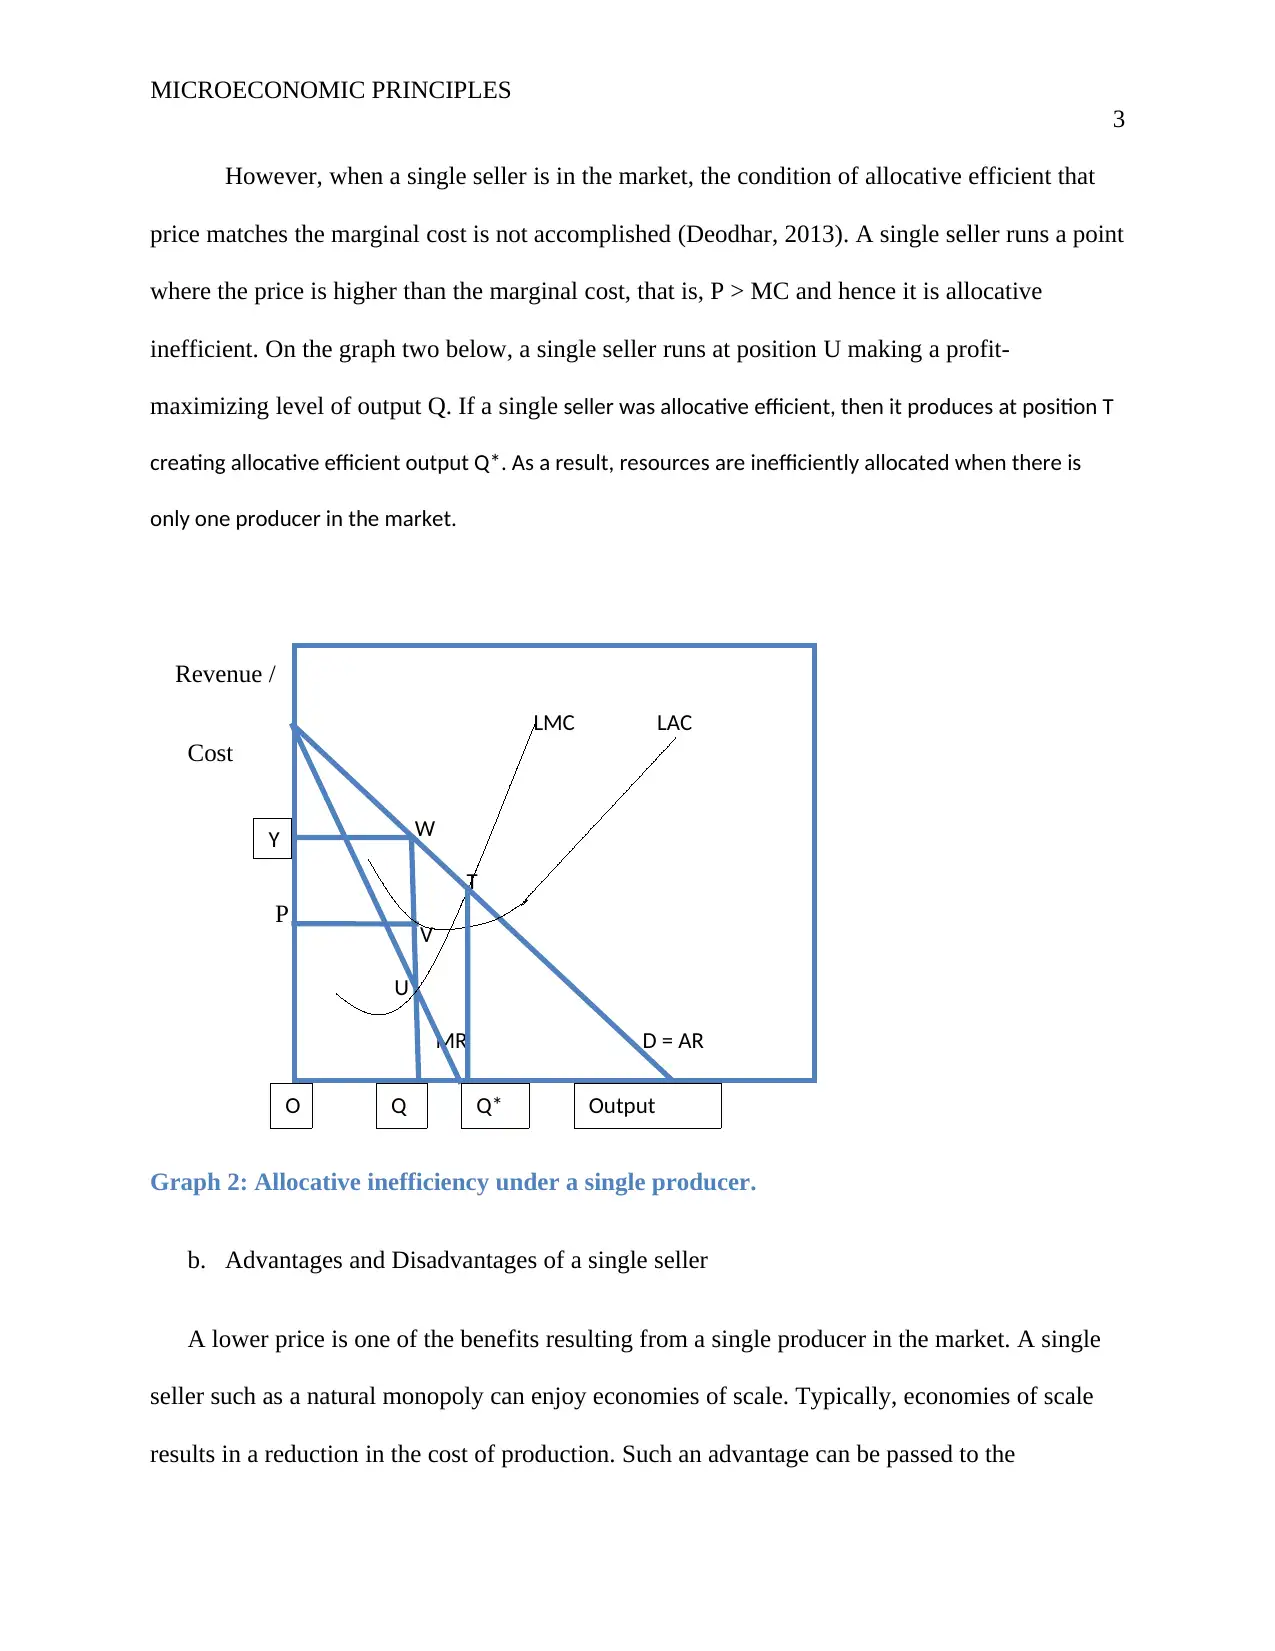
However, when a single seller is in the market, the condition of allocative efficient that
price matches the marginal cost is not accomplished (Deodhar, 2013). A single seller runs a point
where the price is higher than the marginal cost, that is, P > MC and hence it is allocative
inefficient. On the graph two below, a single seller runs at position U making a profit-
maximizing level of output Q. If a single seller was allocative efficient, then it produces at position T
creating allocative efficient output Q*. As a result, resources are inefficiently allocated when there is
only one producer in the market.
Revenue /
Cost
P V V
Graph 2: Allocative inefficiency under a single producer.
b. Advantages and Disadvantages of a single seller
A lower price is one of the benefits resulting from a single producer in the market. A single
seller such as a natural monopoly can enjoy economies of scale. Typically, economies of scale
results in a reduction in the cost of production. Such an advantage can be passed to the
LMC LAC
W
T
V
U
MR D = AR
O Q
*
OutputQ*
Y
3
However, when a single seller is in the market, the condition of allocative efficient that
price matches the marginal cost is not accomplished (Deodhar, 2013). A single seller runs a point
where the price is higher than the marginal cost, that is, P > MC and hence it is allocative
inefficient. On the graph two below, a single seller runs at position U making a profit-
maximizing level of output Q. If a single seller was allocative efficient, then it produces at position T
creating allocative efficient output Q*. As a result, resources are inefficiently allocated when there is
only one producer in the market.
Revenue /
Cost
P V V
Graph 2: Allocative inefficiency under a single producer.
b. Advantages and Disadvantages of a single seller
A lower price is one of the benefits resulting from a single producer in the market. A single
seller such as a natural monopoly can enjoy economies of scale. Typically, economies of scale
results in a reduction in the cost of production. Such an advantage can be passed to the
LMC LAC
W
T
V
U
MR D = AR
O Q
*
OutputQ*
Y
MICROECONOMIC PRINCIPLES
4
purchasers through reduced prices (Hubbard, Garnett, Lewis, & O'Brien, 2016). Furthermore,
technological innovation is likely to occur when there is one seller in the market. New goods and
services require producers to incur finances on research and development. Since businesses with
market power have higher chances of making positive economic profits, they can utilize these
earnings towards the development of new products.
Despite these benefits, a single seller in the market has some shortcomings. Foremost,
monopolies charge consumers higher prices and thus cause a reduction in consumer surplus, that
is, the gain a consumer receives from the marketplace (Kleindl, Burrow, & Dlabay, 2016). In the
absence of competitors, a monopoly will make products of lower quality and purchasers will be
forced to buy since there are no close alternatives.
Question 2
a. Perfectly competitive market
A perfectly competitive market structure is used a benchmark for allocative efficiency
because there are no hurdles to market entry or exit, both producers and buyers have perfect
knowledge about the market, established producers have no advantage over newcomers, and that
market prices reflect complete mobility of resources (Laibson & List, 2015). As a result, a sellers
in perfect competition market run at a point where the price balances the marginal cost, that is, P
= MC. This shows that alloacative efficiency is attained. On the figure three below, a perfectly
competitive vendor operates a point A where price is identical to marginal cost. However, firms
in other types of market structures, that is, oligopoly, monopoly, and monopolistic competition
the price surpasses the marginal cost, and hence they are allocative inefficient.
Secure Best Marks with AI Grader
Need help grading? Try our AI Grader for instant feedback on your assignments.
MICROECONOMIC PRINCIPLES
5
Cost /
Revenue
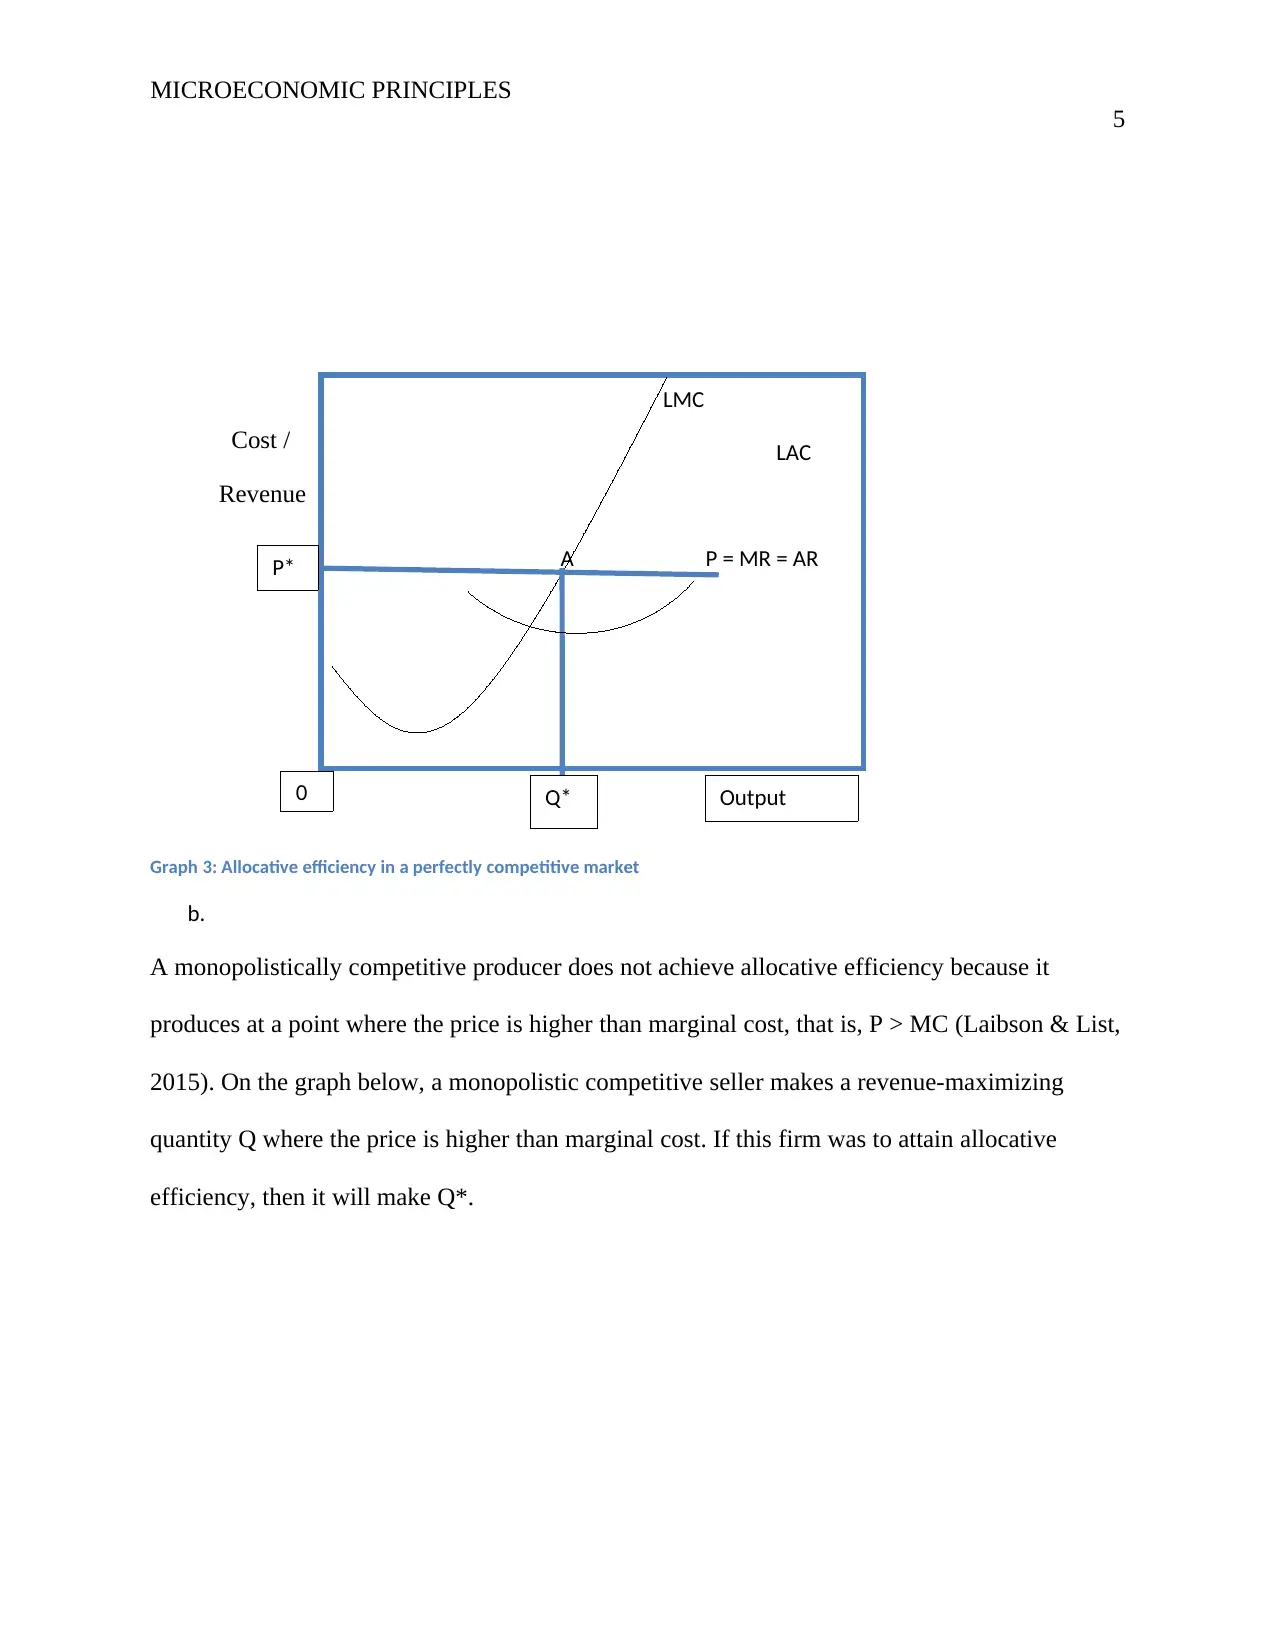
Graph 3: Allocative efficiency in a perfectly competitive market
b.
A monopolistically competitive producer does not achieve allocative efficiency because it
produces at a point where the price is higher than marginal cost, that is, P > MC (Laibson & List,
2015). On the graph below, a monopolistic competitive seller makes a revenue-maximizing
quantity Q where the price is higher than marginal cost. If this firm was to attain allocative
efficiency, then it will make Q*.
LMC
LAC
A P = MR = ARP*
Q*0 Output
5
Cost /
Revenue
Graph 3: Allocative efficiency in a perfectly competitive market
b.
A monopolistically competitive producer does not achieve allocative efficiency because it
produces at a point where the price is higher than marginal cost, that is, P > MC (Laibson & List,
2015). On the graph below, a monopolistic competitive seller makes a revenue-maximizing
quantity Q where the price is higher than marginal cost. If this firm was to attain allocative
efficiency, then it will make Q*.
LMC
LAC
A P = MR = ARP*
Q*0 Output
MICROECONOMIC PRINCIPLES
6
Revenue /
Cost
P
MC
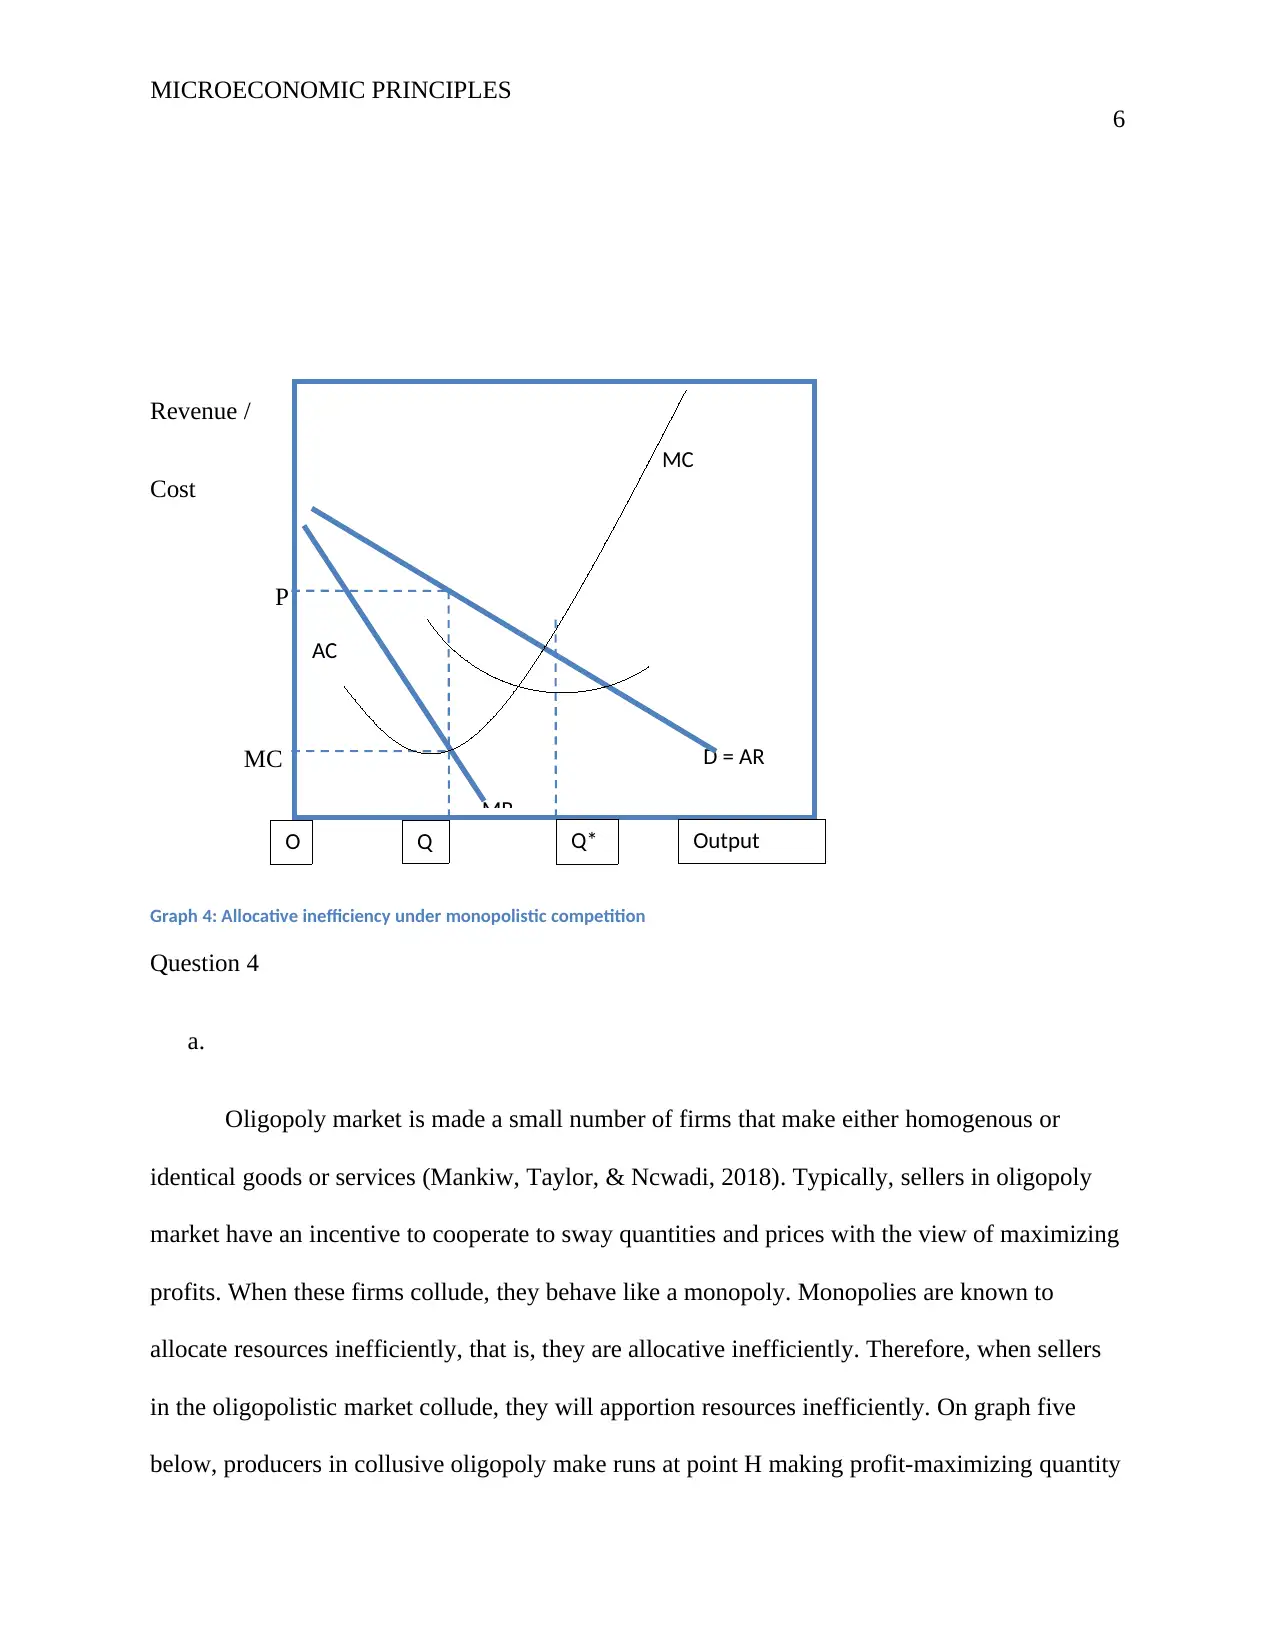
Graph 4: Allocative inefficiency under monopolistic competition
Question 4
a.
Oligopoly market is made a small number of firms that make either homogenous or
identical goods or services (Mankiw, Taylor, & Ncwadi, 2018). Typically, sellers in oligopoly
market have an incentive to cooperate to sway quantities and prices with the view of maximizing
profits. When these firms collude, they behave like a monopoly. Monopolies are known to
allocate resources inefficiently, that is, they are allocative inefficiently. Therefore, when sellers
in the oligopolistic market collude, they will apportion resources inefficiently. On graph five
below, producers in collusive oligopoly make runs at point H making profit-maximizing quantity
MC
AC
D = AR
MR
O Q OutputQ*
6
Revenue /
Cost
P
MC
Graph 4: Allocative inefficiency under monopolistic competition
Question 4
a.
Oligopoly market is made a small number of firms that make either homogenous or
identical goods or services (Mankiw, Taylor, & Ncwadi, 2018). Typically, sellers in oligopoly
market have an incentive to cooperate to sway quantities and prices with the view of maximizing
profits. When these firms collude, they behave like a monopoly. Monopolies are known to
allocate resources inefficiently, that is, they are allocative inefficiently. Therefore, when sellers
in the oligopolistic market collude, they will apportion resources inefficiently. On graph five
below, producers in collusive oligopoly make runs at point H making profit-maximizing quantity
MC
AC
D = AR
MR
O Q OutputQ*
MICROECONOMIC PRINCIPLES
7
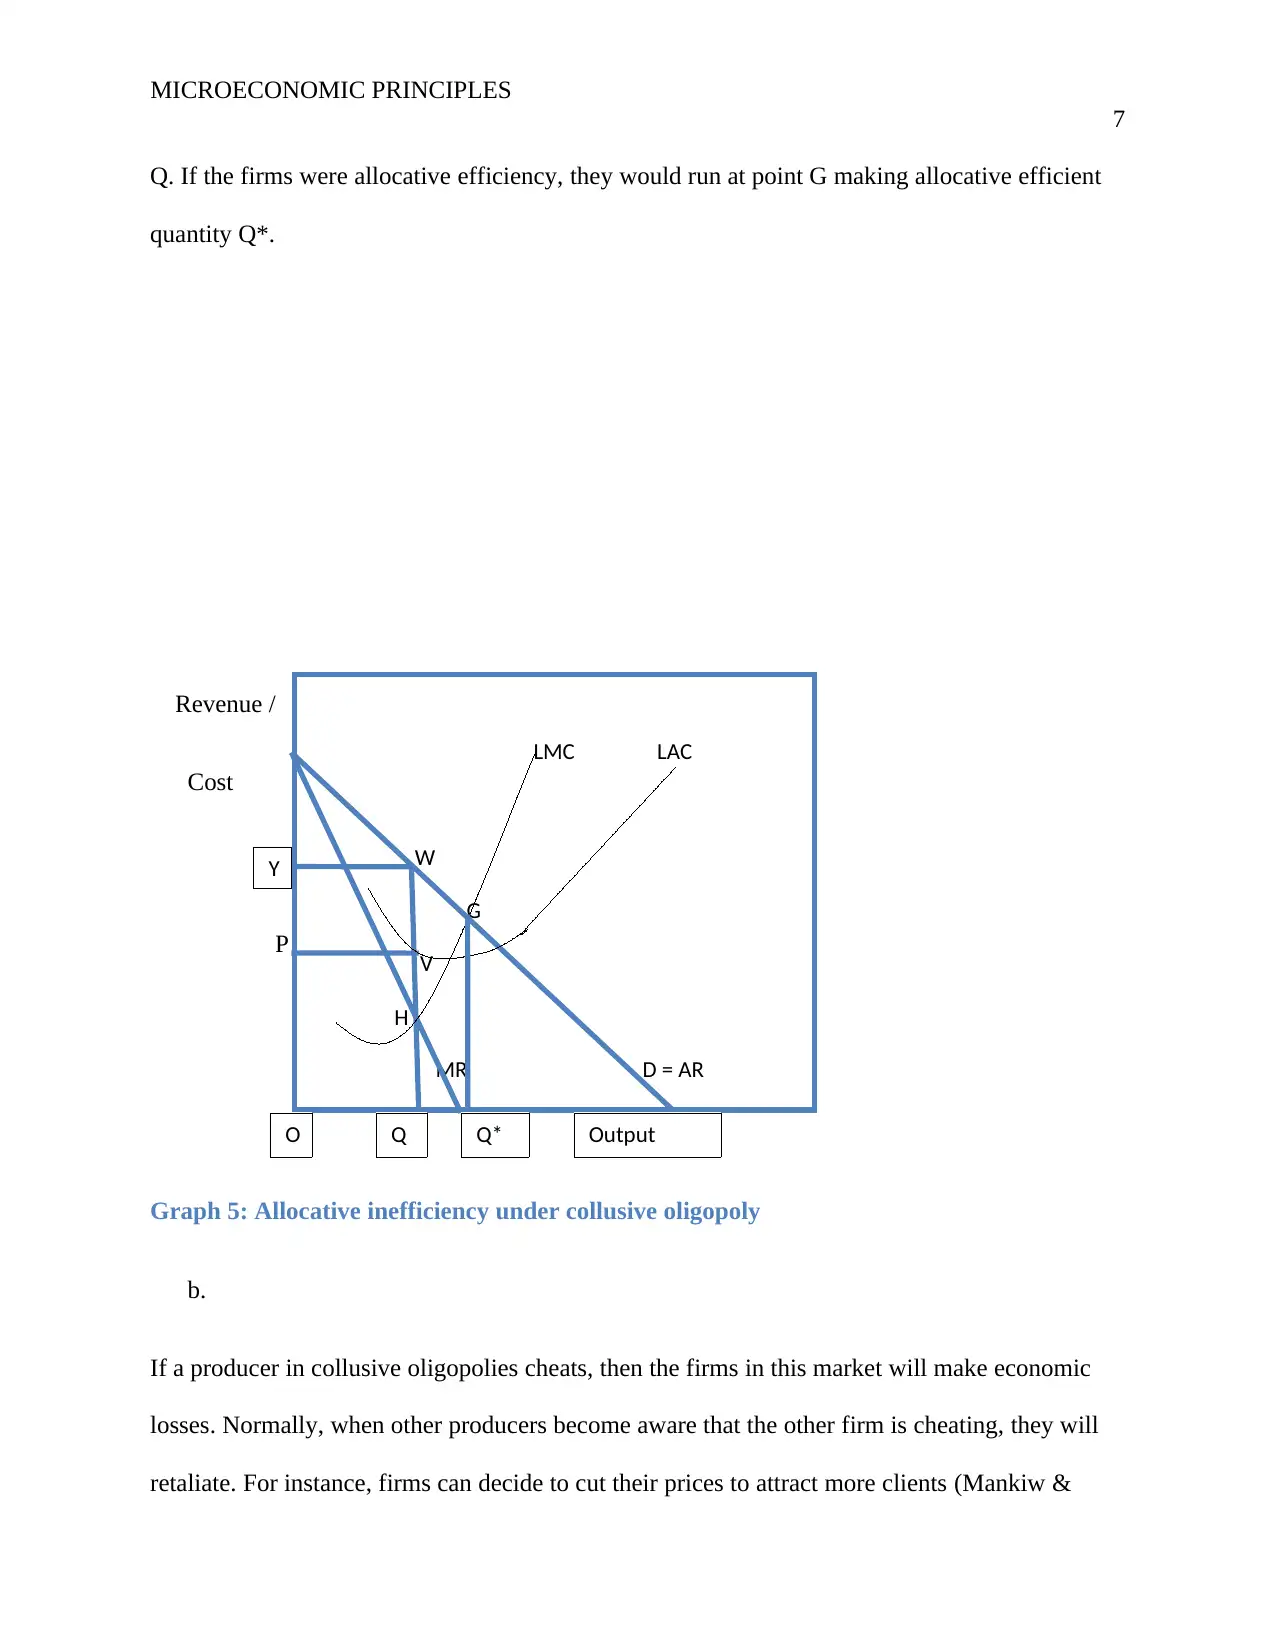
Q. If the firms were allocative efficiency, they would run at point G making allocative efficient
quantity Q*.
Revenue /
Cost
P V V
Graph 5: Allocative inefficiency under collusive oligopoly
b.
If a producer in collusive oligopolies cheats, then the firms in this market will make economic
losses. Normally, when other producers become aware that the other firm is cheating, they will
retaliate. For instance, firms can decide to cut their prices to attract more clients (Mankiw &
LMC LAC
W
G
V
H
MR D = AR
O Q
*
OutputQ*
Y
7
Q. If the firms were allocative efficiency, they would run at point G making allocative efficient
quantity Q*.
Revenue /
Cost
P V V
Graph 5: Allocative inefficiency under collusive oligopoly
b.
If a producer in collusive oligopolies cheats, then the firms in this market will make economic
losses. Normally, when other producers become aware that the other firm is cheating, they will
retaliate. For instance, firms can decide to cut their prices to attract more clients (Mankiw &
LMC LAC
W
G
V
H
MR D = AR
O Q
*
OutputQ*
Y
Paraphrase This Document
Need a fresh take? Get an instant paraphrase of this document with our AI Paraphraser
MICROECONOMIC PRINCIPLES
8
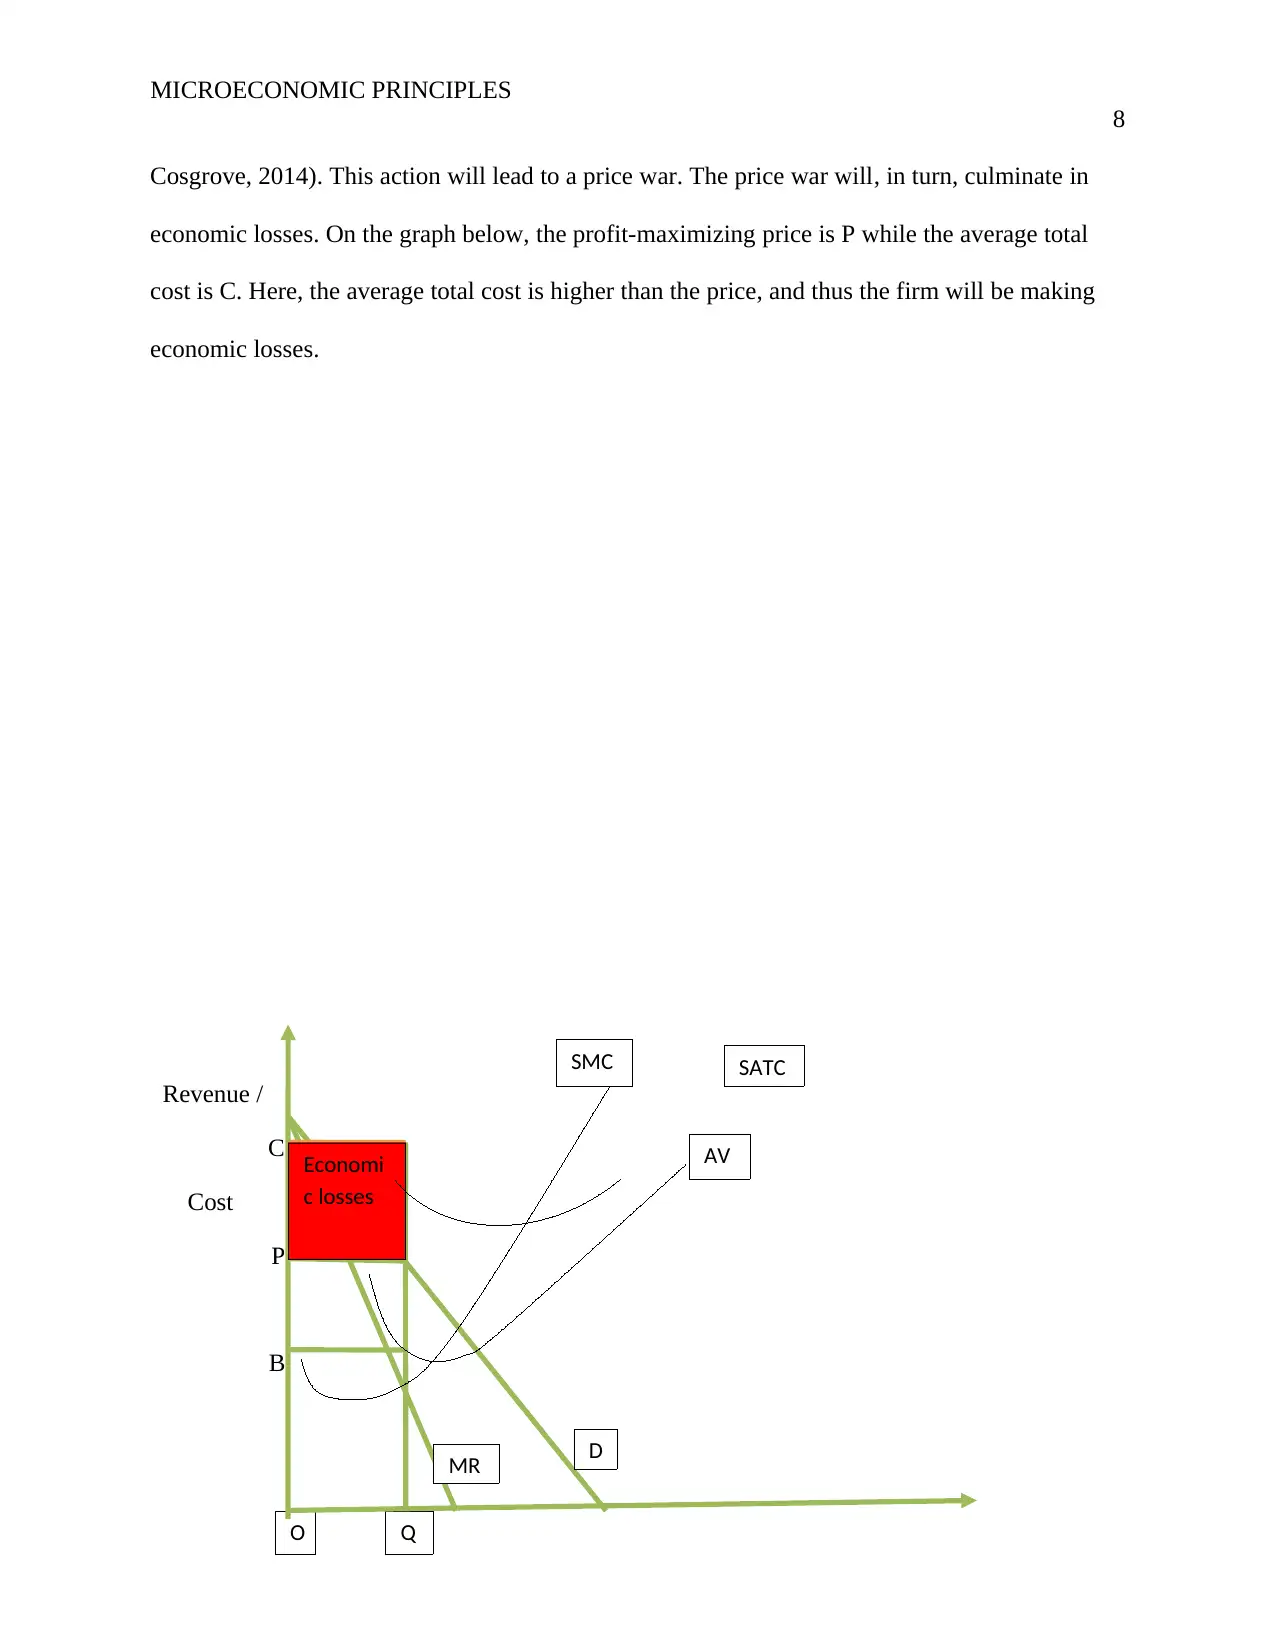
Cosgrove, 2014). This action will lead to a price war. The price war will, in turn, culminate in
economic losses. On the graph below, the profit-maximizing price is P while the average total
cost is C. Here, the average total cost is higher than the price, and thus the firm will be making
economic losses.
Revenue /
C
Cost
P
B
O Q
D
MR
SMC SATC
AVEconomi
c losses
8
Cosgrove, 2014). This action will lead to a price war. The price war will, in turn, culminate in
economic losses. On the graph below, the profit-maximizing price is P while the average total
cost is C. Here, the average total cost is higher than the price, and thus the firm will be making
economic losses.
Revenue /
C
Cost
P
B
O Q
D
MR
SMC SATC
AVEconomi
c losses
MICROECONOMIC PRINCIPLES
9
Output
Graph 6: Economic loss under collusive oligopoly
Question 6
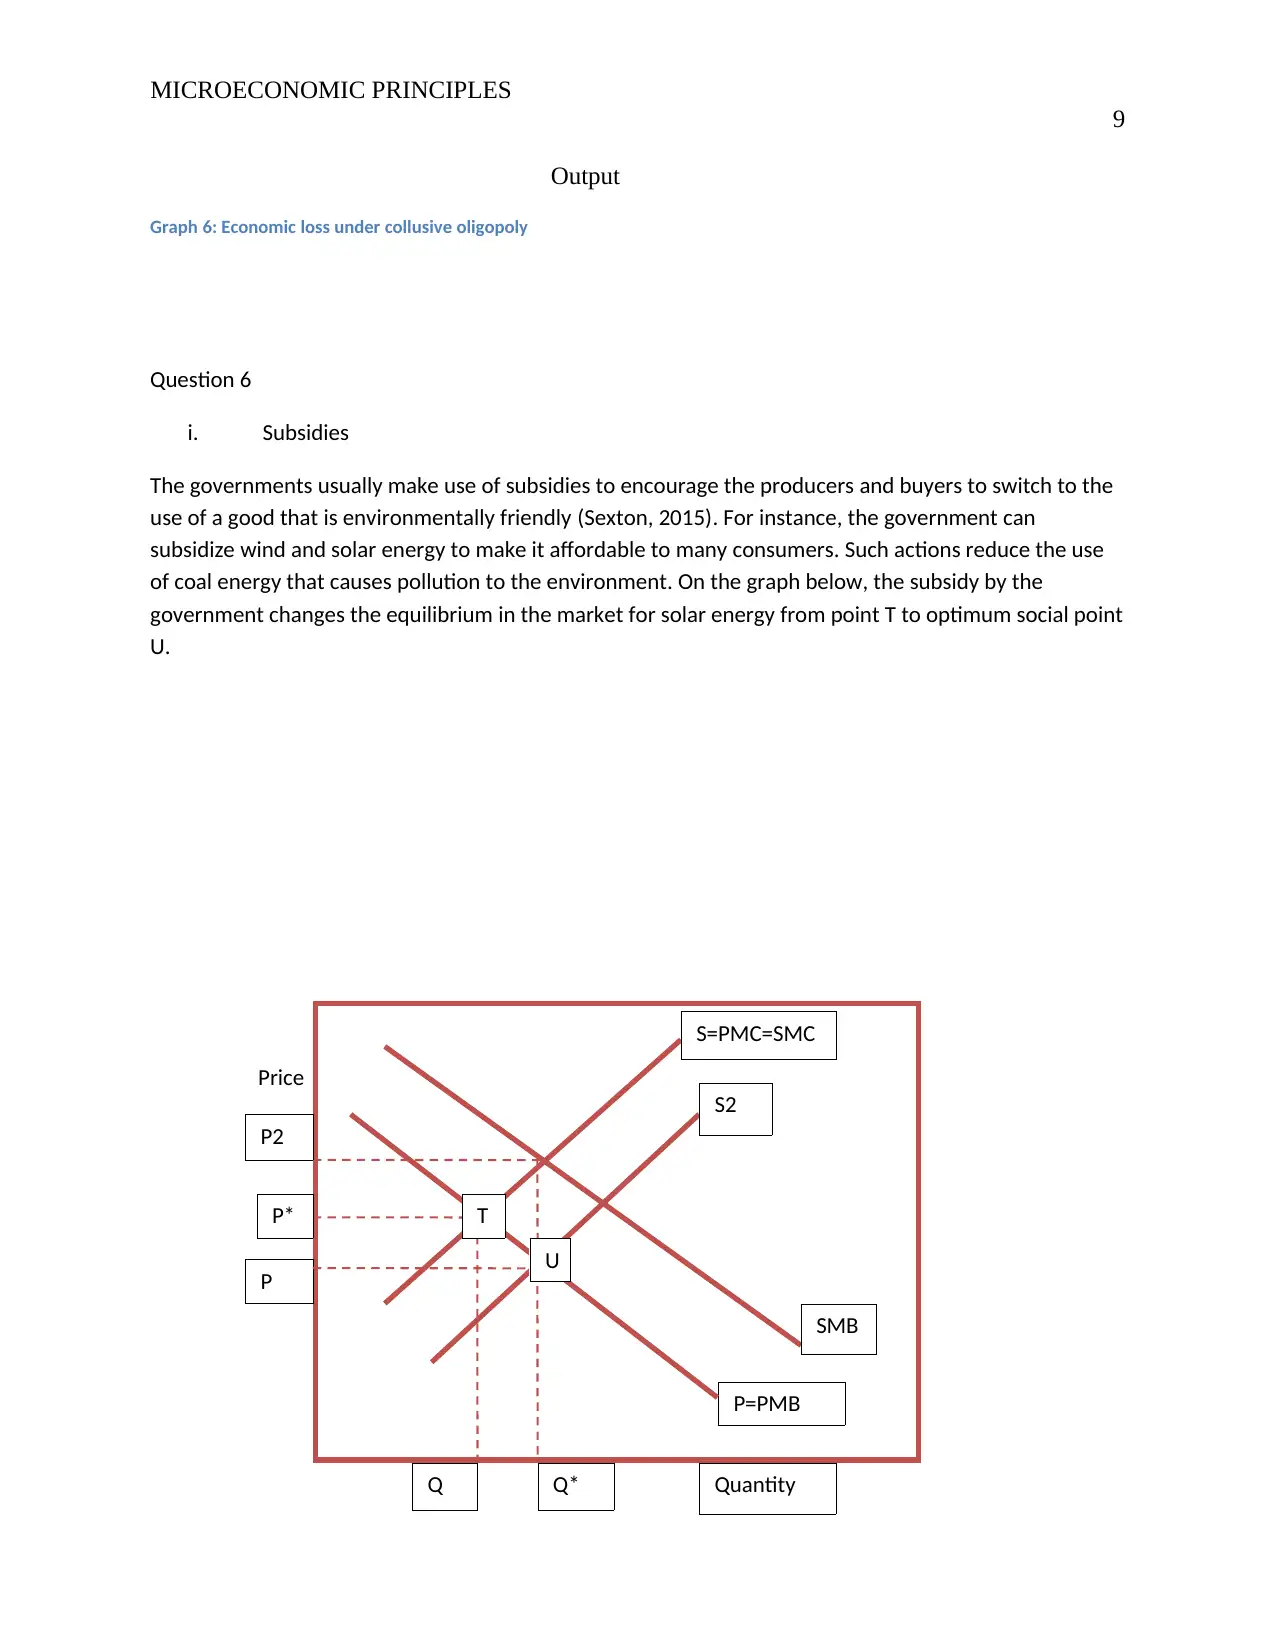
i. Subsidies
The governments usually make use of subsidies to encourage the producers and buyers to switch to the
use of a good that is environmentally friendly (Sexton, 2015). For instance, the government can
subsidize wind and solar energy to make it affordable to many consumers. Such actions reduce the use
of coal energy that causes pollution to the environment. On the graph below, the subsidy by the
government changes the equilibrium in the market for solar energy from point T to optimum social point
U.
Price
SMB
P=PMB
Quantity
S2
S=PMC=SMC
P
P2
Q Q*
P* T
U
9
Output
Graph 6: Economic loss under collusive oligopoly
Question 6
i. Subsidies
The governments usually make use of subsidies to encourage the producers and buyers to switch to the
use of a good that is environmentally friendly (Sexton, 2015). For instance, the government can
subsidize wind and solar energy to make it affordable to many consumers. Such actions reduce the use
of coal energy that causes pollution to the environment. On the graph below, the subsidy by the
government changes the equilibrium in the market for solar energy from point T to optimum social point
U.
Price
SMB
P=PMB
Quantity
S2
S=PMC=SMC
P
P2
Q Q*
P* T
U
MICROECONOMIC PRINCIPLES
10
i.
Taxation
The taxes will make the manufacturers and buyers to pay the full social cost of pollution (McTaggart,
Findlay, & Parkin, 2015). On the figure below, the imposition of taxes will make the market equilibrium
to shift from point U to point T. At point T, consumption and production are low and thus low levels of
pollution.
Secure Best Marks with AI Grader
Need help grading? Try our AI Grader for instant feedback on your assignments.
MICROECONOMIC PRINCIPLES
11
Price
Quantity
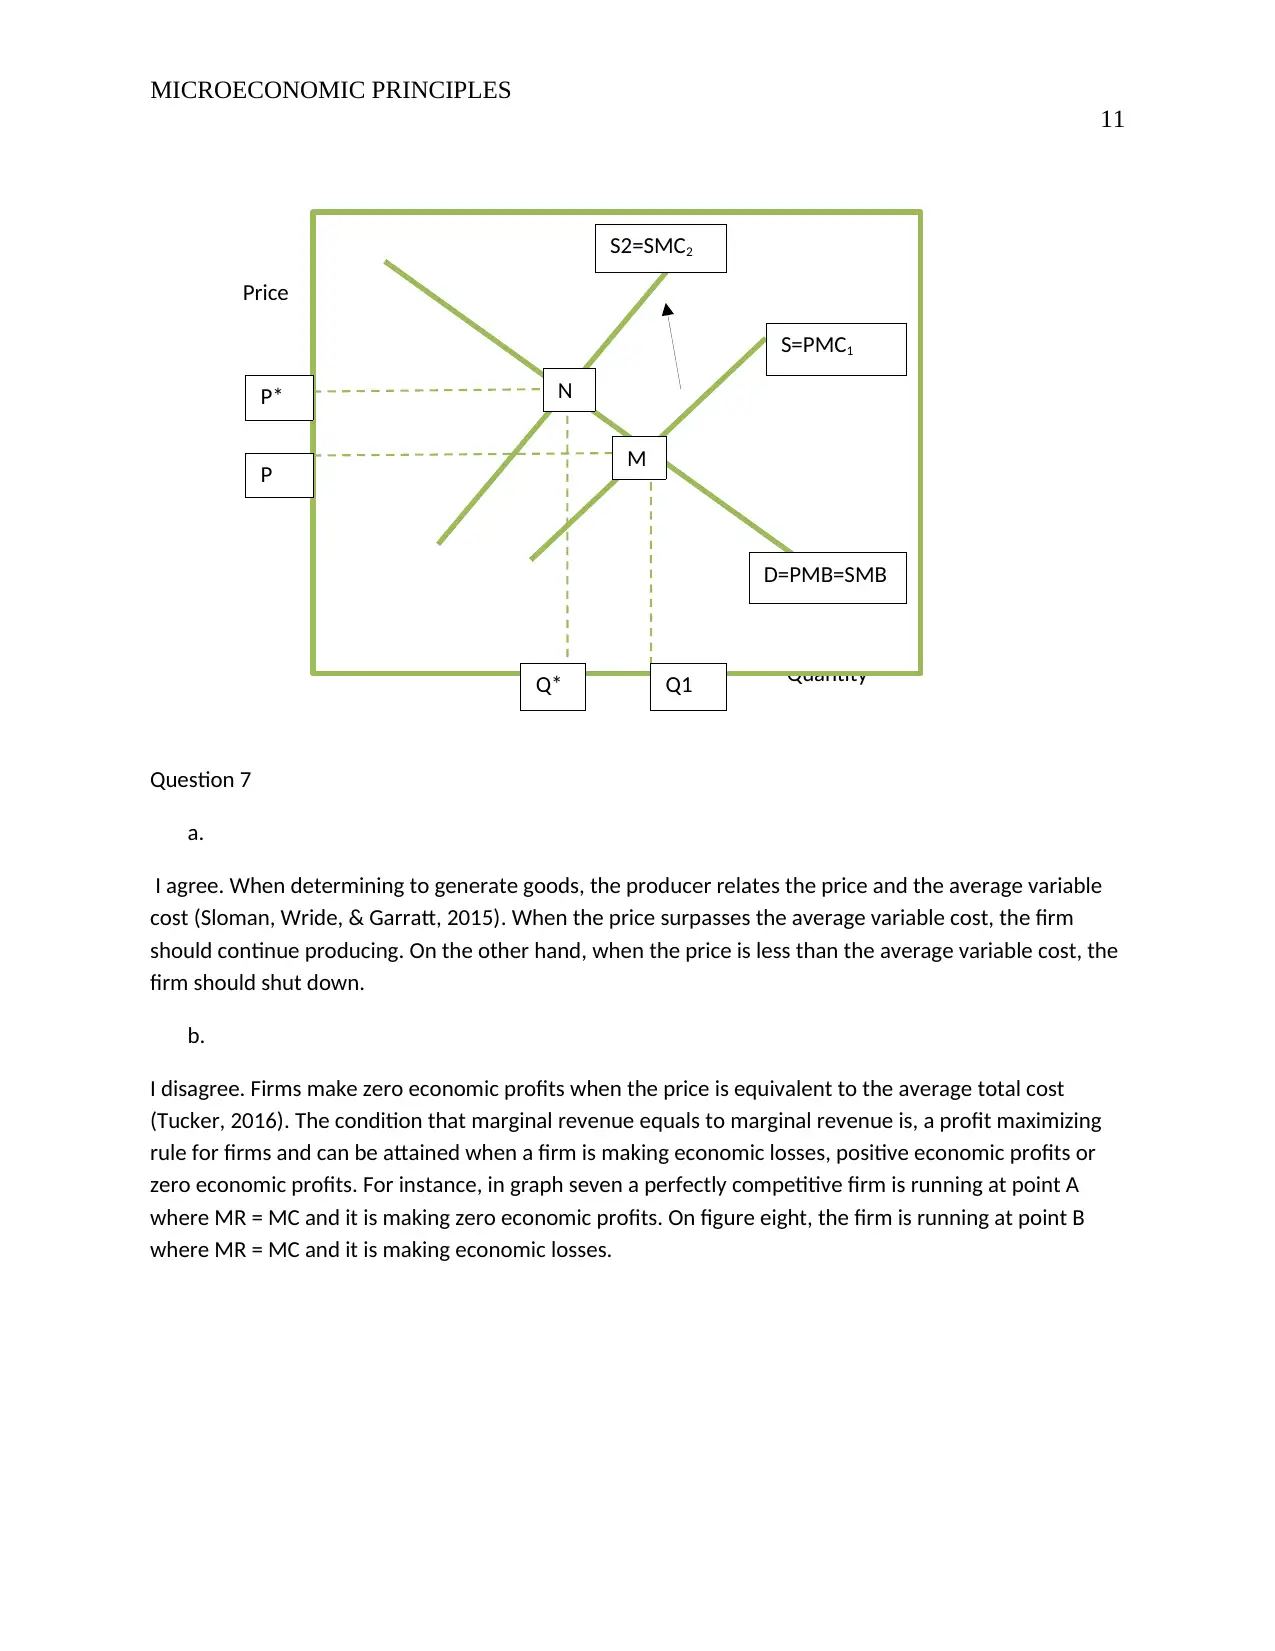
Question 7
a.
I agree. When determining to generate goods, the producer relates the price and the average variable
cost (Sloman, Wride, & Garratt, 2015). When the price surpasses the average variable cost, the firm
should continue producing. On the other hand, when the price is less than the average variable cost, the
firm should shut down.
b.
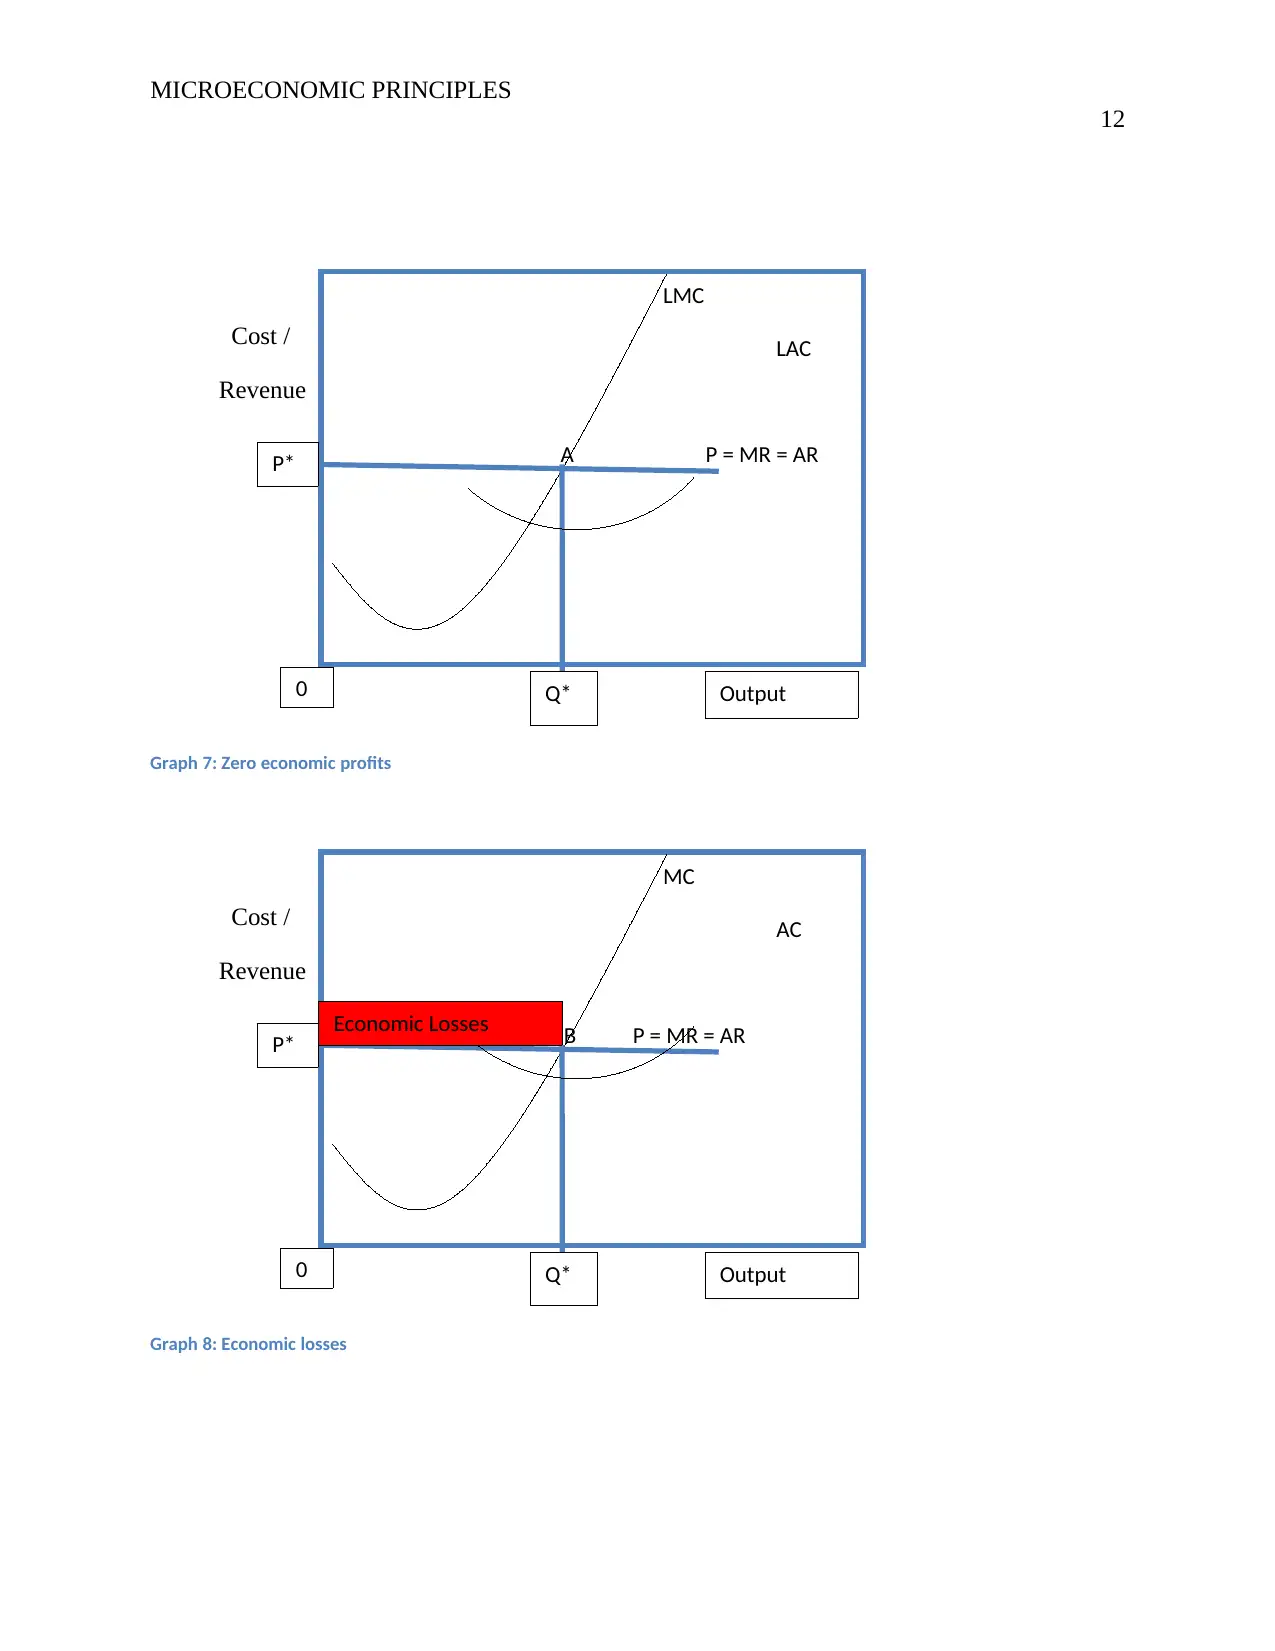
I disagree. Firms make zero economic profits when the price is equivalent to the average total cost
(Tucker, 2016). The condition that marginal revenue equals to marginal revenue is, a profit maximizing
rule for firms and can be attained when a firm is making economic losses, positive economic profits or
zero economic profits. For instance, in graph seven a perfectly competitive firm is running at point A
where MR = MC and it is making zero economic profits. On figure eight, the firm is running at point B
where MR = MC and it is making economic losses.
D=PMB=SMB
M
N
S=PMC1
S2=SMC2
P
P*
Q* Q1
11
Price
Quantity
Question 7
a.
I agree. When determining to generate goods, the producer relates the price and the average variable
cost (Sloman, Wride, & Garratt, 2015). When the price surpasses the average variable cost, the firm
should continue producing. On the other hand, when the price is less than the average variable cost, the
firm should shut down.
b.
I disagree. Firms make zero economic profits when the price is equivalent to the average total cost
(Tucker, 2016). The condition that marginal revenue equals to marginal revenue is, a profit maximizing
rule for firms and can be attained when a firm is making economic losses, positive economic profits or
zero economic profits. For instance, in graph seven a perfectly competitive firm is running at point A
where MR = MC and it is making zero economic profits. On figure eight, the firm is running at point B
where MR = MC and it is making economic losses.
D=PMB=SMB
M
N
S=PMC1
S2=SMC2
P
P*
Q* Q1
MICROECONOMIC PRINCIPLES
12
Cost /
Revenue
Graph 7: Zero economic profits
Cost /
Revenue
Graph 8: Economic losses
LMC
LAC
A P = MR = ARP*
Q*0 Output
MC
AC
B P = MR = ARP*
Q*0 Output
Economic Losses
12
Cost /
Revenue
Graph 7: Zero economic profits
Cost /
Revenue
Graph 8: Economic losses
LMC
LAC
A P = MR = ARP*
Q*0 Output
MC
AC
B P = MR = ARP*
Q*0 Output
Economic Losses
MICROECONOMIC PRINCIPLES
13
Bibliography
Arnold, R. A. (2013). Economics. Mason, Ohio: South-Western.
Deodhar, S. Y. (2013). Why I am paying more : price theory and market structures made simple.
Noida, UP : Random House India.
Frank, R. H. (2015). Microeconomics and behavior. New York, NY : McGraw-Hill Education.
Hubbard, R. G., Garnett, A., Lewis, P. E., & O'Brien, A. P. (2016). Essentials of economics (3 ed.).
Melbourne, Victoria: Pearson Australia, [2016].
Kleindl, B., Burrow, J., & Dlabay, L. R. (2016). Principles of business. Mason : South-Western
Educational Publishing.
Laibson, D., & List, J. A. (2015). Principles of (Behavioral) Economics. American Economic
Review, 105(5), 385-390.
Mankiw, N. G., & Cosgrove, S. (2014). Principles of microeconomics. Stamford, CT: Cengage
Learning.
Mankiw, N. G., Taylor, M. P., & Ncwadi, R. (2018). Microeconomics (Second ed.). Andover,
Hampshire: Centage Learning EMEA.
McTaggart, D., Findlay, C. C., & Parkin, M. (2015). Economics. Frenchs Forest, N.S.W: Pearson.
Sexton, R. L. (2015). Exploring economics. Boston, MA, USA : Cengage Learning.
Slavin, S. L. (2014). Economics (Eleventh ed.). New York, NY: McGraw-Hill Education.
Sloman, J., Wride, A., & Garratt, D. (2015). Economics (9th ed.). Harlow : Pearson.
Tucker, I. (2016). Microeconomics For Today. Australia : South-Western: Cengage Learning.
1 out of 13
Related Documents


Your All-in-One AI-Powered Toolkit for Academic Success.
+13062052269
info@desklib.com
Available 24*7 on WhatsApp / Email
![[object Object]](/_next/static/media/star-bottom.7253800d.svg)
Unlock your academic potential
© 2024 | Zucol Services PVT LTD | All rights reserved.