Microeconomics Assignment: Football Production and Market Analysis
VerifiedAdded on 2022/08/09
|9
|931
|18
Homework Assignment
AI Summary
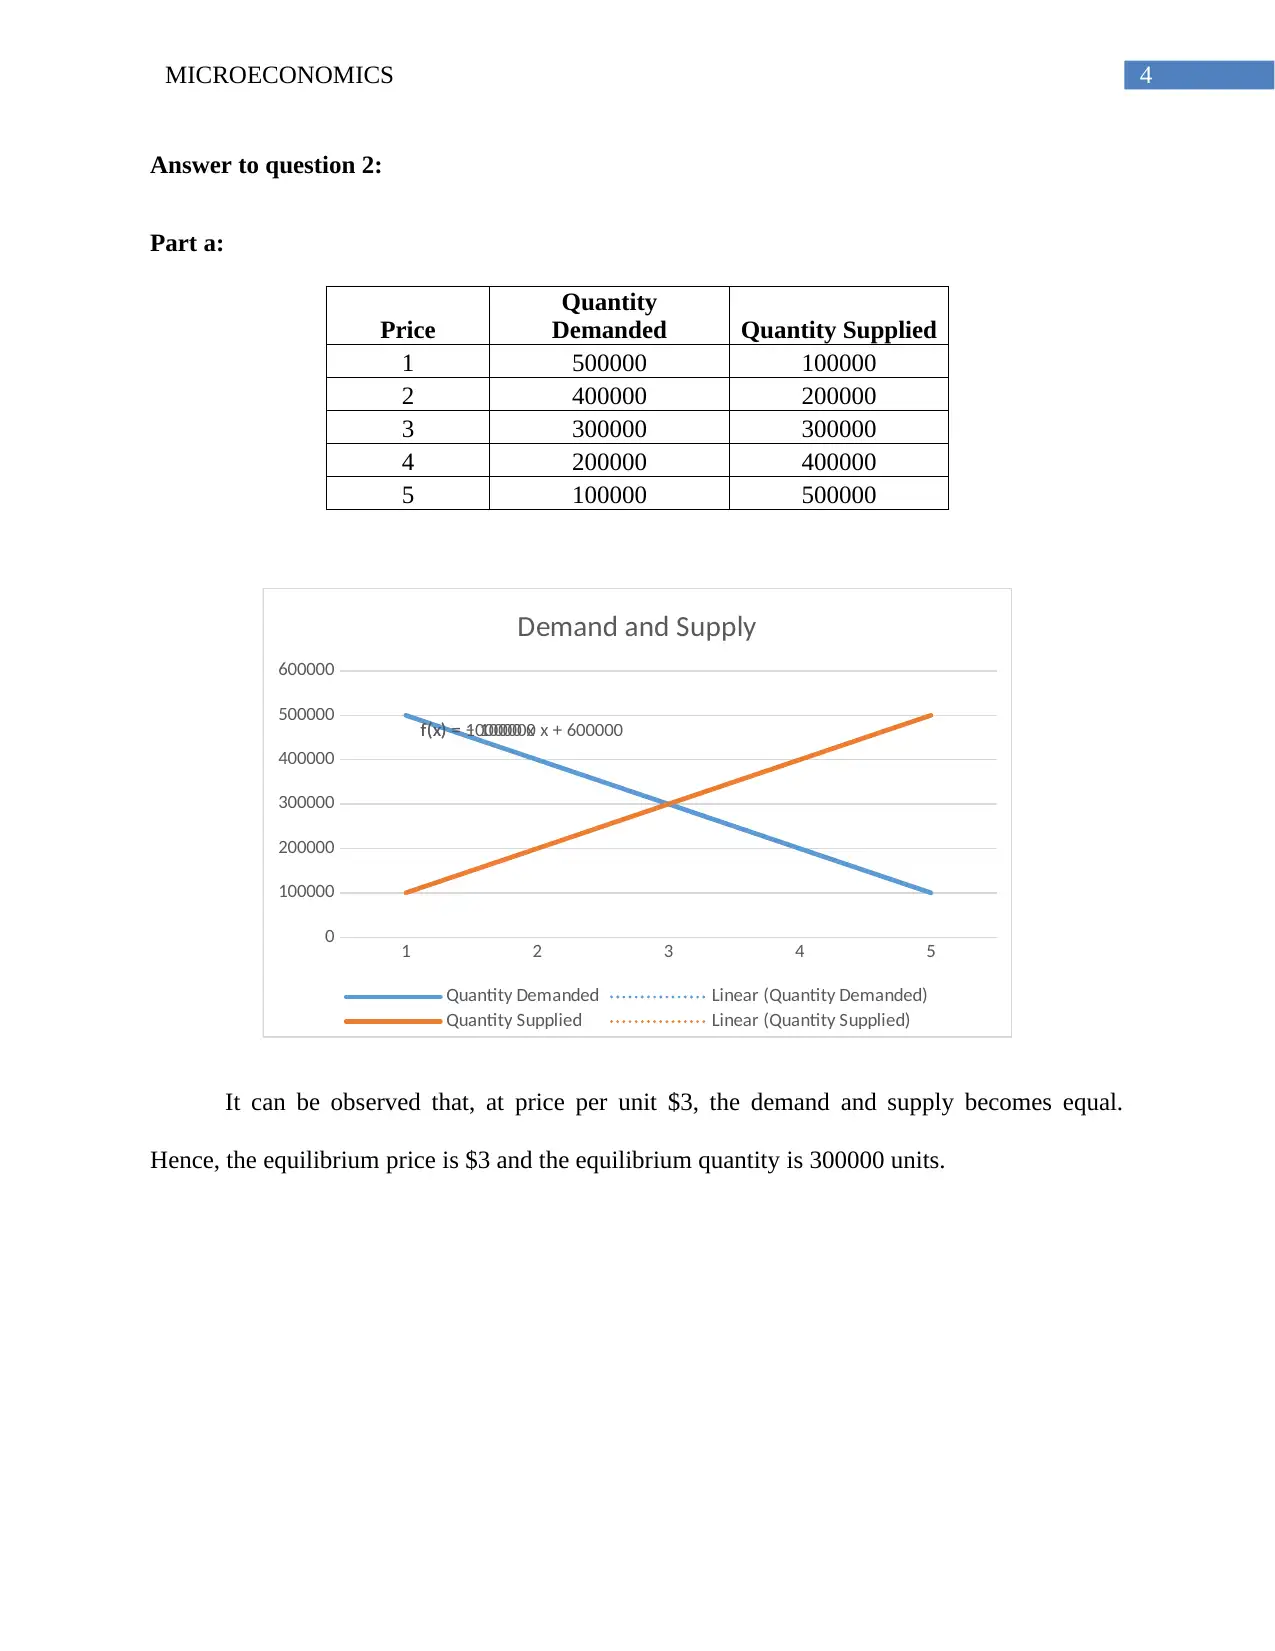
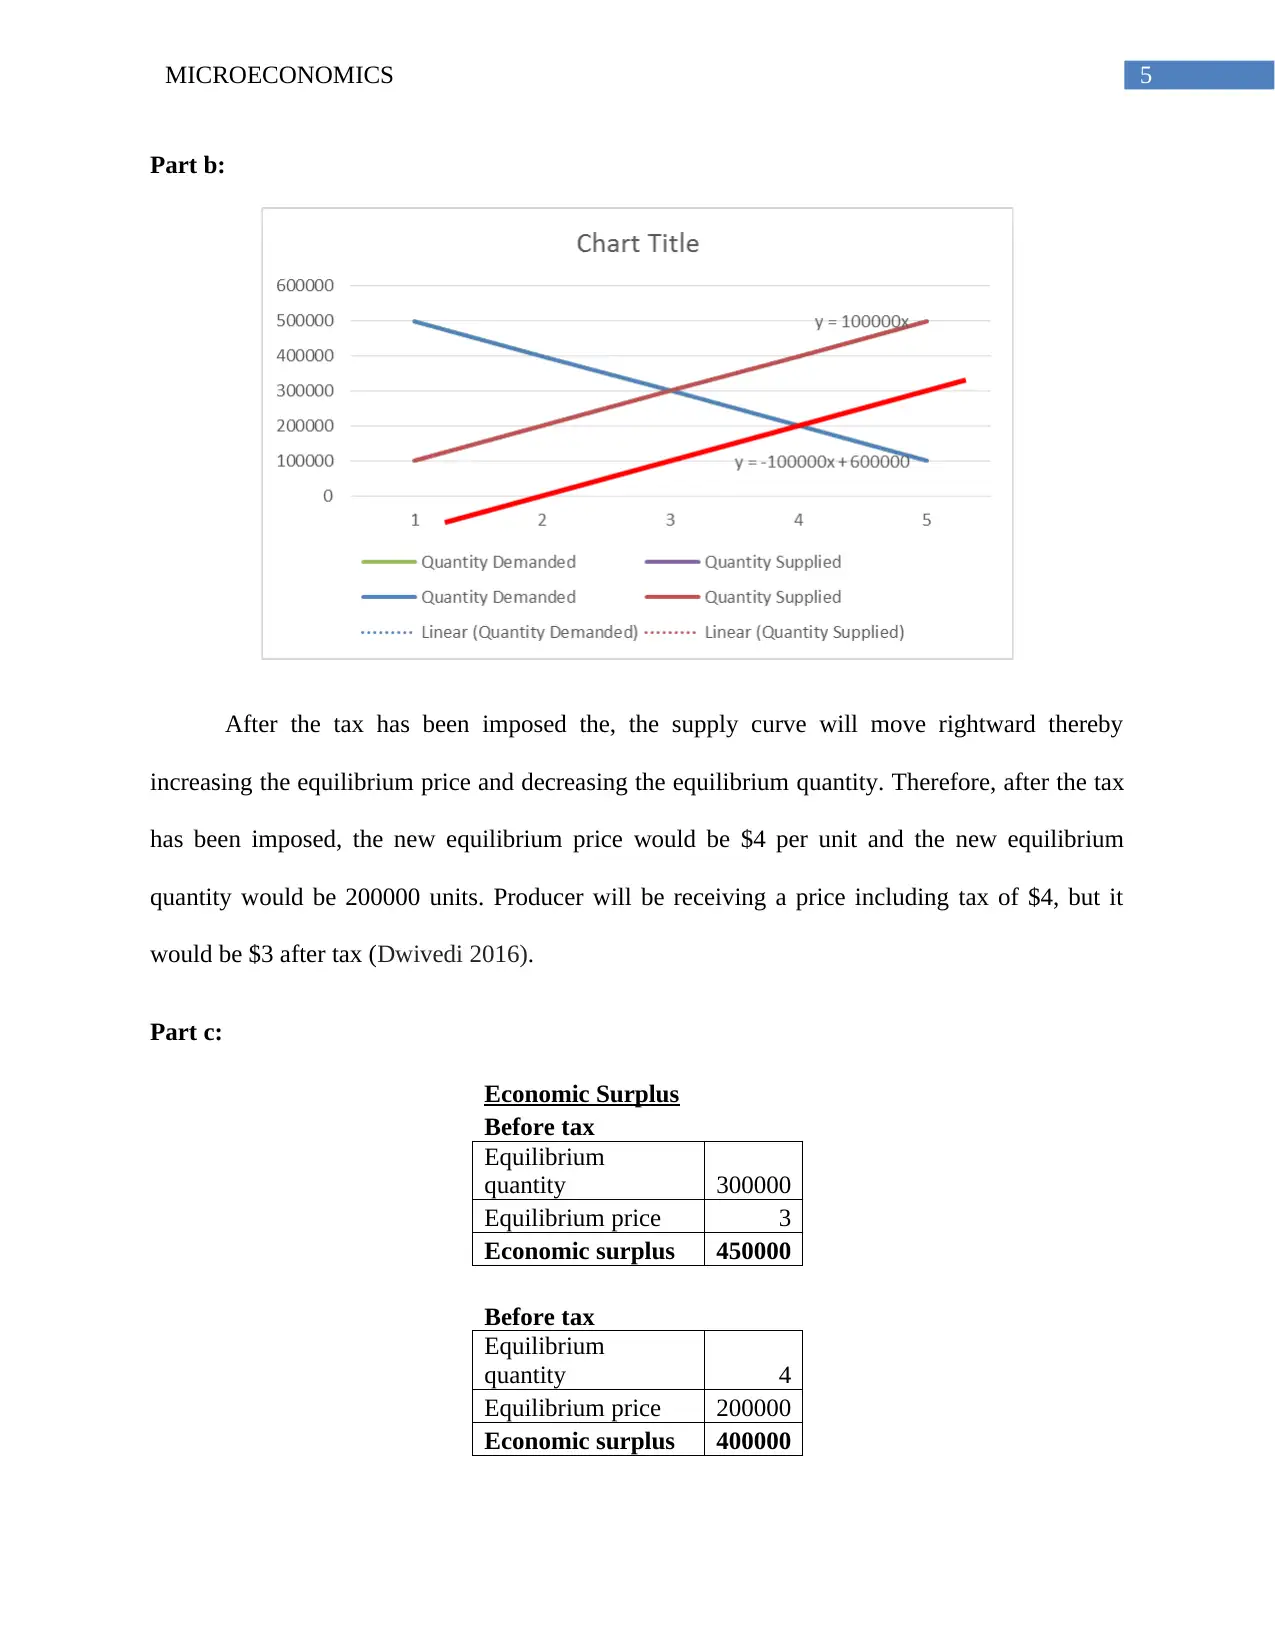
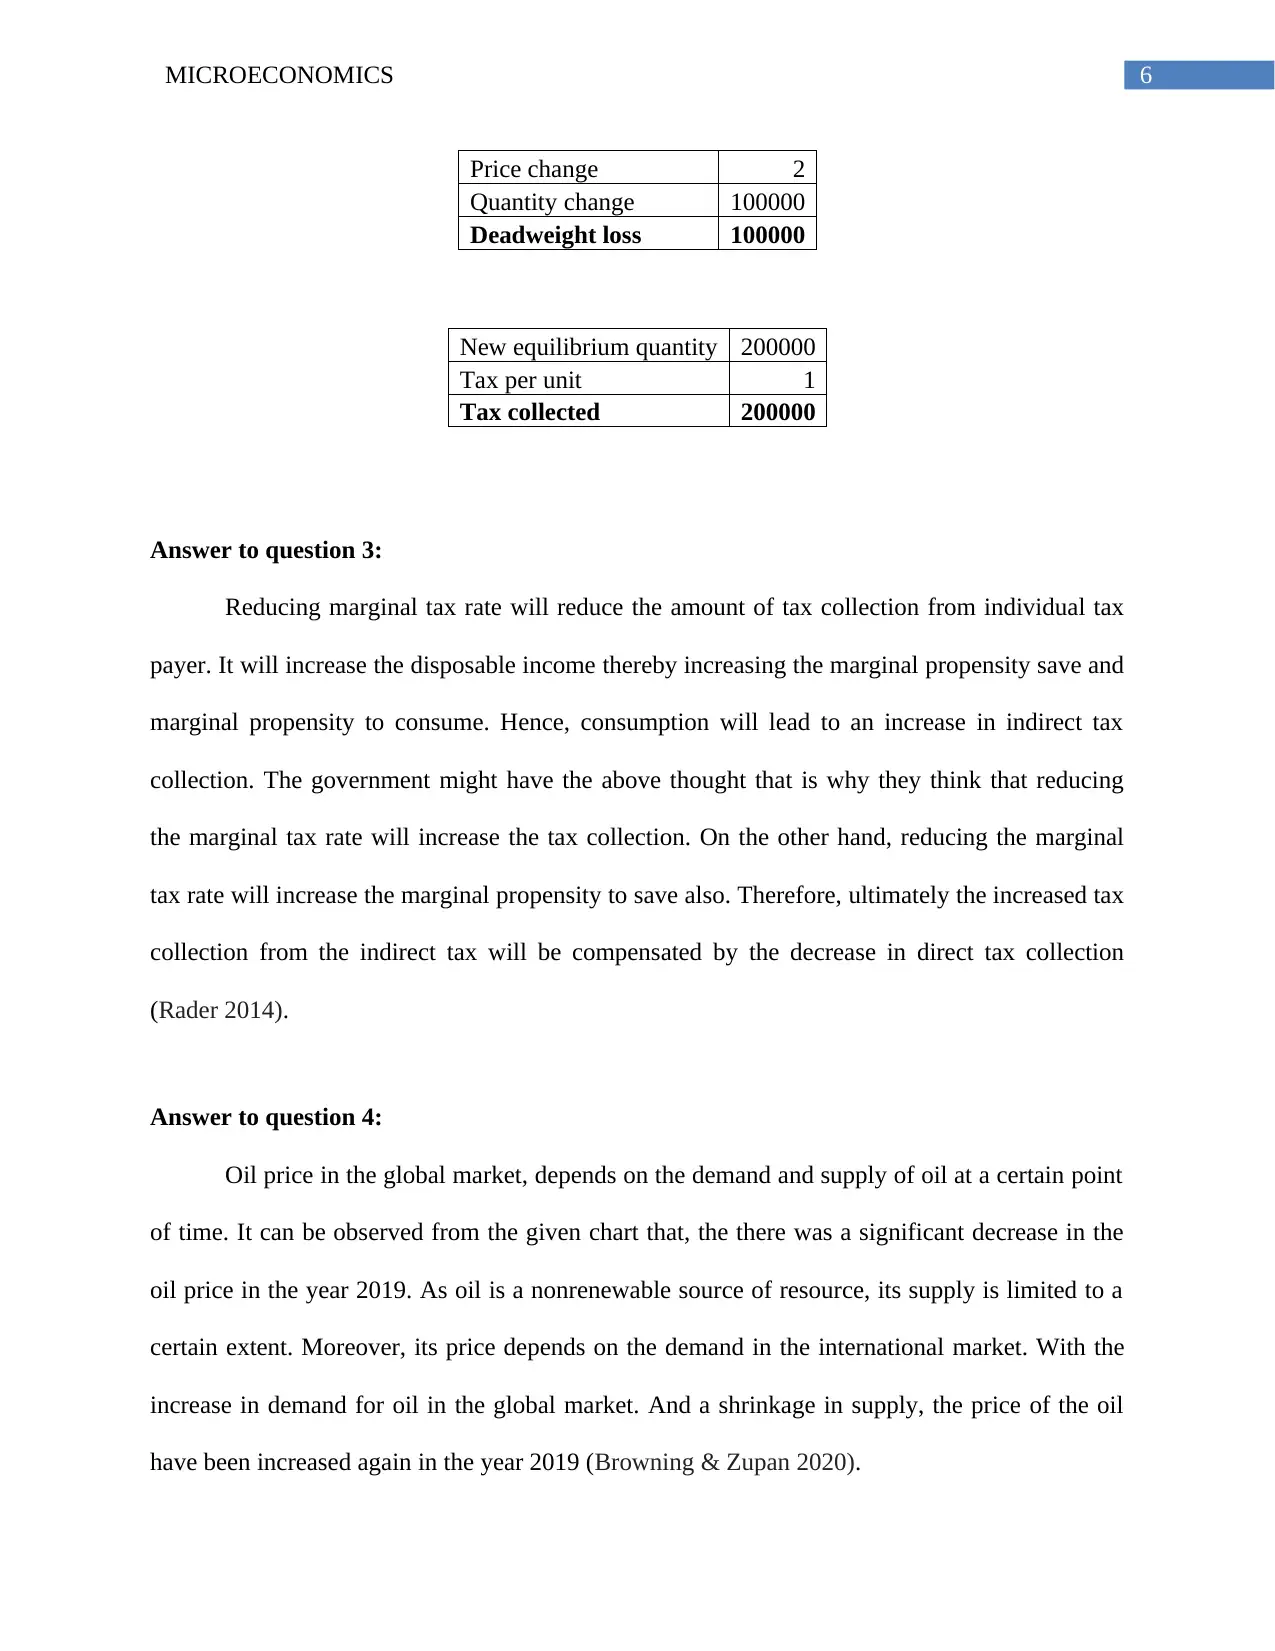
This microeconomics assignment presents a comprehensive analysis of various economic concepts. Question 1 delves into the production of souvenir footballs, calculating total, marginal, and average product, along with costs such as wages, fixed costs, variable costs, and marginal costs. Question 2 examines market equilibrium, supply and demand, and the impact of taxation, including the calculation of economic surplus and deadweight loss. Question 3 explores the effects of reducing marginal tax rates on tax collection and savings. Finally, Question 4 analyzes oil price fluctuations in the global market, considering supply and demand dynamics. The assignment incorporates relevant economic concepts and provides detailed calculations and explanations to enhance understanding.

1 out of 9
Your All-in-One AI-Powered Toolkit for Academic Success.
+13062052269
info@desklib.com
Available 24*7 on WhatsApp / Email
![[object Object]](/_next/static/media/star-bottom.7253800d.svg)
Copyright © 2020–2026 A2Z Services. All Rights Reserved. Developed and managed by ZUCOL.