Microeconomics Assignment: PPF, Market Equilibrium, and Coffee Market
VerifiedAdded on 2021/06/18
|17
|1640
|32
Homework Assignment
AI Summary
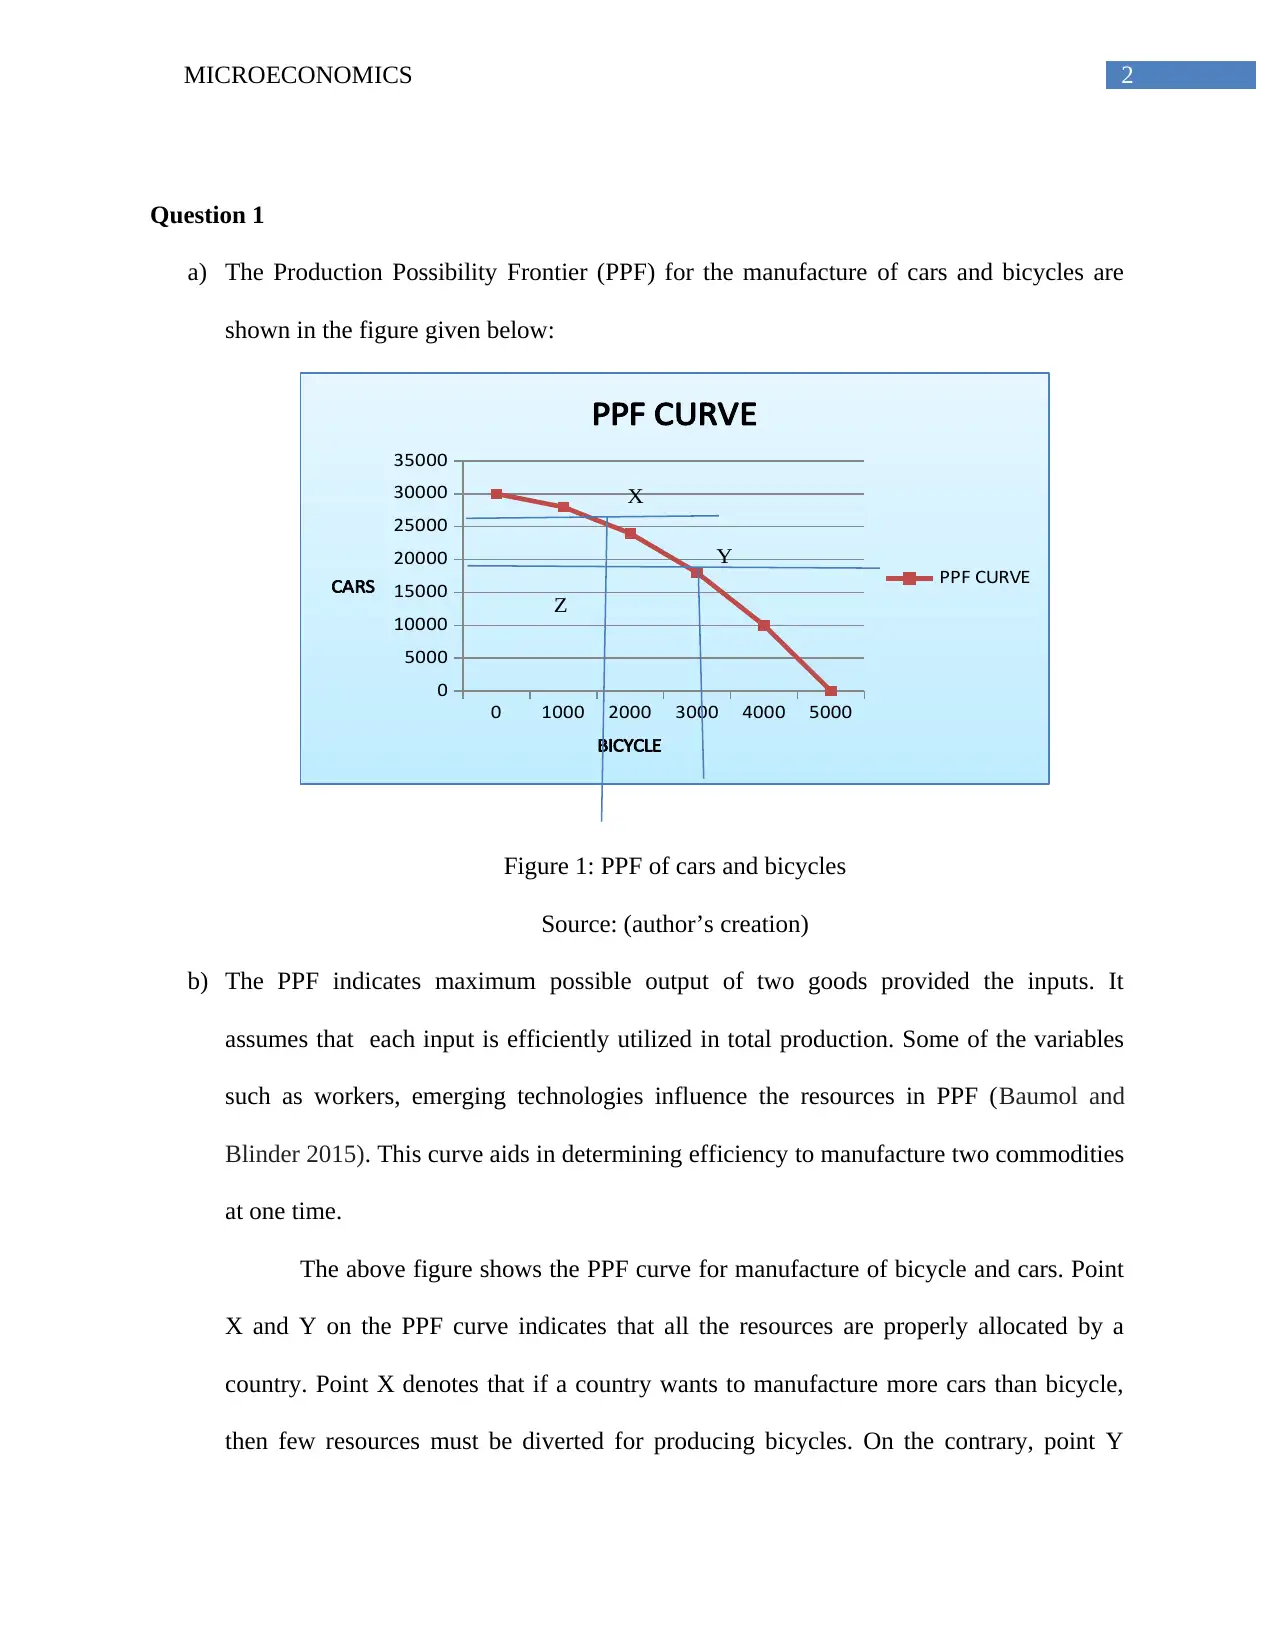
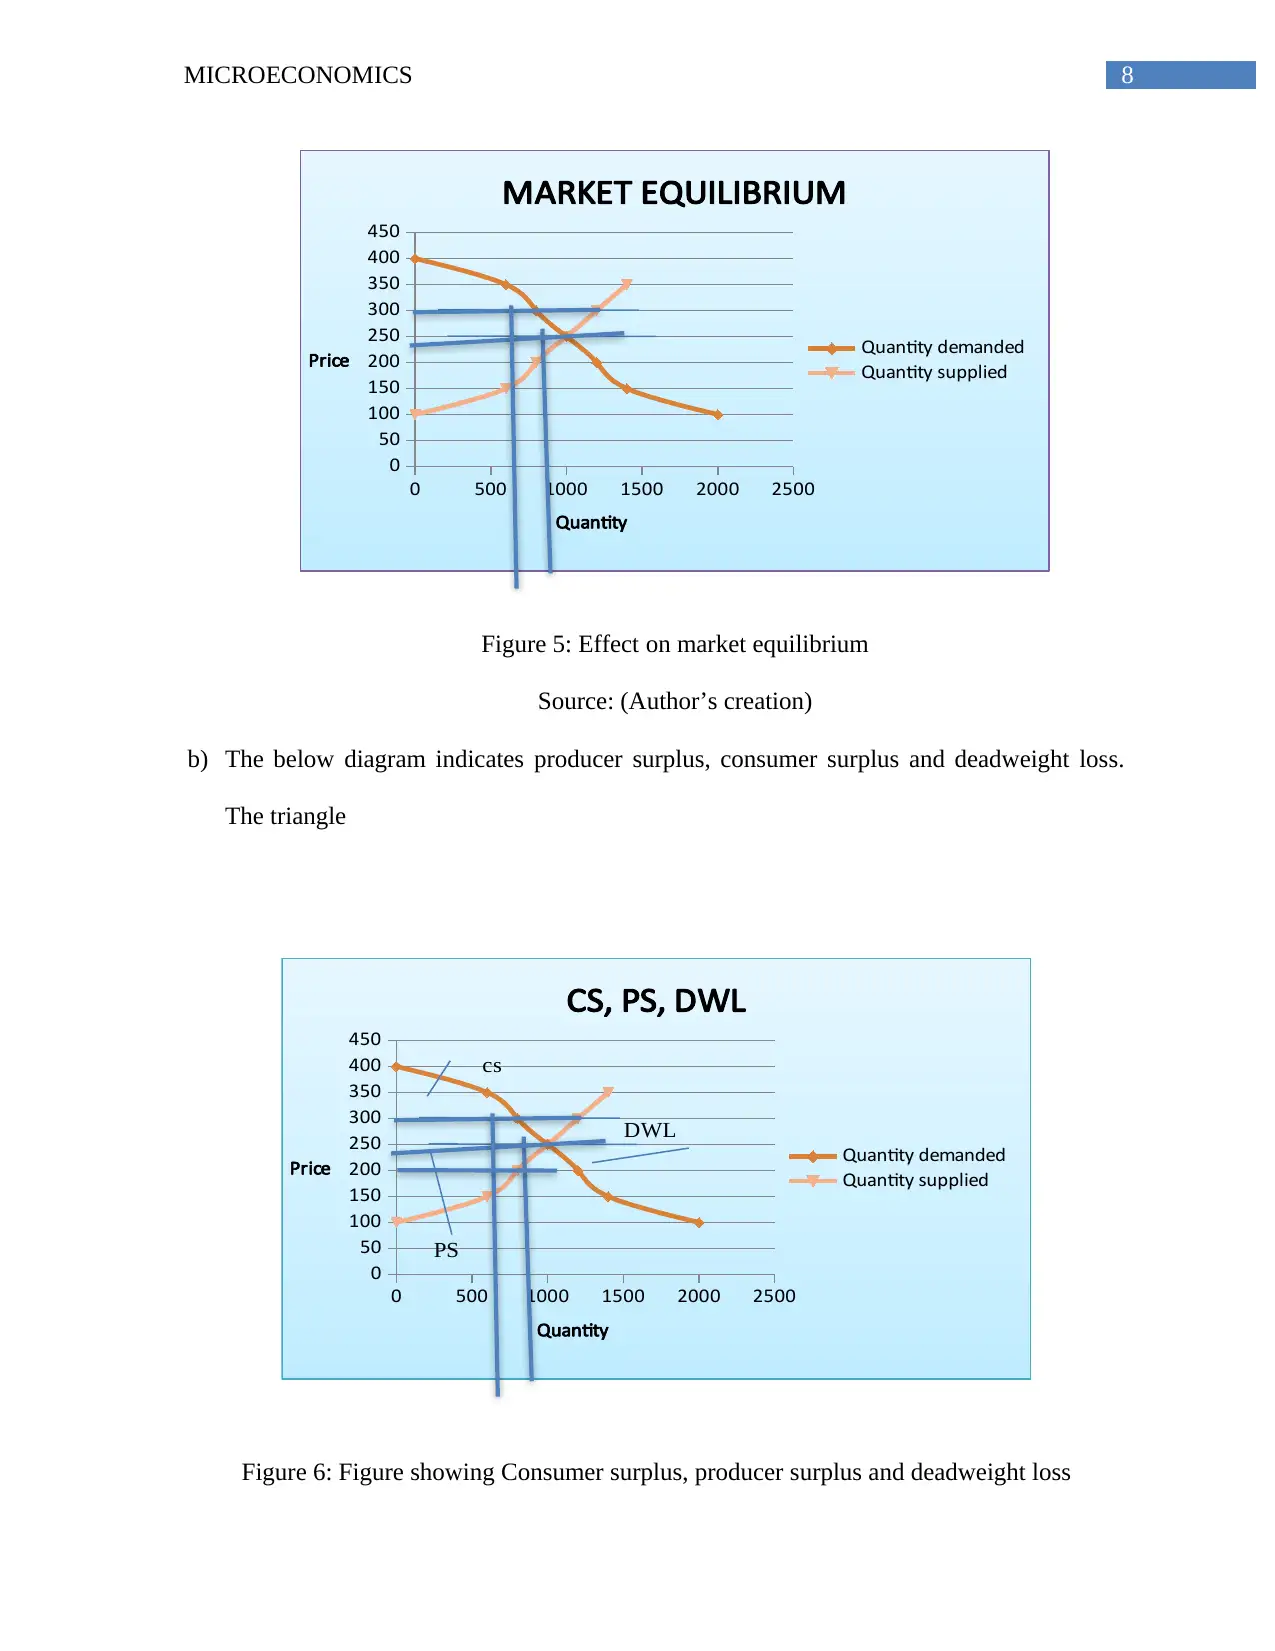
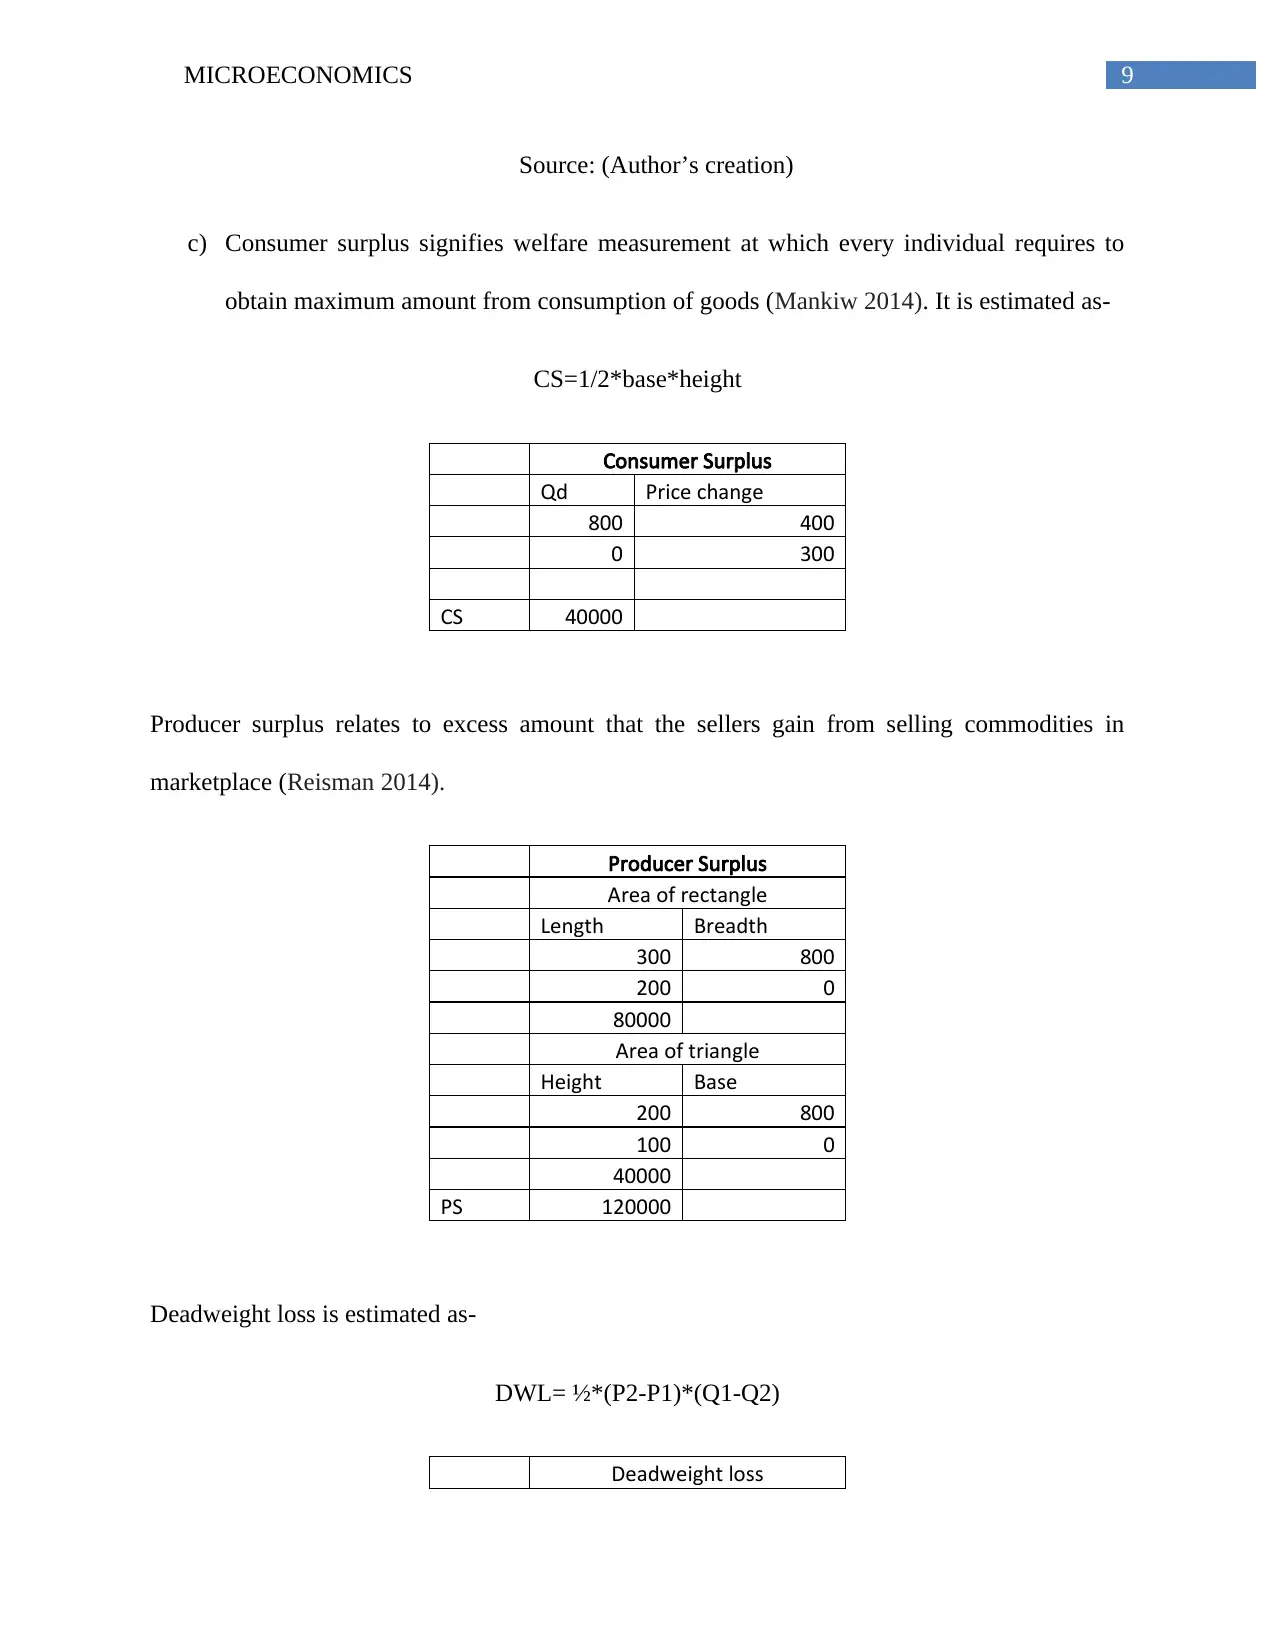
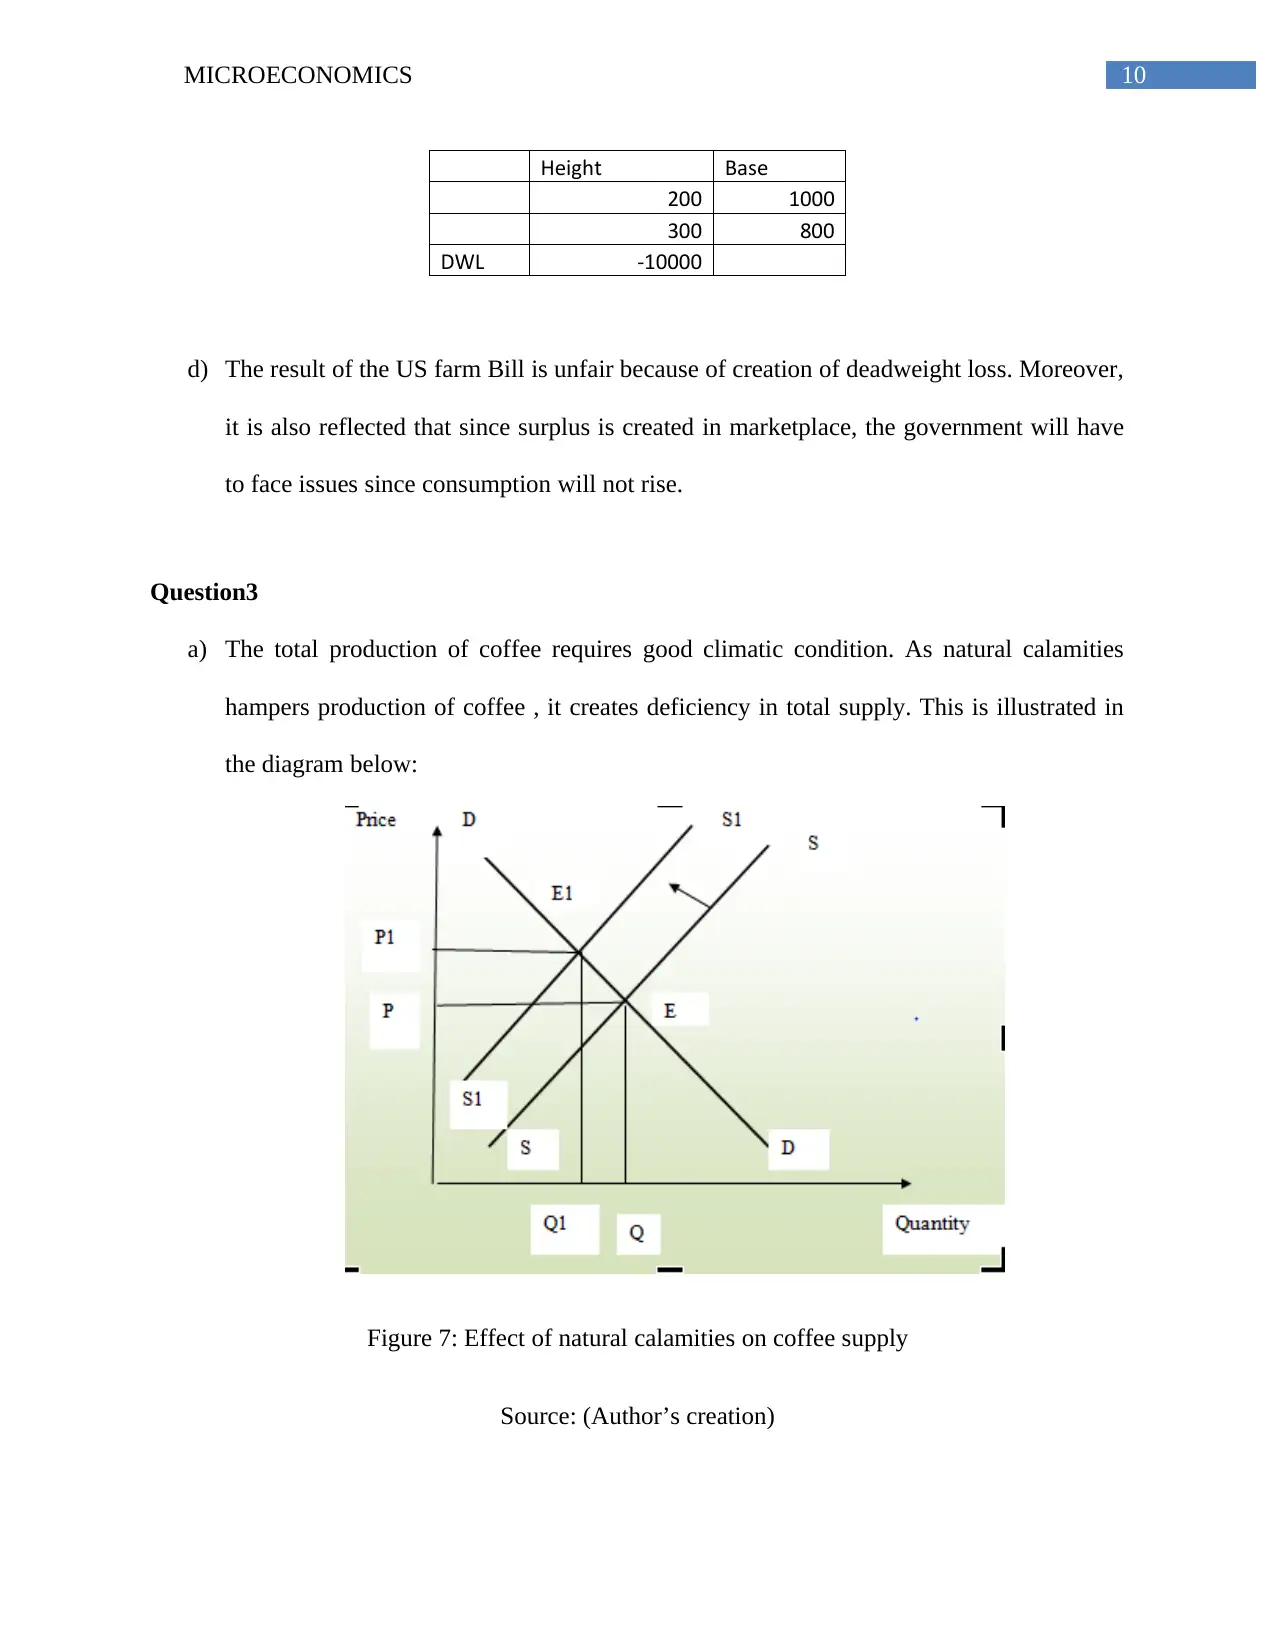
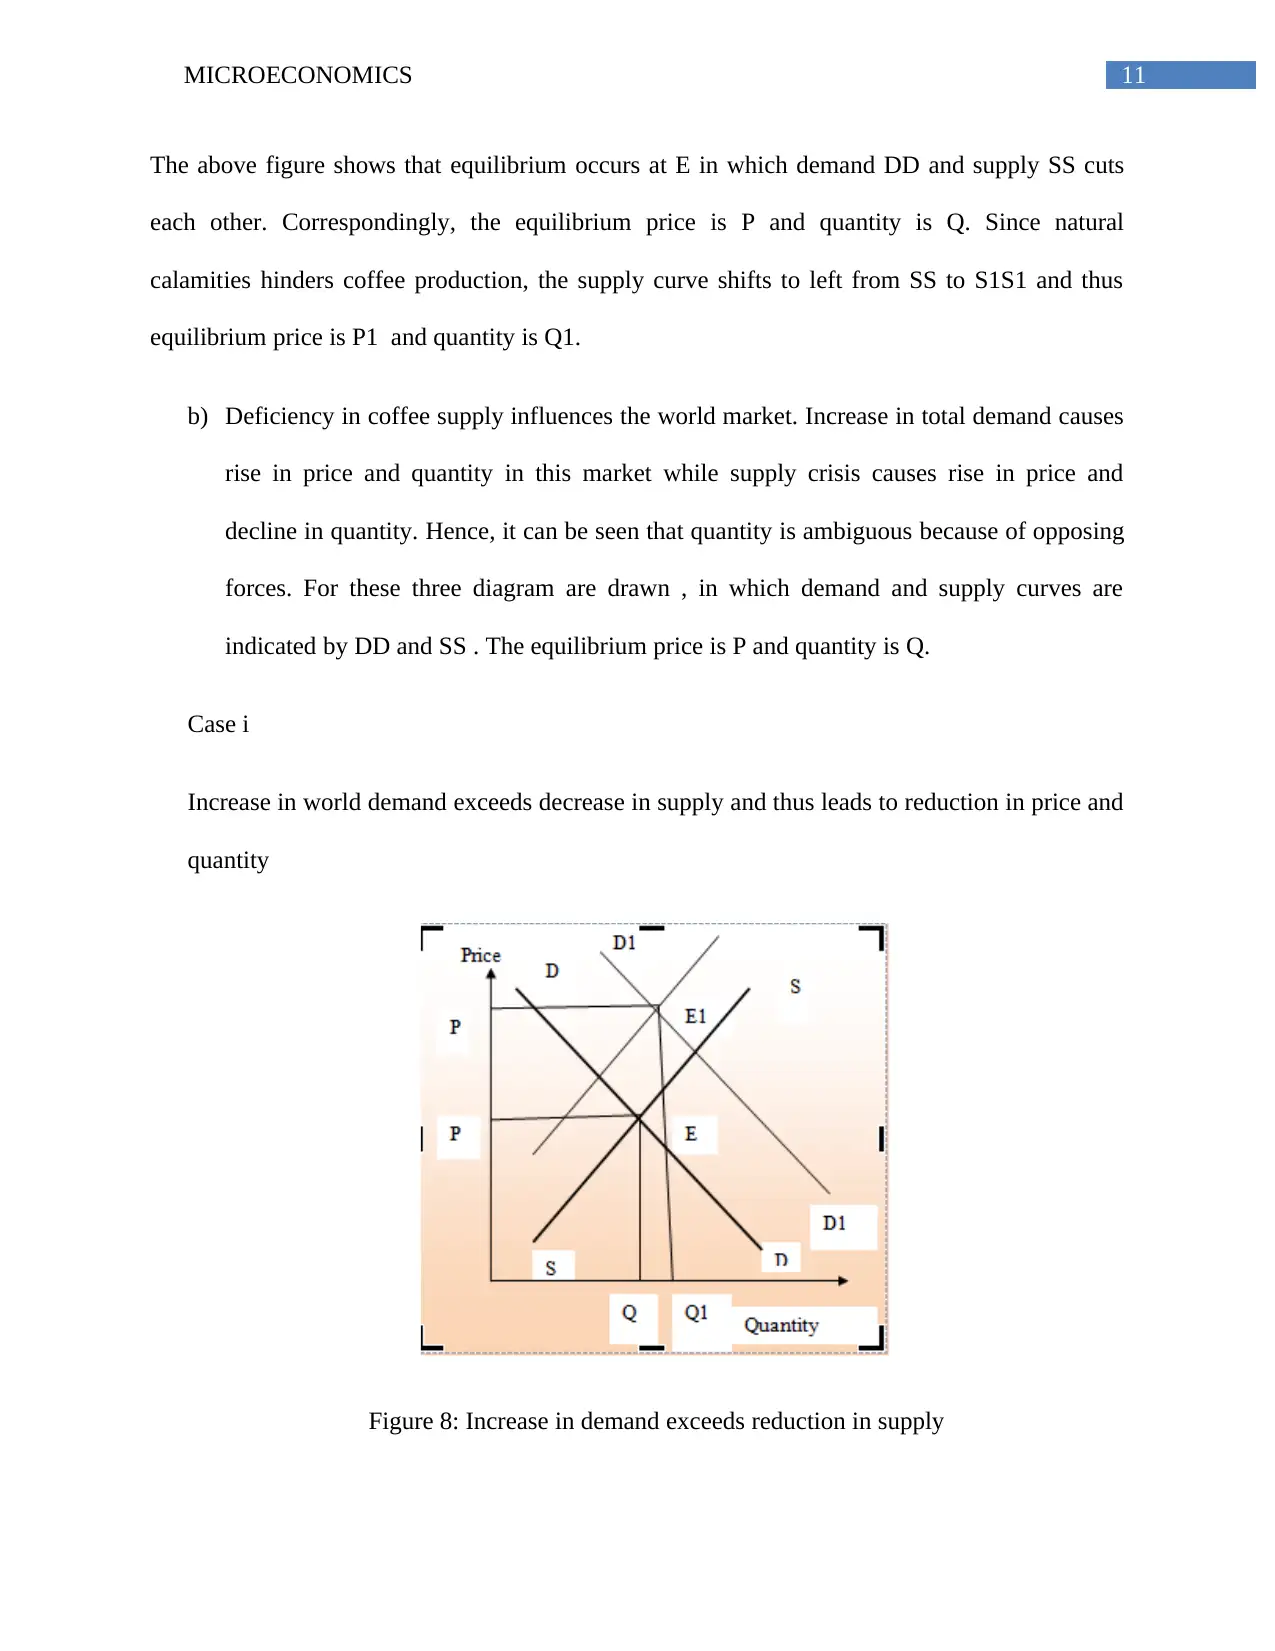
This microeconomics assignment delves into key concepts such as the Production Possibility Frontier (PPF), market equilibrium, and the impact of taxes and external factors on market dynamics. The assignment begins by illustrating the PPF for cars and bicycles, explaining its assumptions and properties, and exploring how a country can meet increased demand. The second part analyzes market equilibrium for pizza, including the effects of a tax on supply and demand, tax incidence, and the resulting deadweight loss. It also examines the impact of a domestic wheat price above market equilibrium. The final section investigates the coffee market, analyzing the effects of natural calamities on supply and demand, and exploring various scenarios where changes in supply and demand affect equilibrium price and quantity. The assignment utilizes diagrams and economic principles to illustrate these concepts, making it a comprehensive resource for students studying microeconomics.
1 out of 17
Related Documents


Your All-in-One AI-Powered Toolkit for Academic Success.
+13062052269
info@desklib.com
Available 24*7 on WhatsApp / Email
![[object Object]](/_next/static/media/star-bottom.7253800d.svg)
Copyright © 2020–2026 A2Z Services. All Rights Reserved. Developed and managed by ZUCOL.