BUSS102 Microeconomics: Problem-Solving Assignment Analysis
VerifiedAdded on 2022/08/23
|12
|1548
|16
Homework Assignment
AI Summary
This document provides a detailed solution to a microeconomics assignment, addressing two key questions. The first question analyzes a demand schedule for computer chips, calculating total revenue changes with price fluctuations, determining price elasticity of demand, and examining income ela...
Running head: MICROECONOMICS
MICROECONOMICS
Name of Student:
Name of University:
Author Note:
MICROECONOMICS
Name of Student:
Name of University:
Author Note:
Paraphrase This Document
Need a fresh take? Get an instant paraphrase of this document with our AI Paraphraser
1MICROECONOMICS
Table of Contents
Answer to Question: 1.....................................................................................................................2
Answer to Part (a)........................................................................................................................2
Answer to Part (b)........................................................................................................................2
Answer to Part (c)........................................................................................................................3
Answer to Part (d)........................................................................................................................4
Answer to Part (e)........................................................................................................................4
Answer to Question: 2.....................................................................................................................7
Answer to Part (a)........................................................................................................................7
Answer to Part (b)........................................................................................................................8
Answer to Part (c)........................................................................................................................9
Reference List................................................................................................................................11
2MICROECONOMICS
Answer to Question: 1
Answer to Part (a)
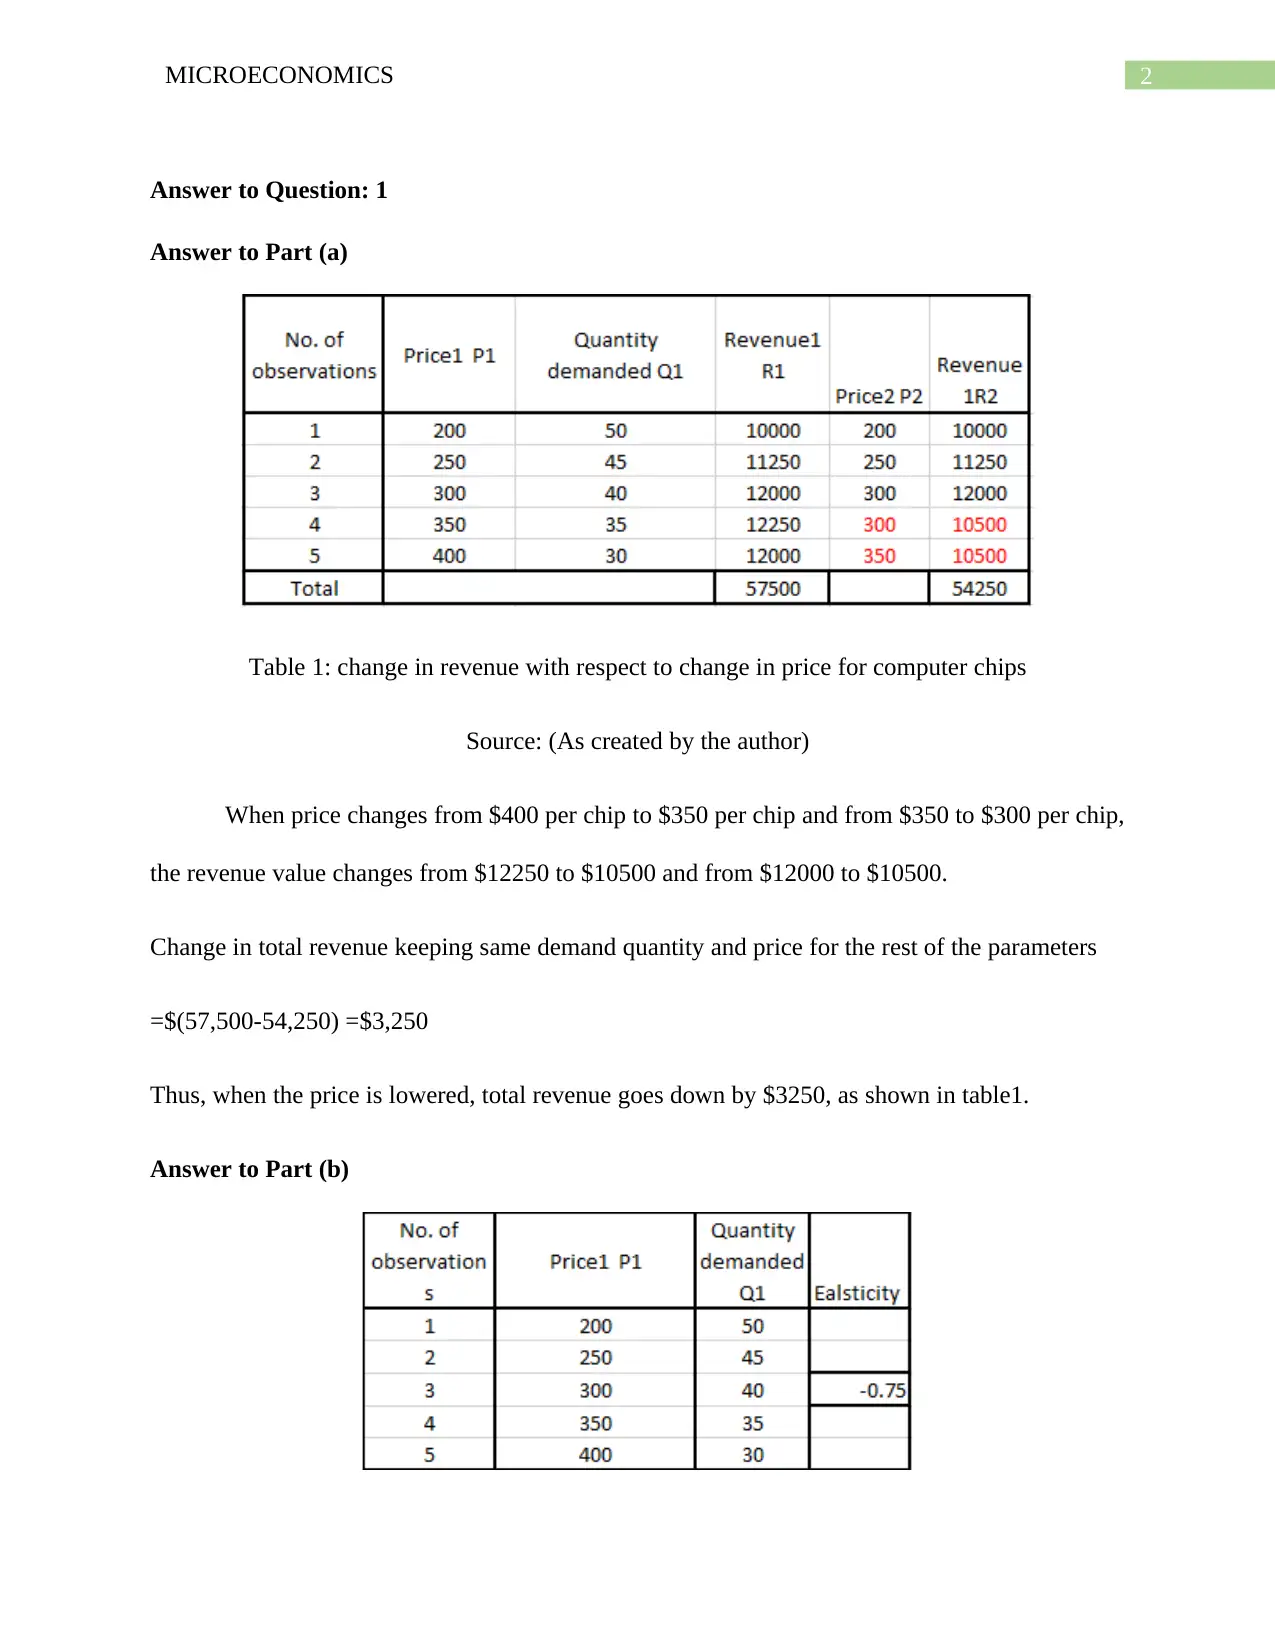
Table 1: change in revenue with respect to change in price for computer chips
Source: (As created by the author)
When price changes from $400 per chip to $350 per chip and from $350 to $300 per chip,
the revenue value changes from $12250 to $10500 and from $12000 to $10500.
Change in total revenue keeping same demand quantity and price for the rest of the parameters
=$(57,500-54,250) =$3,250
Thus, when the price is lowered, total revenue goes down by $3250, as shown in table1.
Answer to Part (b)
Answer to Question: 1
Answer to Part (a)
Table 1: change in revenue with respect to change in price for computer chips
Source: (As created by the author)
When price changes from $400 per chip to $350 per chip and from $350 to $300 per chip,
the revenue value changes from $12250 to $10500 and from $12000 to $10500.
Change in total revenue keeping same demand quantity and price for the rest of the parameters
=$(57,500-54,250) =$3,250
Thus, when the price is lowered, total revenue goes down by $3250, as shown in table1.
Answer to Part (b)
You're viewing a preview
Unlock full access by subscribing today!


3MICROECONOMICS
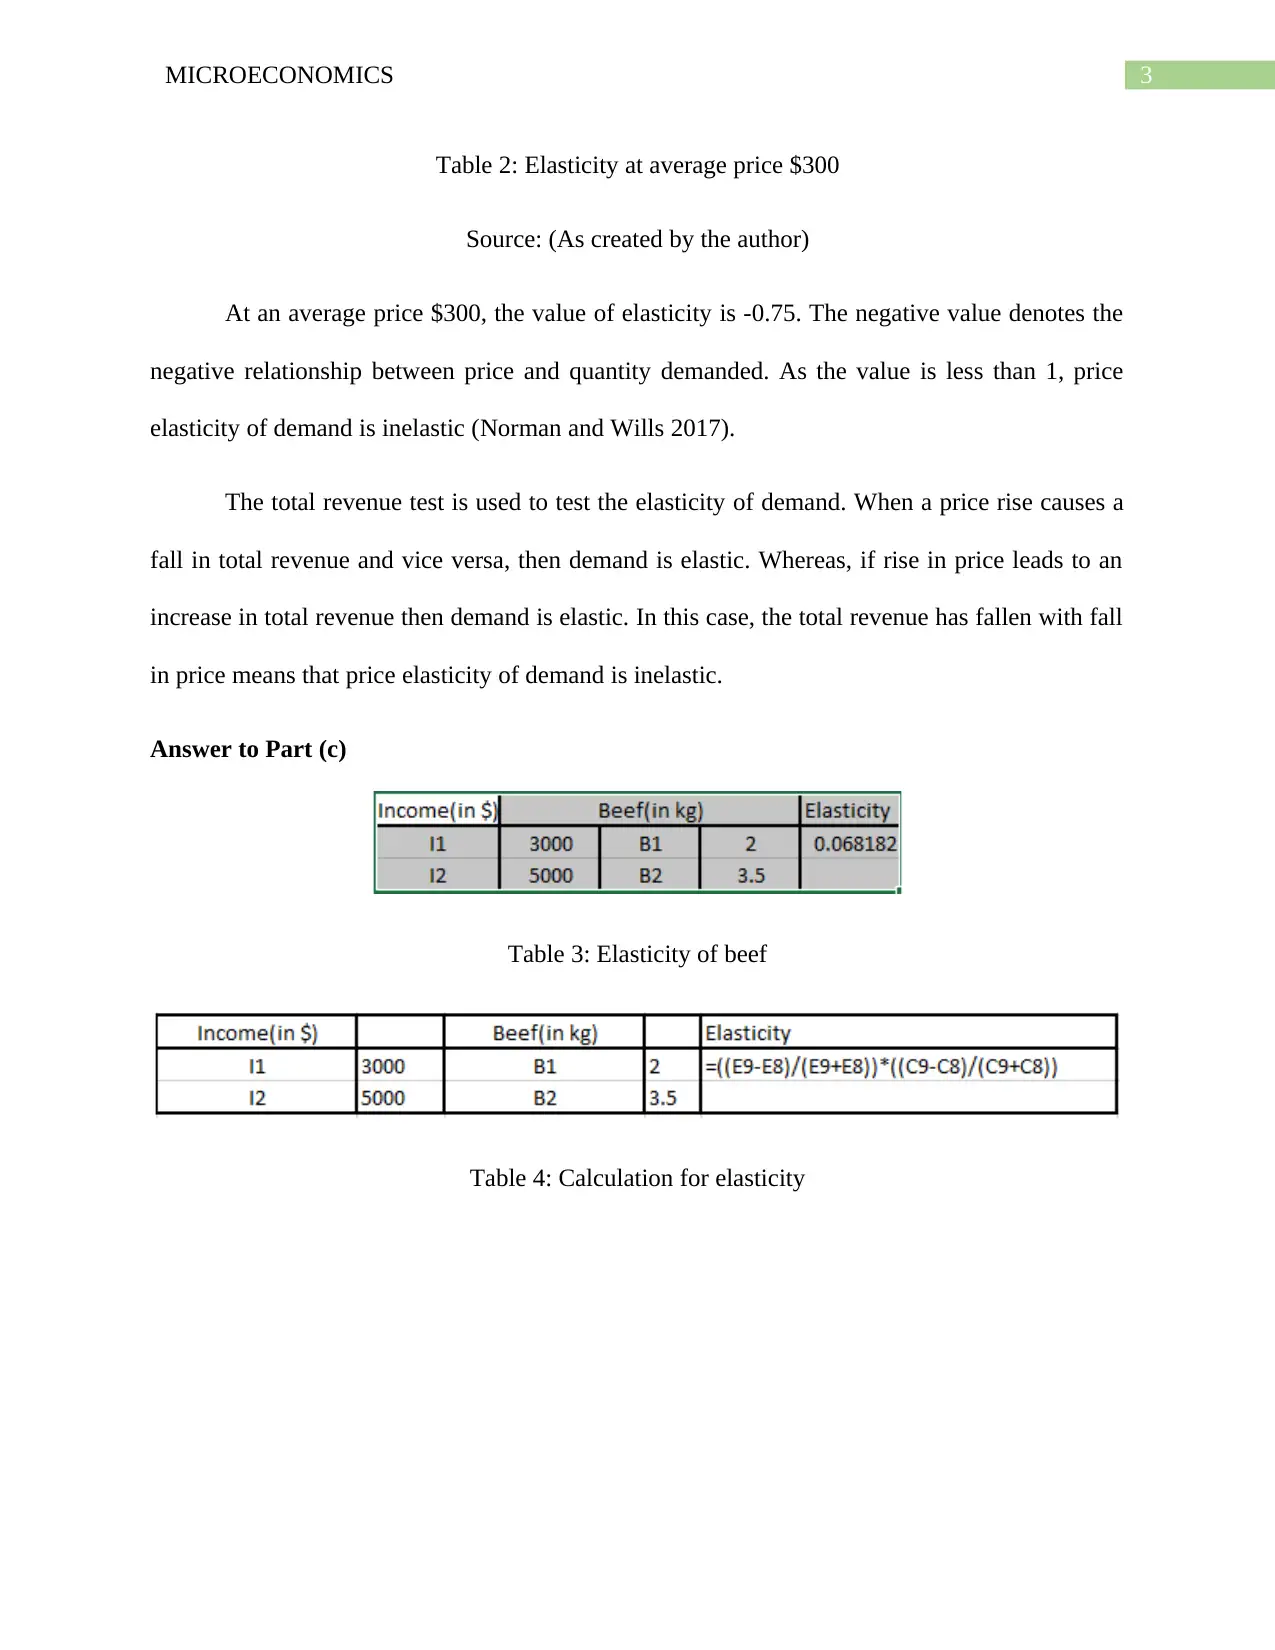
Table 2: Elasticity at average price $300
Source: (As created by the author)
At an average price $300, the value of elasticity is -0.75. The negative value denotes the
negative relationship between price and quantity demanded. As the value is less than 1, price
elasticity of demand is inelastic (Norman and Wills 2017).
The total revenue test is used to test the elasticity of demand. When a price rise causes a
fall in total revenue and vice versa, then demand is elastic. Whereas, if rise in price leads to an
increase in total revenue then demand is elastic. In this case, the total revenue has fallen with fall
in price means that price elasticity of demand is inelastic.
Answer to Part (c)
Table 3: Elasticity of beef
Table 4: Calculation for elasticity
Paraphrase This Document
Need a fresh take? Get an instant paraphrase of this document with our AI Paraphraser
4MICROECONOMICS
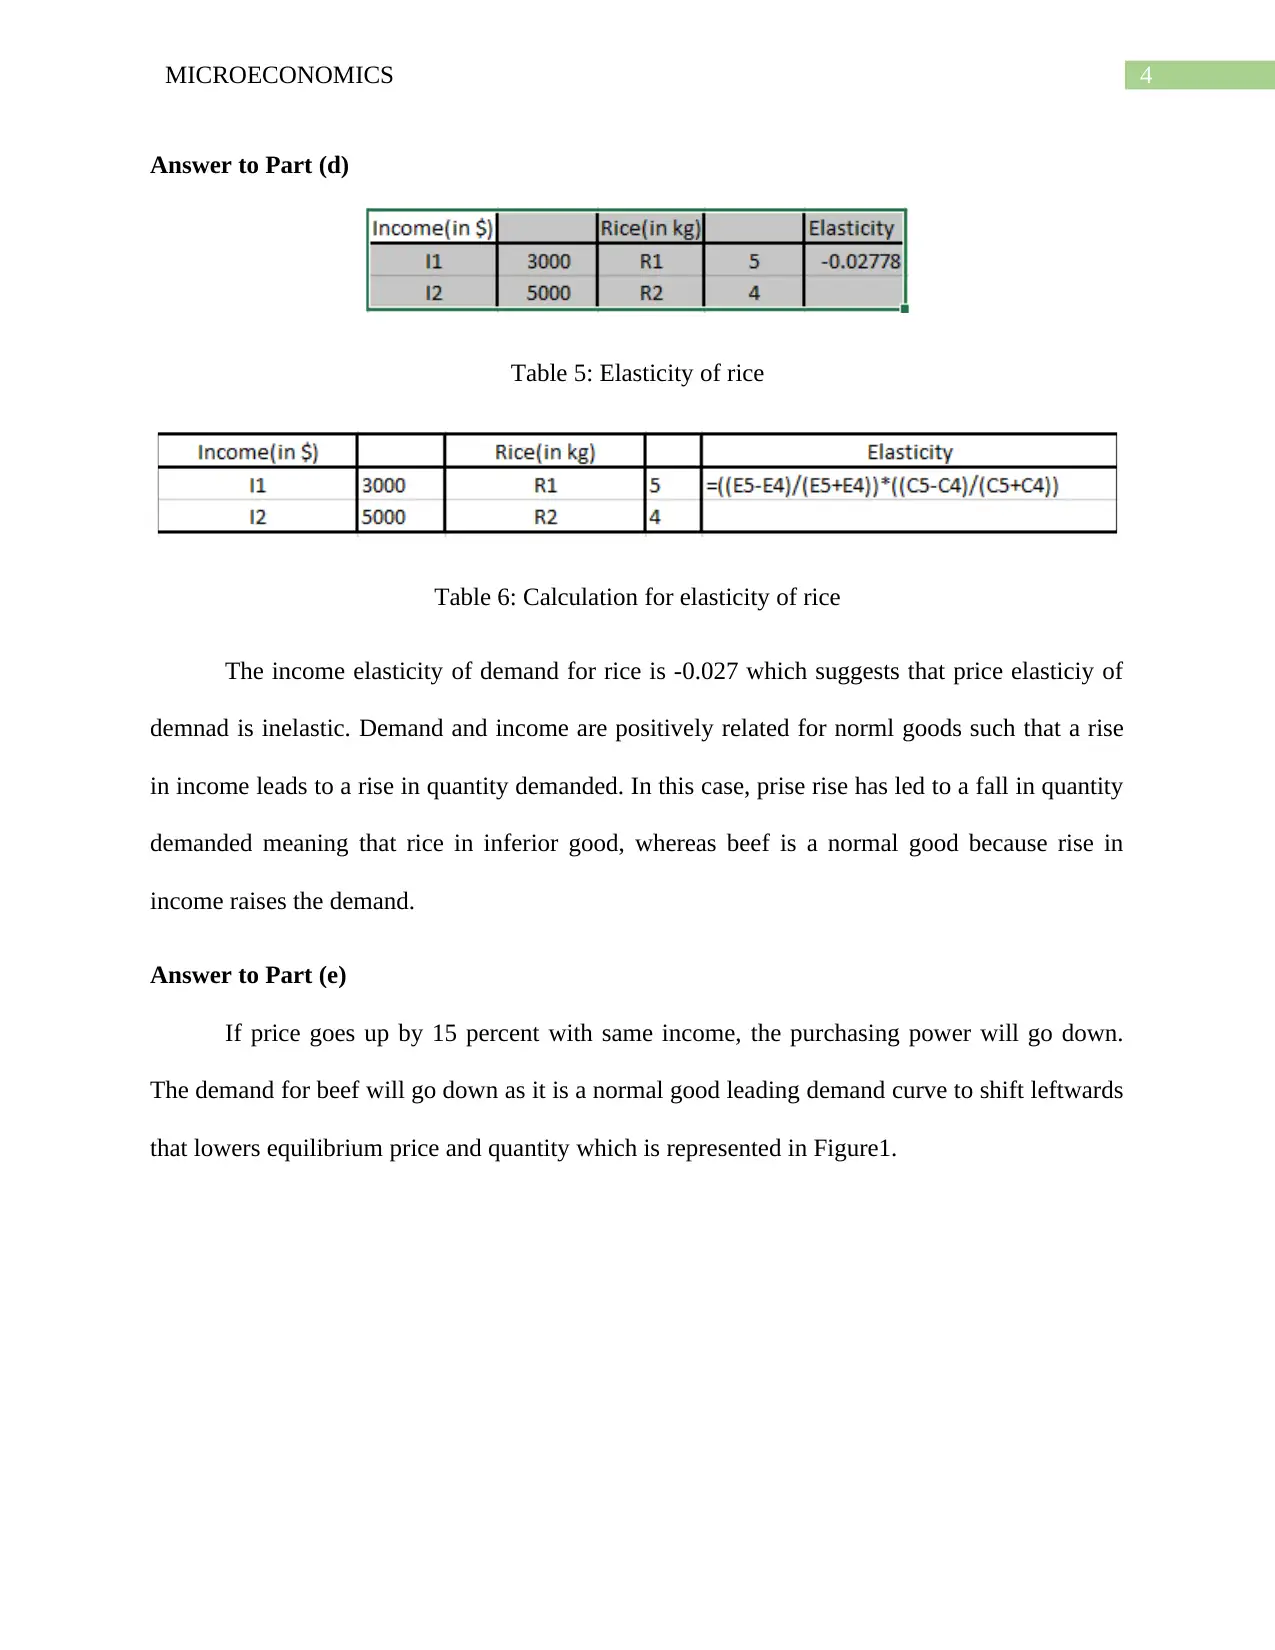
Answer to Part (d)
Table 5: Elasticity of rice
Table 6: Calculation for elasticity of rice
The income elasticity of demand for rice is -0.027 which suggests that price elasticiy of
demnad is inelastic. Demand and income are positively related for norml goods such that a rise
in income leads to a rise in quantity demanded. In this case, prise rise has led to a fall in quantity
demanded meaning that rice in inferior good, whereas beef is a normal good because rise in
income raises the demand.
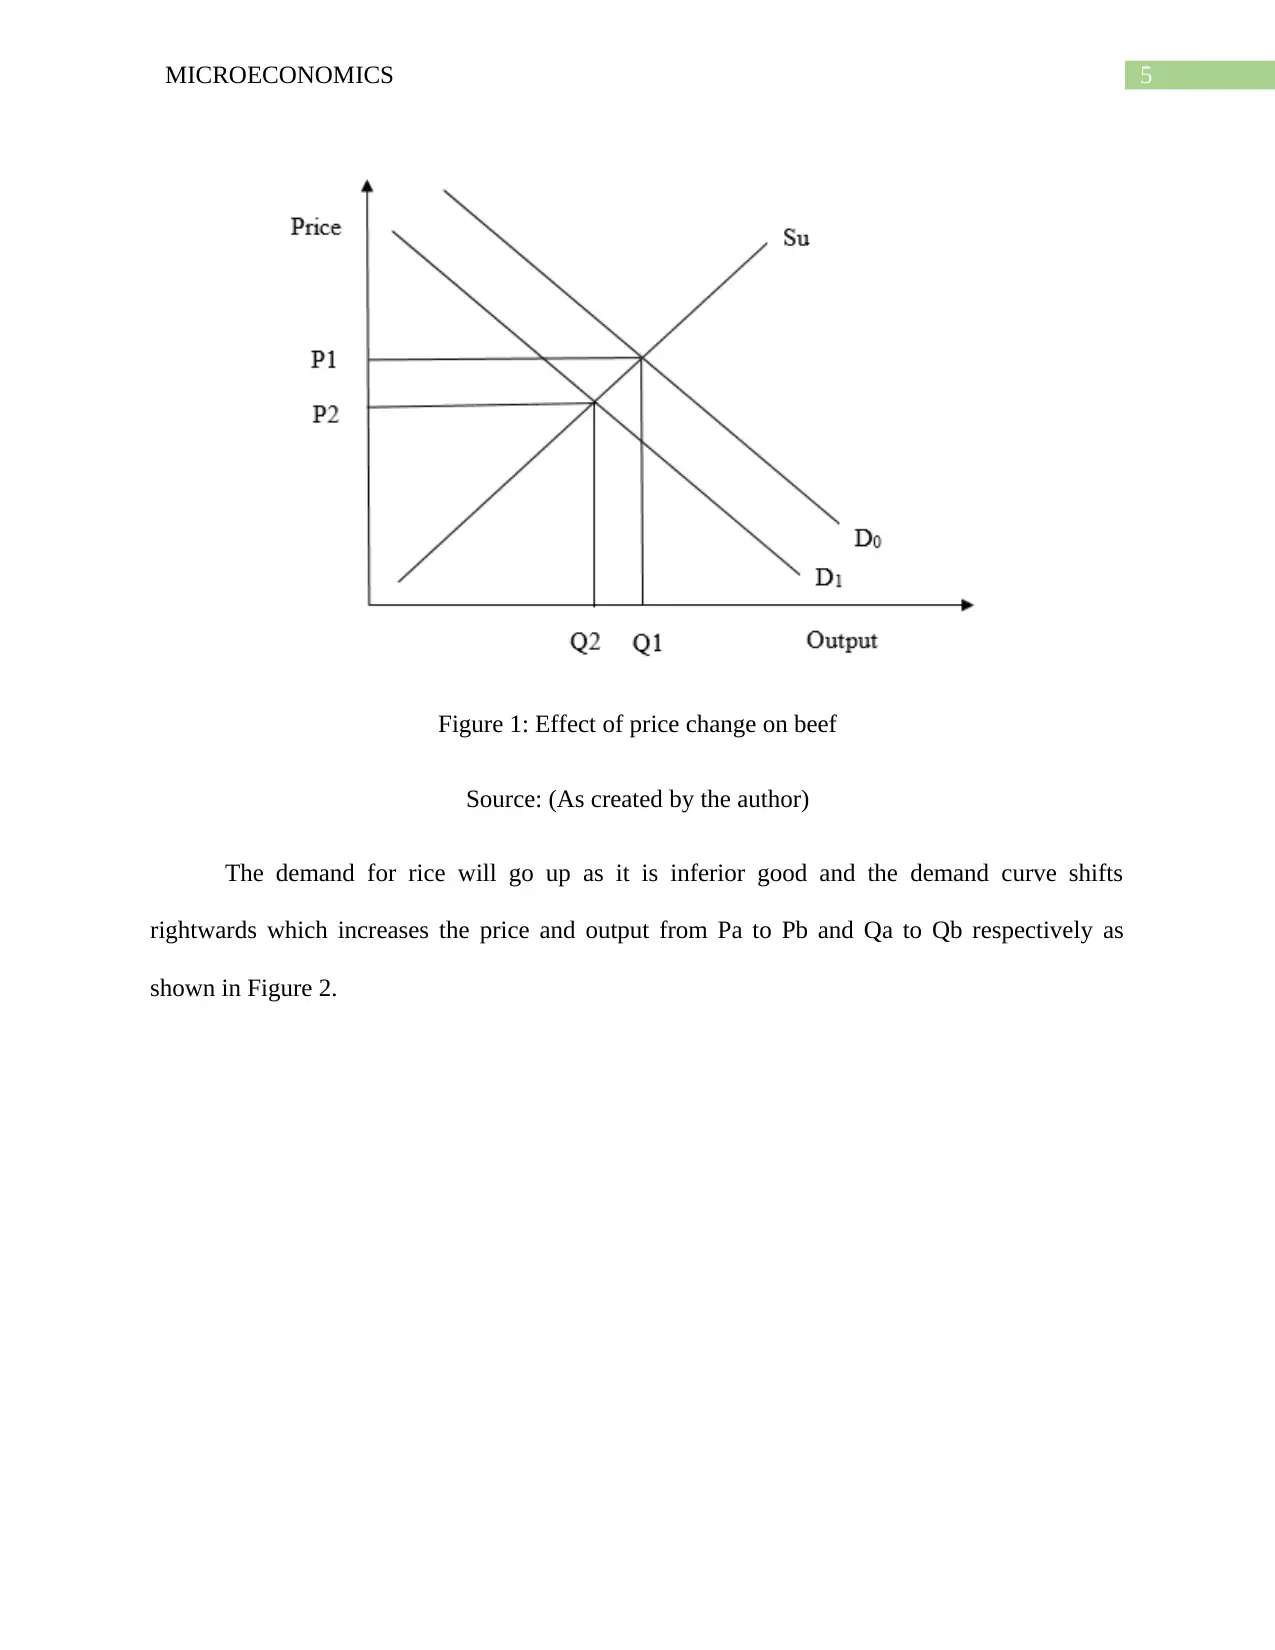
Answer to Part (e)
If price goes up by 15 percent with same income, the purchasing power will go down.
The demand for beef will go down as it is a normal good leading demand curve to shift leftwards
that lowers equilibrium price and quantity which is represented in Figure1.
Answer to Part (d)
Table 5: Elasticity of rice
Table 6: Calculation for elasticity of rice
The income elasticity of demand for rice is -0.027 which suggests that price elasticiy of
demnad is inelastic. Demand and income are positively related for norml goods such that a rise
in income leads to a rise in quantity demanded. In this case, prise rise has led to a fall in quantity
demanded meaning that rice in inferior good, whereas beef is a normal good because rise in
income raises the demand.
Answer to Part (e)
If price goes up by 15 percent with same income, the purchasing power will go down.
The demand for beef will go down as it is a normal good leading demand curve to shift leftwards
that lowers equilibrium price and quantity which is represented in Figure1.
5MICROECONOMICS
Figure 1: Effect of price change on beef
Source: (As created by the author)
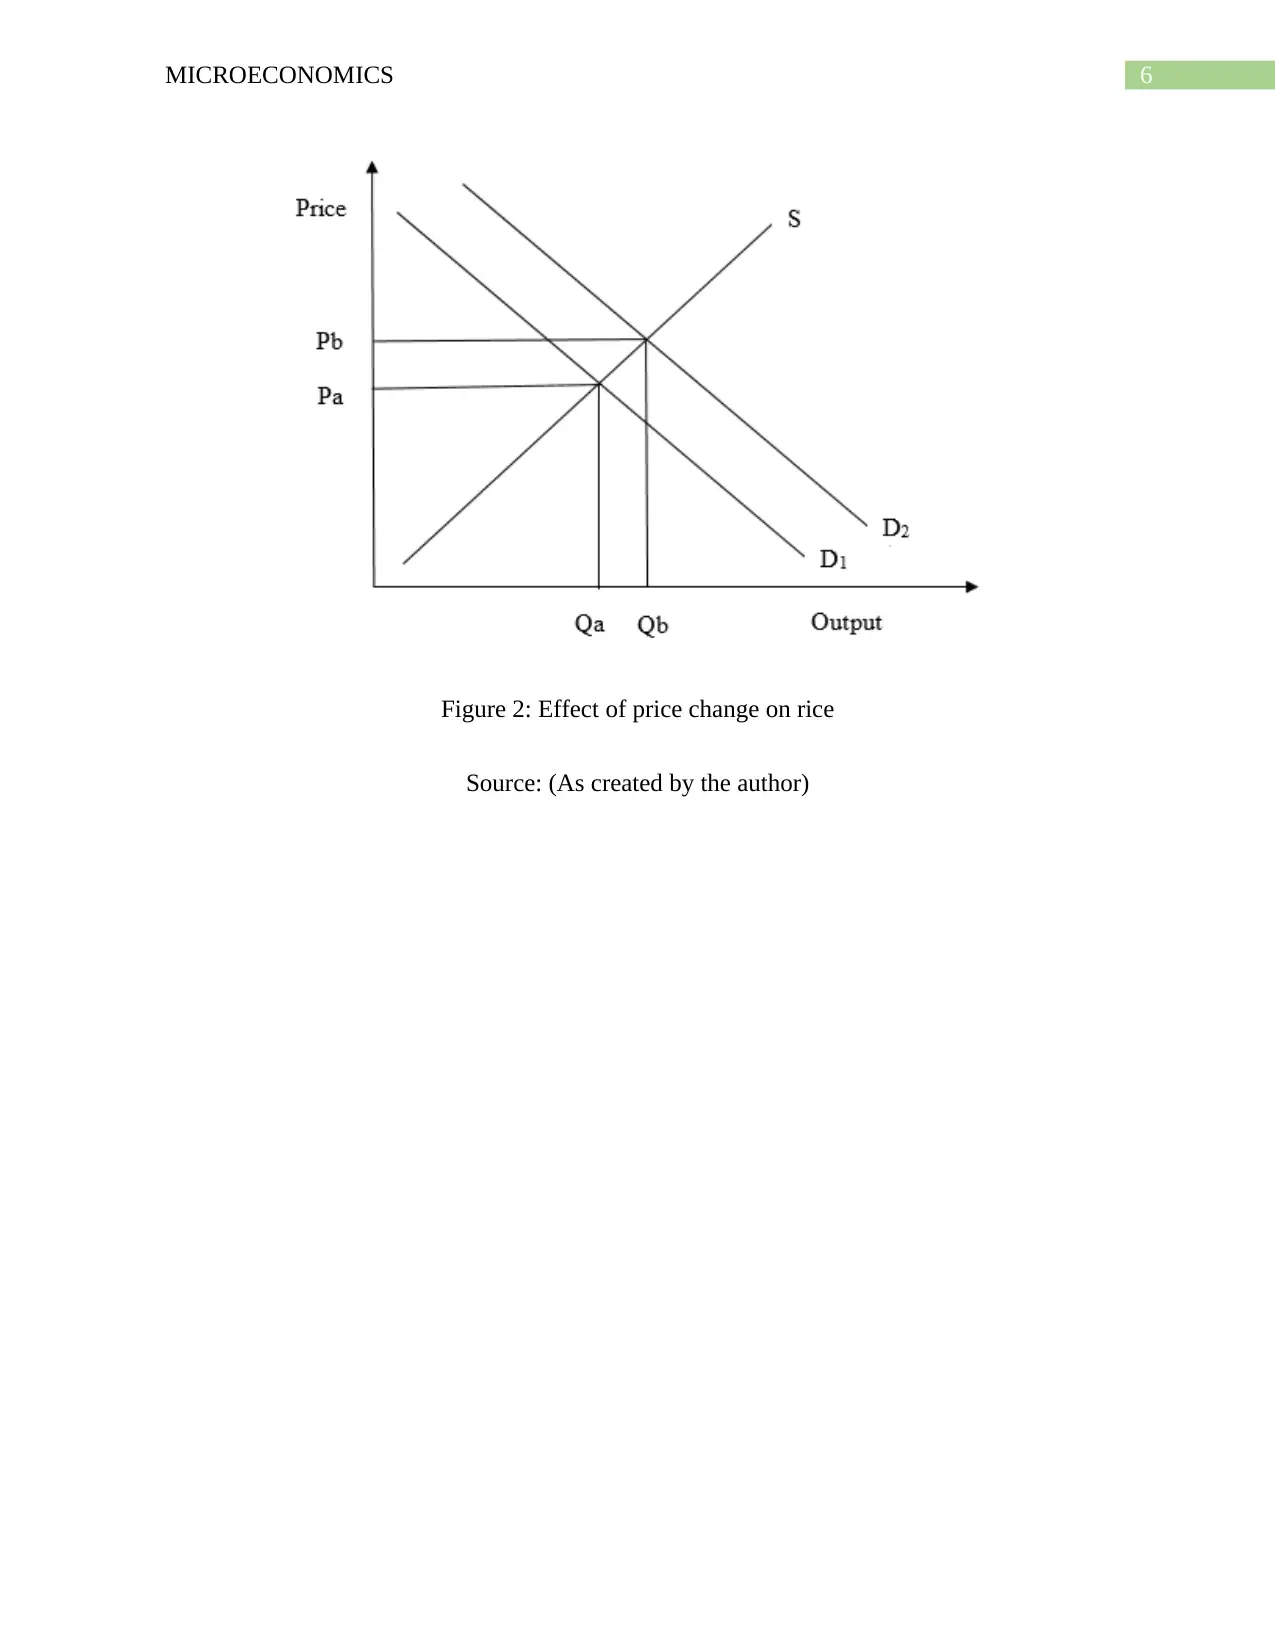
The demand for rice will go up as it is inferior good and the demand curve shifts
rightwards which increases the price and output from Pa to Pb and Qa to Qb respectively as
shown in Figure 2.
Figure 1: Effect of price change on beef
Source: (As created by the author)
The demand for rice will go up as it is inferior good and the demand curve shifts
rightwards which increases the price and output from Pa to Pb and Qa to Qb respectively as
shown in Figure 2.
You're viewing a preview
Unlock full access by subscribing today!
6MICROECONOMICS
Figure 2: Effect of price change on rice
Source: (As created by the author)
Figure 2: Effect of price change on rice
Source: (As created by the author)
Paraphrase This Document
Need a fresh take? Get an instant paraphrase of this document with our AI Paraphraser
7MICROECONOMICS
Answer to Question: 2
Answer to Part (a)
Bush fires is described as the fire that has occurred in a forest or scrub, which rapidly
spreads over regions and causes destruction to vegetation and property. In Australia, bushfires
are widespread and regular that has molded the nature over millions of years. Eastern Australia is
widely affected by bush fires as it is a fire prone region which comprise of various eucalyptus
forest that serves one of the main source of Australia’s resources. Wild fires causes a destruction
to herbs, trees, forbs and grasslands. Draught is caused due to abnormal amount of low rainfall
for a prolonged period that leads to water shortage. Without proper irrigation and land
conditions, crops are unable to grow. The negative impact can be felt on crop production as a fall
in crop production and leads to supply shock.
The effects can be felt in the long run because forest or bush fires slows down the
performance of ecosystems. The temperature of the surrounding goes up along with relatively
lower humidity and strong winds. All these parameters are not good for crop production and
leads to a fall in productivity (Mankiw 2015). This has dried the Australian continent over years
which has resulted in a fall in supply of bananas. Price and supply have positive relation such
that a price rise enables producers to produce more goods and change the output for the goods.
8MICROECONOMICS
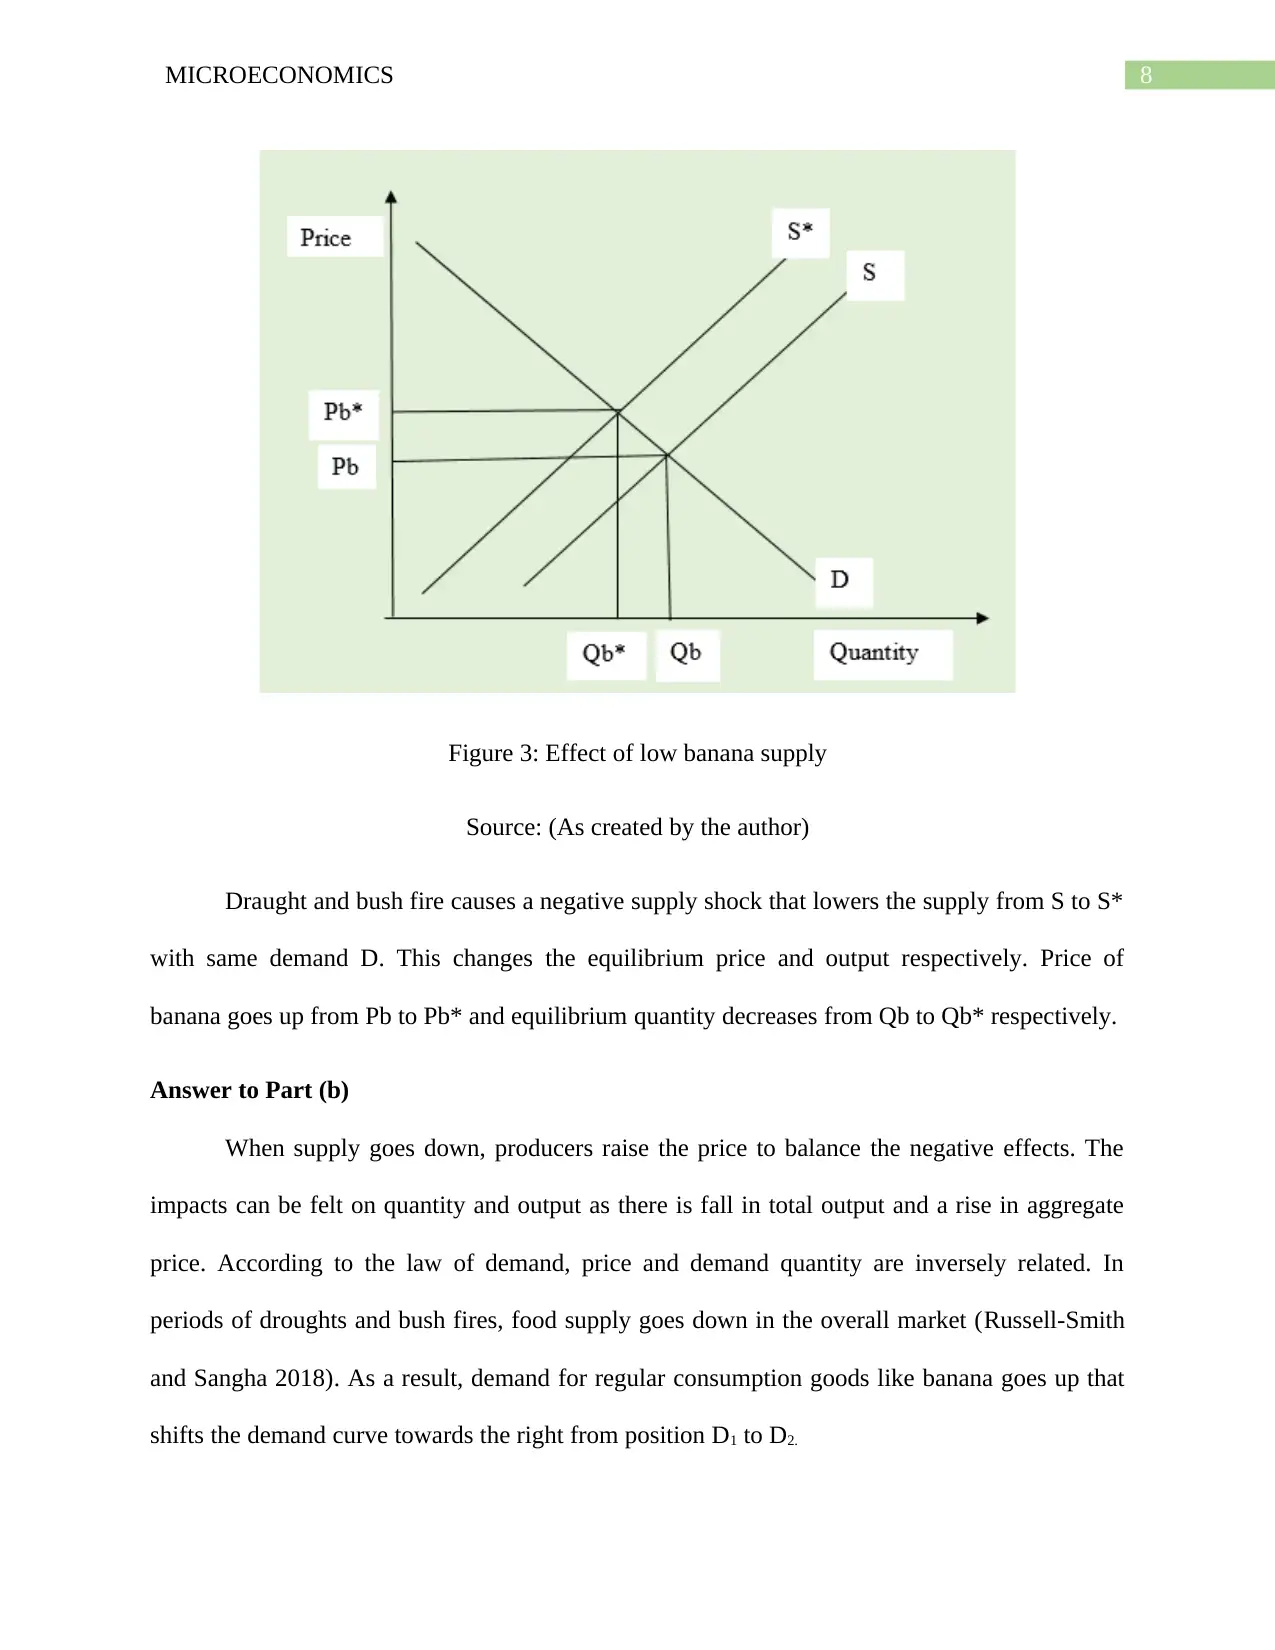
Figure 3: Effect of low banana supply
Source: (As created by the author)
Draught and bush fire causes a negative supply shock that lowers the supply from S to S*
with same demand D. This changes the equilibrium price and output respectively. Price of
banana goes up from Pb to Pb* and equilibrium quantity decreases from Qb to Qb* respectively.
Answer to Part (b)
When supply goes down, producers raise the price to balance the negative effects. The
impacts can be felt on quantity and output as there is fall in total output and a rise in aggregate
price. According to the law of demand, price and demand quantity are inversely related. In
periods of droughts and bush fires, food supply goes down in the overall market (Russell-Smith
and Sangha 2018). As a result, demand for regular consumption goods like banana goes up that
shifts the demand curve towards the right from position D1 to D2.
You're viewing a preview
Unlock full access by subscribing today!
9MICROECONOMICS
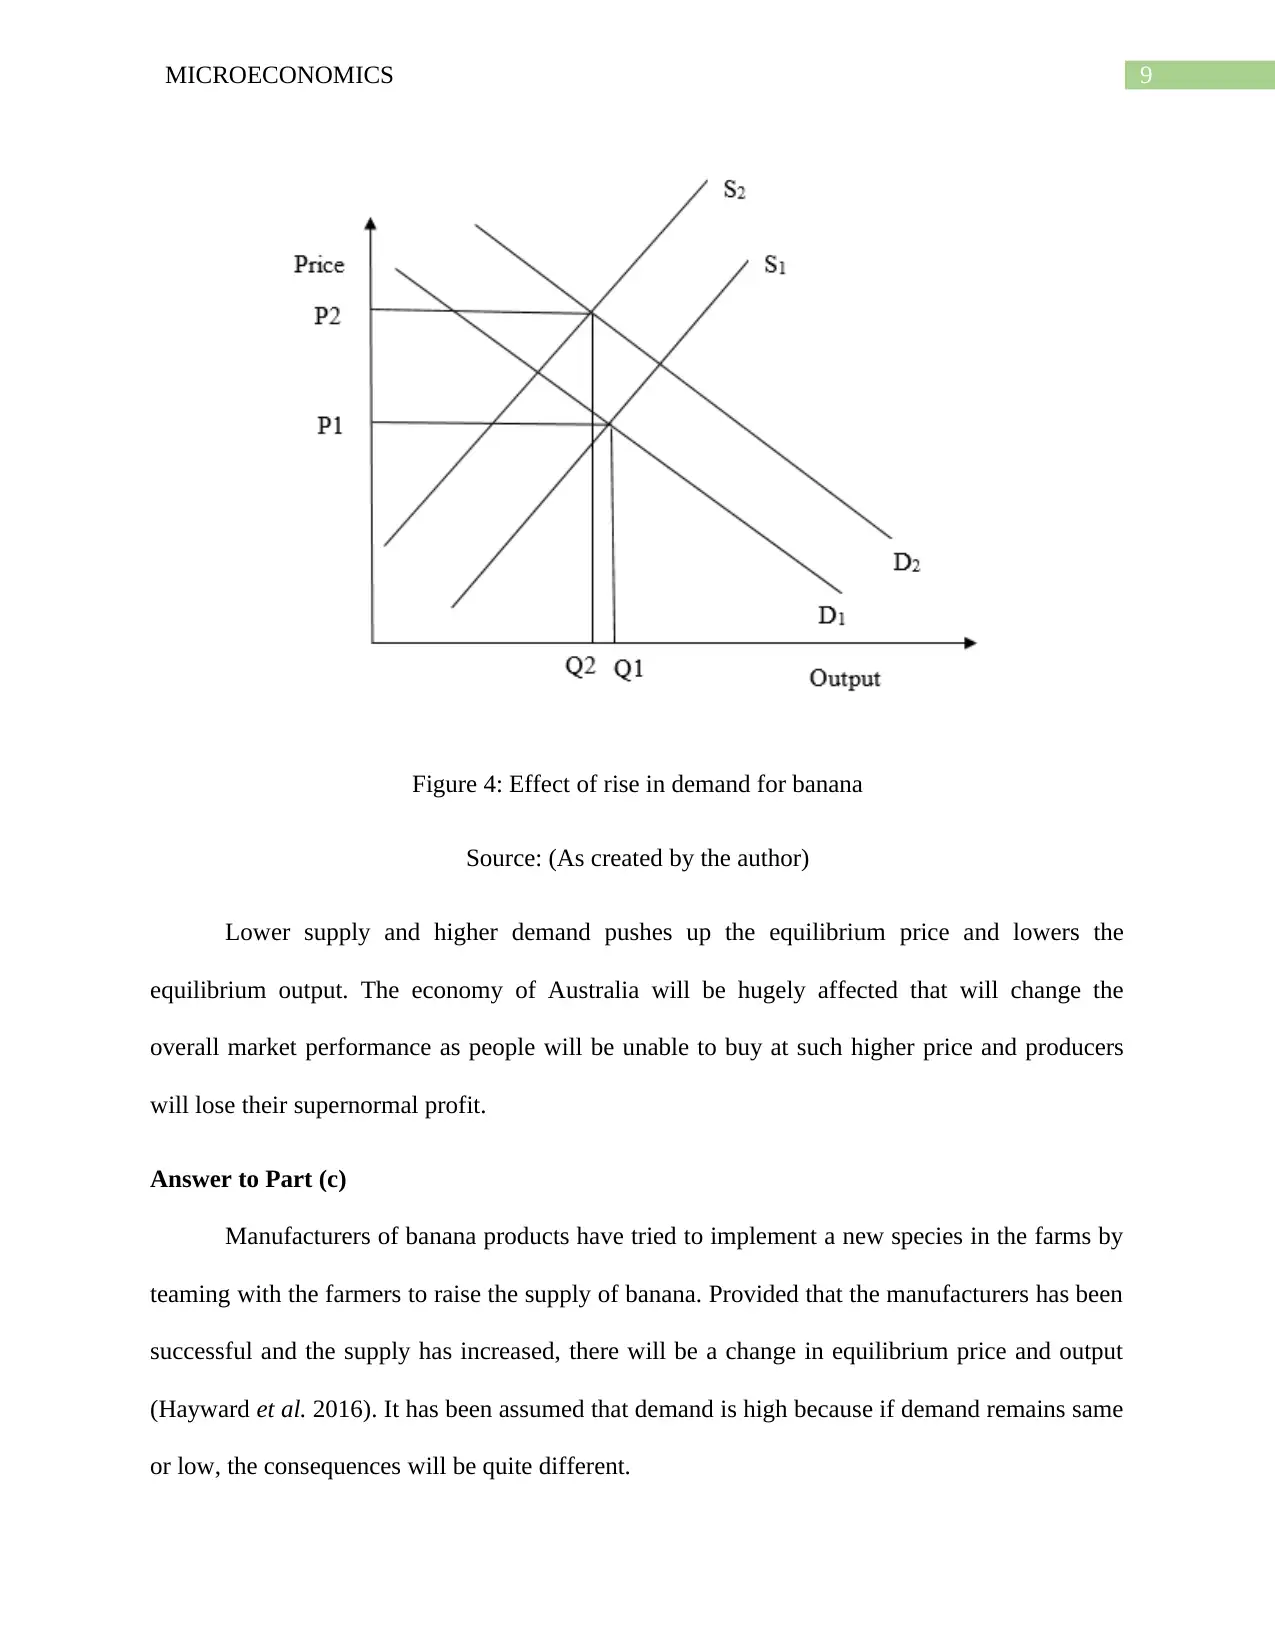
Figure 4: Effect of rise in demand for banana
Source: (As created by the author)
Lower supply and higher demand pushes up the equilibrium price and lowers the
equilibrium output. The economy of Australia will be hugely affected that will change the
overall market performance as people will be unable to buy at such higher price and producers
will lose their supernormal profit.
Answer to Part (c)
Manufacturers of banana products have tried to implement a new species in the farms by
teaming with the farmers to raise the supply of banana. Provided that the manufacturers has been
successful and the supply has increased, there will be a change in equilibrium price and output
(Hayward et al. 2016). It has been assumed that demand is high because if demand remains same
or low, the consequences will be quite different.
Paraphrase This Document
Need a fresh take? Get an instant paraphrase of this document with our AI Paraphraser
10MICROECONOMICS
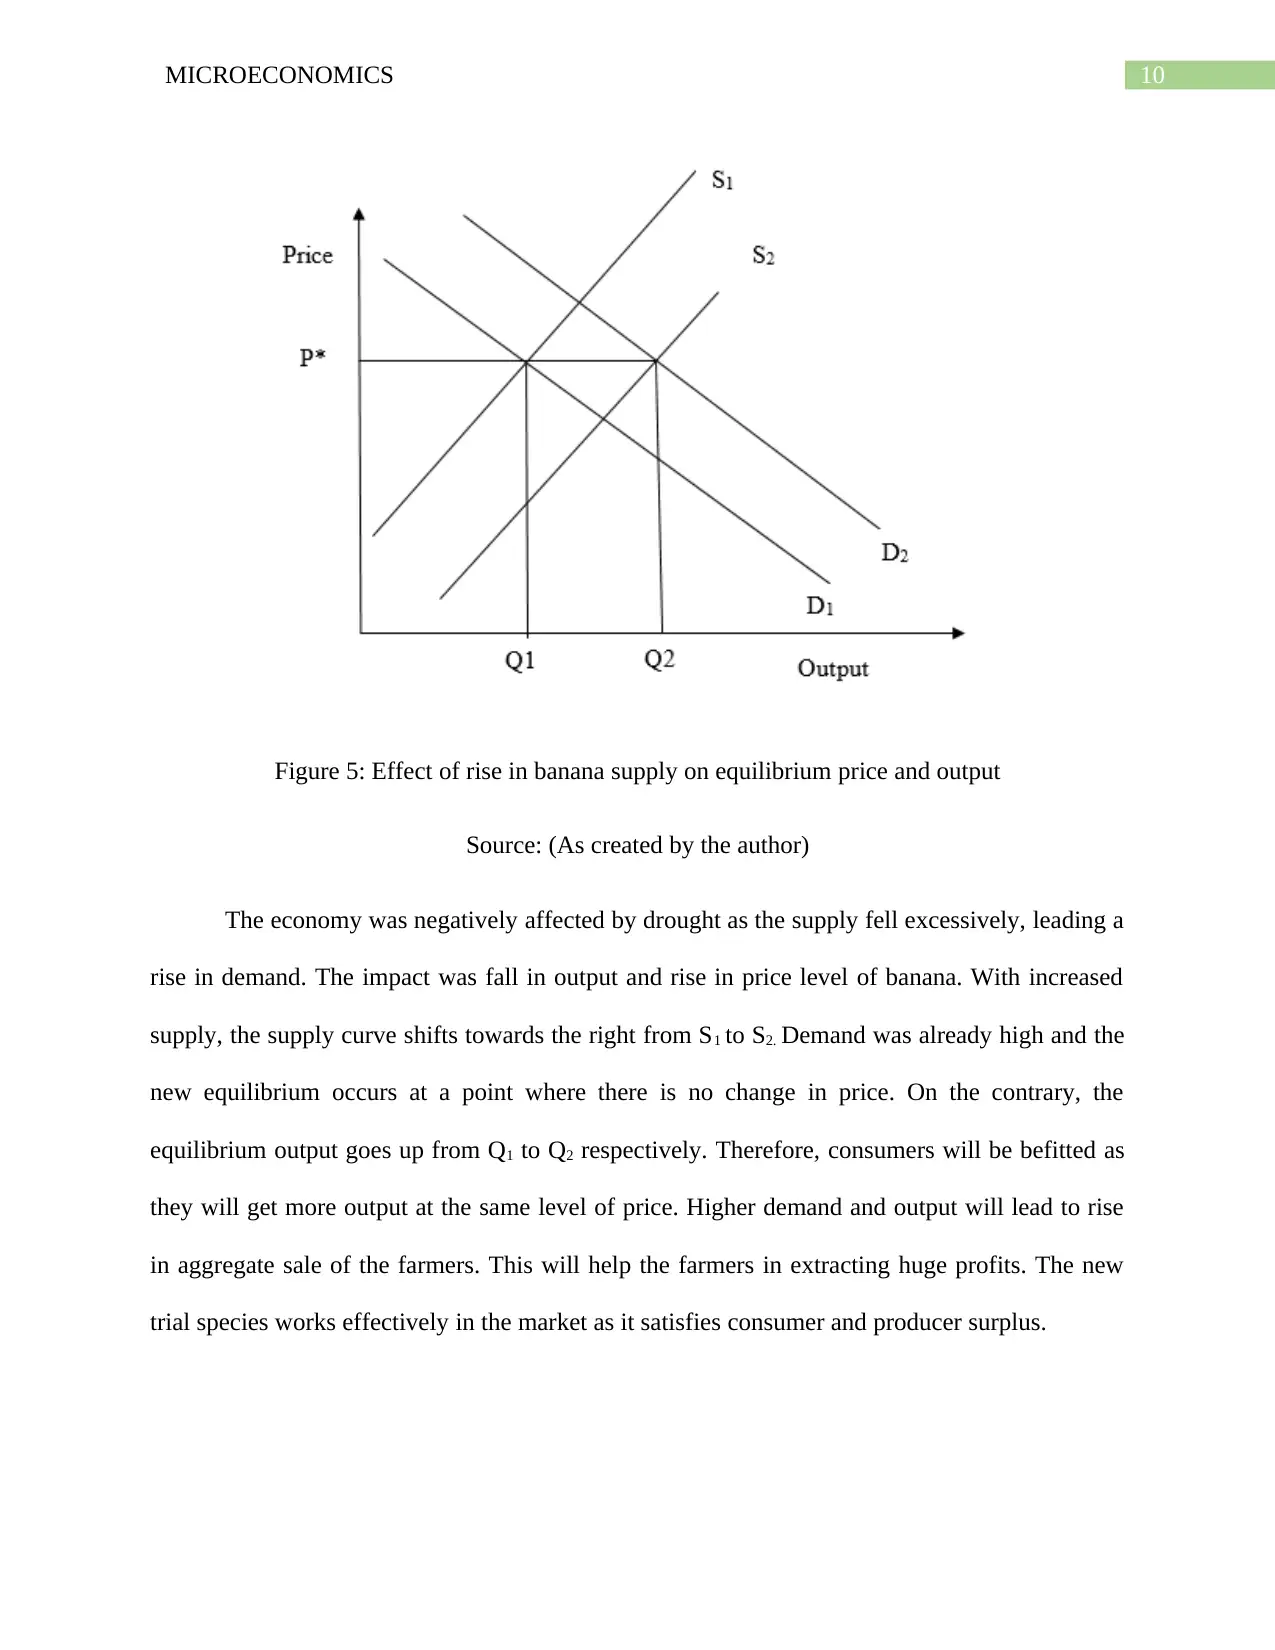
Figure 5: Effect of rise in banana supply on equilibrium price and output
Source: (As created by the author)
The economy was negatively affected by drought as the supply fell excessively, leading a
rise in demand. The impact was fall in output and rise in price level of banana. With increased
supply, the supply curve shifts towards the right from S1 to S2. Demand was already high and the
new equilibrium occurs at a point where there is no change in price. On the contrary, the
equilibrium output goes up from Q1 to Q2 respectively. Therefore, consumers will be befitted as
they will get more output at the same level of price. Higher demand and output will lead to rise
in aggregate sale of the farmers. This will help the farmers in extracting huge profits. The new
trial species works effectively in the market as it satisfies consumer and producer surplus.
11MICROECONOMICS
Reference List
Hayward, M.W., Ward‐Fear, G., L'Hotellier, F., Herman, K., Kabat, A.P. and Gibbons, J.P.,
2016. Could biodiversity loss have increased Australia's bushfire threat?. Animal
Conservation, 19(6), pp.490-497.
Mankiw, N.G., 2015. Yes, r> g. So what?. American Economic Review, 105(5), pp.43-47.
Norman, S. and Wills, D., 2017. The Importance of Emphasizing the Intertemporal Consumption
Model in Intermediate Microeconomics. Journal for Economic Educators, 17(1), pp.25-29.
Norman, S. and Wills, D., 2017. The Importance of Emphasizing the Intertemporal Consumption
Model in Intermediate Microeconomics. Journal for Economic Educators, 17(1), pp.25-29.
Russell-Smith, J. and Sangha, K.K., 2018. Emerging opportunities for developing a diversified
land sector economy in Australia’s northern savannas. The Rangeland Journal, 40(4), pp.315-
330.
You're viewing a preview
Unlock full access by subscribing today!
1 out of 12
Related Documents


Your All-in-One AI-Powered Toolkit for Academic Success.
+13062052269
info@desklib.com
Available 24*7 on WhatsApp / Email
![[object Object]](/_next/static/media/star-bottom.7253800d.svg)
Unlock your academic potential
© 2024 | Zucol Services PVT LTD | All rights reserved.