Microeconomics AB224: Supply, Demand, and Opportunity Cost
VerifiedAdded on 2023/06/15
|16
|3031
|157
Homework Assignment
AI Summary
This assignment delves into the fundamental principles of microeconomics, focusing on supply and demand, production possibility frontiers (PPF), and opportunity costs. It begins by analyzing a hypothetical scenario involving a tribe producing fish and wild oats, examining production possibilities and marginal opportunity costs. The assignment then explores absolute and comparative advantages in bagel and calzone production between New Yorkers and New Jersians, considering the impact of technological advancements. Finally, it investigates market equilibrium in the context of Brazilian coffee beans, both domestically and with international trade, analyzing the effects on price and quantity. The assignment utilizes tables and graphs to illustrate key concepts and requires calculations and explanations to demonstrate a thorough understanding of microeconomic principles.

Unit 3 AB224 | Microeconomics
Unit 3 Assignment: Supply and Demand
Name:
Course Number and Section: AB224–0X
Date:
v. 6.16.17 Page 1 of 16
Unit 3 Assignment: Supply and Demand
Name:
Course Number and Section: AB224–0X
Date:
v. 6.16.17 Page 1 of 16
Paraphrase This Document
Need a fresh take? Get an instant paraphrase of this document with our AI Paraphraser
Unit 3 AB224 | Microeconomics
Questions
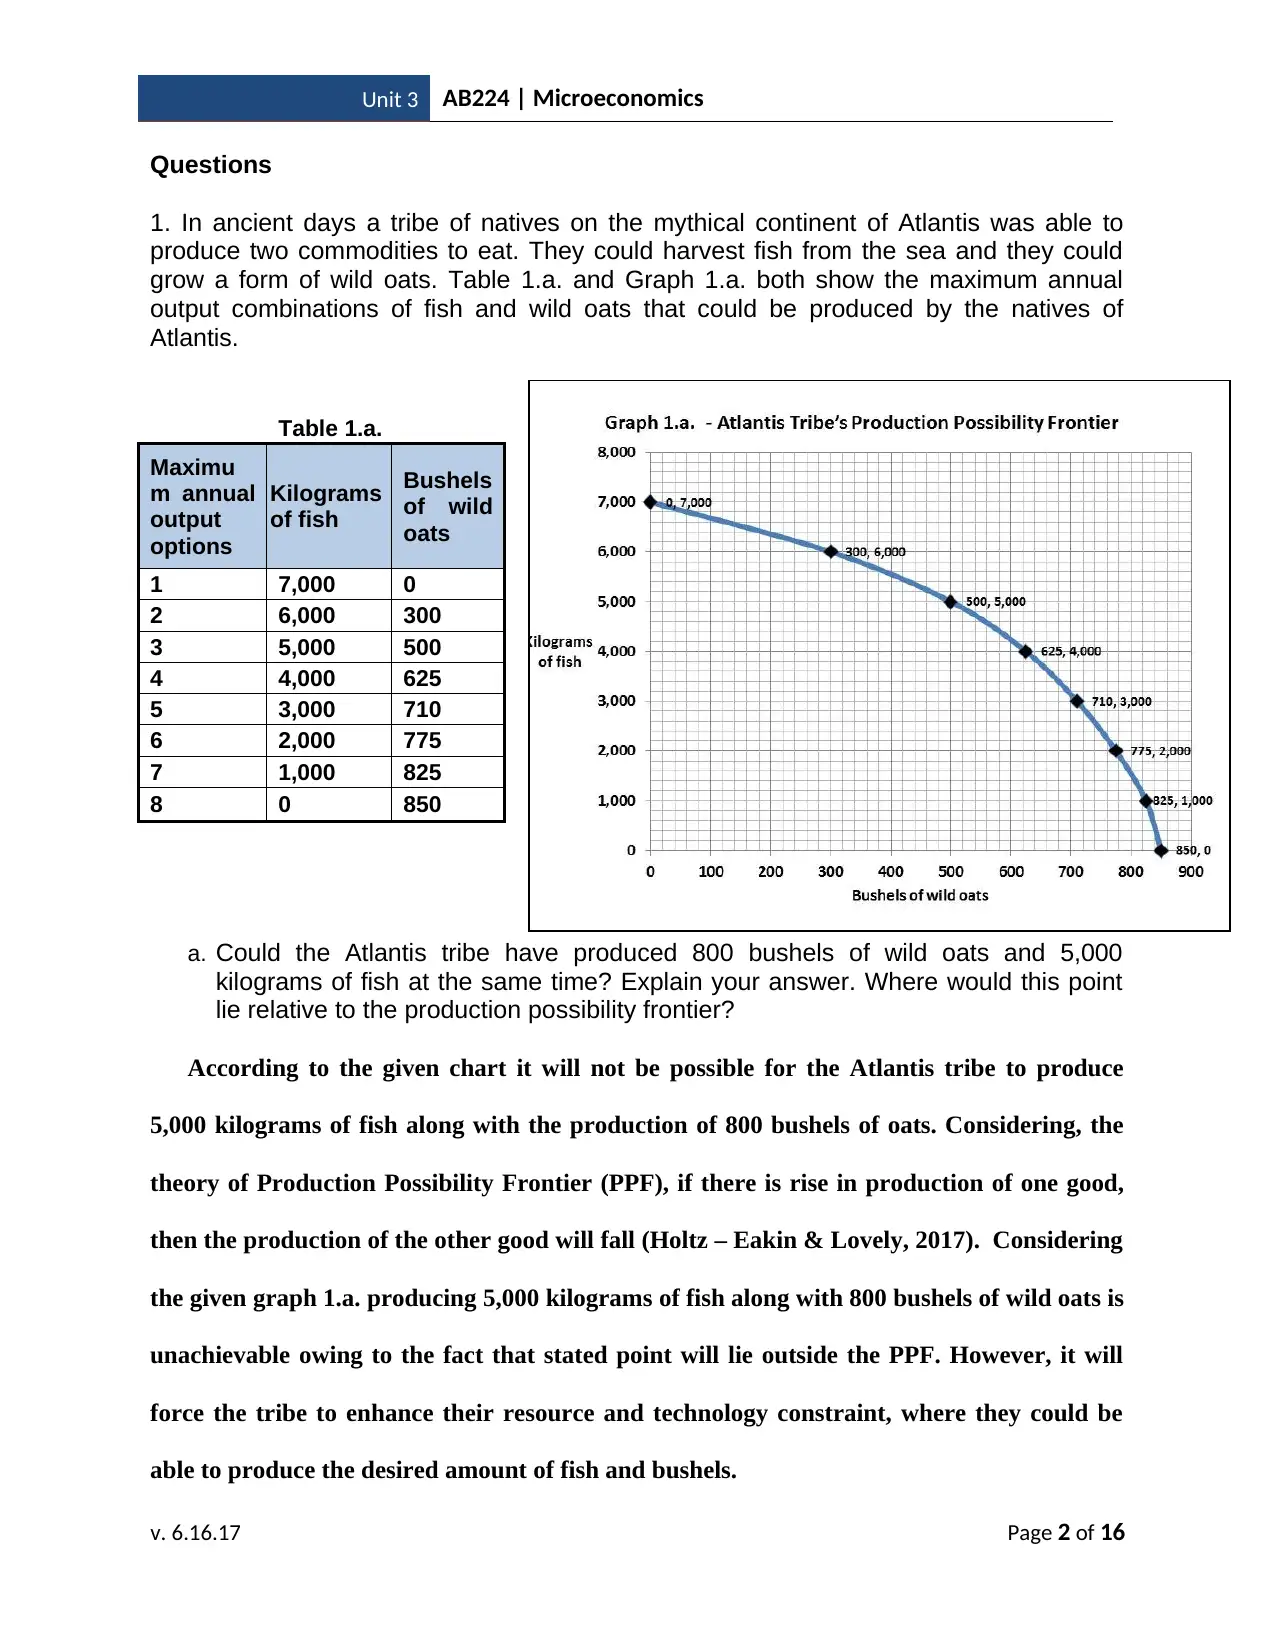
1. In ancient days a tribe of natives on the mythical continent of Atlantis was able to
produce two commodities to eat. They could harvest fish from the sea and they could
grow a form of wild oats. Table 1.a. and Graph 1.a. both show the maximum annual
output combinations of fish and wild oats that could be produced by the natives of
Atlantis.
Table 1.a.
Maximu
m annual
output
options
Kilograms
of fish
Bushels
of wild
oats
1 7,000 0
2 6,000 300
3 5,000 500
4 4,000 625
5 3,000 710
6 2,000 775
7 1,000 825
8 0 850
a. Could the Atlantis tribe have produced 800 bushels of wild oats and 5,000
kilograms of fish at the same time? Explain your answer. Where would this point
lie relative to the production possibility frontier?
According to the given chart it will not be possible for the Atlantis tribe to produce
5,000 kilograms of fish along with the production of 800 bushels of oats. Considering, the
theory of Production Possibility Frontier (PPF), if there is rise in production of one good,
then the production of the other good will fall (Holtz – Eakin & Lovely, 2017). Considering
the given graph 1.a. producing 5,000 kilograms of fish along with 800 bushels of wild oats is
unachievable owing to the fact that stated point will lie outside the PPF. However, it will
force the tribe to enhance their resource and technology constraint, where they could be
able to produce the desired amount of fish and bushels.
v. 6.16.17 Page 2 of 16
Questions
1. In ancient days a tribe of natives on the mythical continent of Atlantis was able to
produce two commodities to eat. They could harvest fish from the sea and they could
grow a form of wild oats. Table 1.a. and Graph 1.a. both show the maximum annual
output combinations of fish and wild oats that could be produced by the natives of
Atlantis.
Table 1.a.
Maximu
m annual
output
options
Kilograms
of fish
Bushels
of wild
oats
1 7,000 0
2 6,000 300
3 5,000 500
4 4,000 625
5 3,000 710
6 2,000 775
7 1,000 825
8 0 850
a. Could the Atlantis tribe have produced 800 bushels of wild oats and 5,000
kilograms of fish at the same time? Explain your answer. Where would this point
lie relative to the production possibility frontier?
According to the given chart it will not be possible for the Atlantis tribe to produce
5,000 kilograms of fish along with the production of 800 bushels of oats. Considering, the
theory of Production Possibility Frontier (PPF), if there is rise in production of one good,
then the production of the other good will fall (Holtz – Eakin & Lovely, 2017). Considering
the given graph 1.a. producing 5,000 kilograms of fish along with 800 bushels of wild oats is
unachievable owing to the fact that stated point will lie outside the PPF. However, it will
force the tribe to enhance their resource and technology constraint, where they could be
able to produce the desired amount of fish and bushels.
v. 6.16.17 Page 2 of 16

Unit 3 AB224 | Microeconomics
b. Using Table 1.a., what would have been the marginal opportunity cost of
increasing the annual output of wild oats by 200 bushels, from 300 bushels up to
500 bushels?
Increasing the output of the wild oats, Atlantis tribe will be giving up some amount of
production of fish, which will be the Marginal Opportunity Cost (MOC) of enhancing
bushels production.
MOC of enhancing the bushels output = Sacrifice/Gain
= (6000-5000)/200
= 1000/200
= 5
Therefore, the tribe has to give up 5 kg of fish for every unit of wild oats, which is the
MOC of increasing the production.
c. Using Table 1.a., what would have been the marginal opportunity cost of
increasing the annual output of wild oats by 200 bushels, from 625 bushels up to
825 bushels?
According the table 1.a. if the Atlantis tribe enhances the production of wild oats by 200
bushels, then they have to go out (4000 – 1000) kg = 3000 kg of fish.
Therefore MOC of enhancing wild oats annual output is = 3000/200
= 15 kg
Thus, the tribe has to give up 15 kg of fish for every unit of wild oats, which is the MOC
of increasing the annual production.
v. 6.16.17 Page 3 of 16
⊘ This is a preview!⊘
Do you want full access?
Subscribe today to unlock all pages.
Trusted by 1+ million students worldwide

Unit 3 AB224 | Microeconomics
d. Why are the marginal opportunity costs for two similar batches of 200 bushels of
wild oats not the same? Explain. What does this difference imply about the shape
of the Atlantis tribe’s production possibility frontier curve?
Difference in the MOC in different cases mainly occurs due to the variation in the
amount of fish production. Given PPF highlights that the Atlantis tribe is better in
production of fish within the range of 625 and 825 compared to the wild oats production.
Shape of the PPF illustrates Increasing Opportunity Cost, which entails if there is rise in
production of one good, and then the tribe has to sacrifice the other good in large amount
(Folland, Goodman & Stano, 2016). With steeper PPF within the range of 625 and 825
compared to the 300 and 500, difference in MOC of these two points arises.
v. 6.16.17 Page 4 of 16
Paraphrase This Document
Need a fresh take? Get an instant paraphrase of this document with our AI Paraphraser

Unit 3 AB224 | Microeconomics
2. In the neighboring groups of New Yorkers and New Jersians, each produces only two
products, bagels and calzones. By themselves, the New Yorkers, each day, can produce either
45 pounds of bagels and no calzones, or 30 pounds of calzones and no bagels, or any
combination in between. The New Jersians, by themselves, each day, can produce 30 pounds
of bagels and no calzones, or 28 pounds of calzones and no bagels, or any combination in
between. Diagram 1.a. shows the daily Production Possibility Frontier for the New Yorkers and
Diagram 1.b. shows the daily Production Possibility Frontier for the New Jersians.
a. Examine diagram 1.a. showing the daily Production Possibility Frontier for the New Yorkers
and diagram 1.b. showing the daily Production Possibility Frontier for the New Jersians. Which
group has the absolute advantage in bagels production? Show your calculations and explain
why.
According to the Hanson, Lind & Muendler, (2015), state which has absolute
advantage, it can produce higher amount of a good compared to its rivals utilizing same
v. 6.16.17 Page 5 of 16

Unit 3 AB224 | Microeconomics
quantity of resources. Considering the 1.a. it can be seen that New Yorkers’ have absolute
advantage when it comes to production of bagels.
New Yorkers’ = 45-30
= 15
New Jersey’s = 30-28
= 2
Therefore, utilizing same input, New Yorker’s can produce higher amount of
bagels compared to the New Jersey’s.
b. Examine diagram 1.a. showing the daily Production Possibility Frontier for the New Yorkers
and diagram 1.b. showing the daily Production Possibility Frontier for the New Jersians. Which
group has the absolute advantage in calzones production? Show your calculations and
explain why.
New Yorkers’ = 30 - 45
= - 15
New Jersey’s = 28 - 30
= - 2
Therefore, New Jersey has absolute advantage in production of calzones due to the
fact that it requires less number of inputs in order to producing almost same amount of
output as New Yorkers.
v. 6.16.17 Page 6 of 16
⊘ This is a preview!⊘
Do you want full access?
Subscribe today to unlock all pages.
Trusted by 1+ million students worldwide

Unit 3 AB224 | Microeconomics
c. Examine diagram 1.a. showing the daily Production Possibility Frontier for the New Yorkers
and diagram 1.b. showing the daily Production Possibility Frontier for the New Jersians. Which
group has the comparative advantage in calzones production? Show your calculations and
explain why.
According to the theory of Mankiw, (2014), states which has lower opportunity cost
faces comparative advantage in production. Considering the diagram 1.a. it can be seen
that:
New Yorkers’ Opportunity cost = 45/30 = 1.5
New Jersians Opportunity cost = 30/28 = 1.07
It can be seen that New Jersians has lower amount of Opportunity cost, thus they
have comparative advantage in production of calzone.
d. Examine diagram 1.a. showing the daily Production Possibility Frontier for the New Yorkers
and diagram 1.b. showing the daily Production Possibility Frontier for the New Jersians. Which
group has the comparative advantage in bagels production? Show your calculations and
explain why.
When it comes to production of bagels, then the opportunity cost of the two states is
as follows:
New York = 30/45 = 0.67
New Jersey = 28/35 = 0.8
It can be seen that New Yorkers’ has lower amount of Opportunity cost, thus they
have comparative advantage in production of calzone.
Later, the New Yorkers discover a new technology for making calzones that dramatically
increases the quantity of calzones they can produce each day. Diagram 1.c. shows both the old
and the new daily production possibility frontier for the New Yorkers. The New Yorkers, each
day, can now produce either 45 pounds of bagels and no calzones, or 50 pounds of calzones
and no bagels, or any combination in between. Diagram 1.c. shows both the old and the new
v. 6.16.17 Page 7 of 16
Paraphrase This Document
Need a fresh take? Get an instant paraphrase of this document with our AI Paraphraser
Unit 3 AB224 | Microeconomics
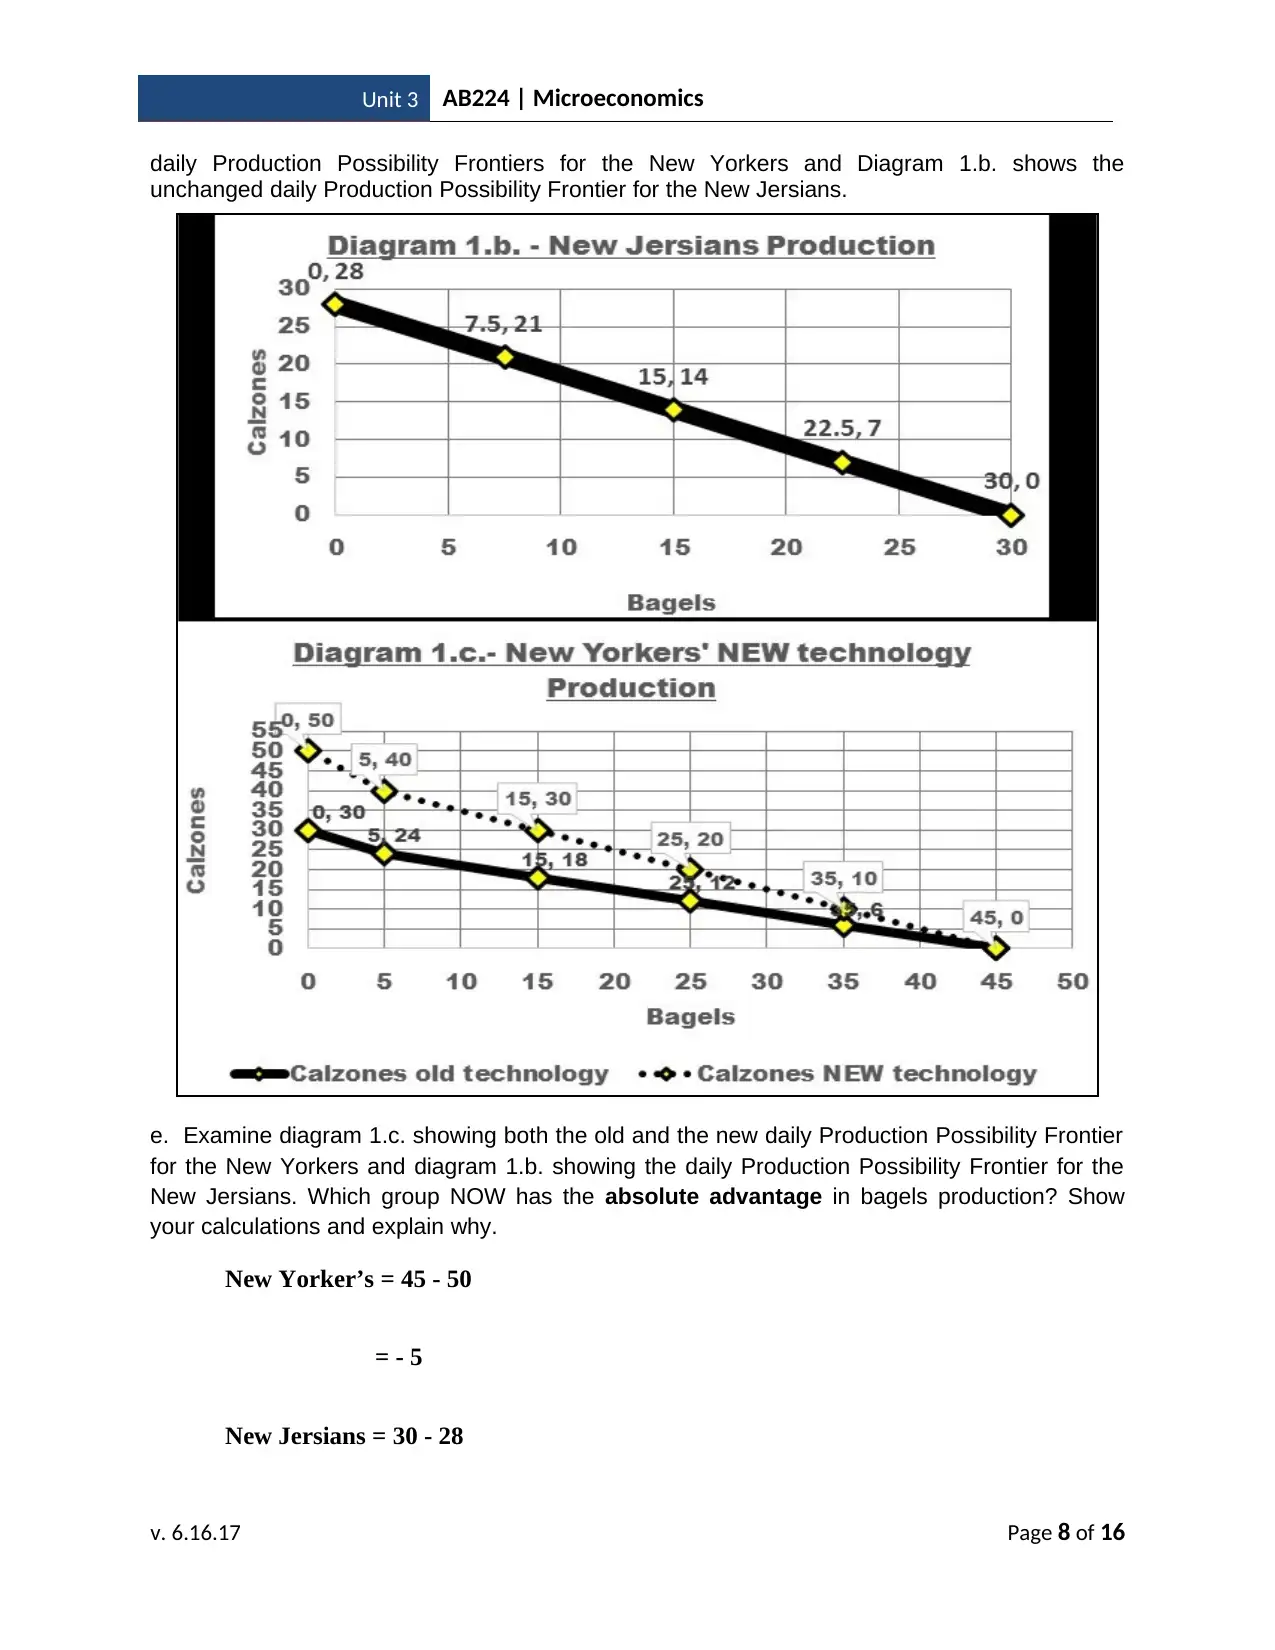
daily Production Possibility Frontiers for the New Yorkers and Diagram 1.b. shows the
unchanged daily Production Possibility Frontier for the New Jersians.
e. Examine diagram 1.c. showing both the old and the new daily Production Possibility Frontier
for the New Yorkers and diagram 1.b. showing the daily Production Possibility Frontier for the
New Jersians. Which group NOW has the absolute advantage in bagels production? Show
your calculations and explain why.
New Yorker’s = 45 - 50
= - 5
New Jersians = 30 - 28
v. 6.16.17 Page 8 of 16
Unit 3 AB224 | Microeconomics
= 2
Considering the condition, it can be stated that New Jesians faces absolute
advantage in production of bagels because it has negative inputs while moving to point of
45 from 45.
f. Examine diagram 1.c. showing both old and the new daily Production Possibility Frontier for
the New Yorkers and diagram 1.b. showing the daily Production Possibility Frontier for the New
Jersians. Which group NOW has the absolute advantage in calzones production? Show your
calculations and explain why.
New Yorker’s = 28 - 30
= - 2
New Jersians = 50 – 45
= 5
It can be seen that New Yorkers’ has absolute advantage due to the fact that their
cost of production is lower than the New Jersians.
g. Examine diagram 1.c. showing both the old and the new daily Production Possibility Frontier
for the New Yorkers and diagram 1.b. showing the daily Production Possibility Frontier for the
New Jersians. Which group NOW has the comparative advantage in bagels production? Show
your calculations and explain why this is important.
New Yorker’s = 28/30
= 0.8
New Jersians = 50/45
= 1.11
v. 6.16.17 Page 9 of 16
⊘ This is a preview!⊘
Do you want full access?
Subscribe today to unlock all pages.
Trusted by 1+ million students worldwide
Unit 3 AB224 | Microeconomics
Considering the opportunity cost situation, it can be said that New Jersians can
produce at lower cost, thus they have comparative advantage.
h. Examine diagram 1.c. showing both old and the new daily Production Possibility Frontier for
the New Yorkers and diagram 1.b. showing the daily Production Possibility Frontier for the New
Jersians. Which group NOW has the comparative advantage in calzones production? Show
your calculations and explain why this is important.
New Yorker’s = 45/50
= 0.9
New Jersians = 30/28
= 1.07
Owing to the opportunity cost situation, it can be stated that New Yorkers have
comparative advantage because they face lowered amount of opportunity cost compared to
the New Jersey.
v. 6.16.17 Page 10 of 16
Paraphrase This Document
Need a fresh take? Get an instant paraphrase of this document with our AI Paraphraser

Unit 3 AB224 | Microeconomics
3. Suppose that the supply schedule of Brazilian Coffee beans is as follows:
Price of Brazilian Coffee
beans
(per pound)
Quantity of Brazilian Coffee
beans supplied
(pounds)
$4.00 6,000
$3.50 5,000
$3.00 4,000
$2.50 3,000
$2.00 2,000
Suppose that Brazilian Coffee beans can be sold only in Brazil. The domestic Brazilian
demand schedule for Brazilian Coffee beans is as follows:
Price of Brazilian Coffee
beans
(per pound)
Brazilian Quantity of Brazilian
Coffee beans demanded
(pounds)
$4.00 1,000
$3.50 2,500
$3.00 4,000
$2.50 5,000
$2.00 7,000
a. Below is the graph of the domestic Supply and Demand (Graph 2.a.) for Brazilian
Coffee beans. From the supply and demand schedules above, what are the
equilibrium price and quantity of Brazilian Coffee beans?
Considering the Graph 2.a. and supply - demand schedule, it can be stated that:
Equilibrium price is of Coffee beans of Brazil is = $3.00
Equilibrium quantity is of Coffee beans of Brazil is = 4,000 lbs
v. 6.16.17 Page 11 of 16

Unit 3 AB224 | Microeconomics
Now suppose that Brazilian Coffee beans can also be sold in Canada. The Canadian
demand schedule for Brazilian Coffee beans is as follows:
Price of Brazilian Coffee
beans
(per pound)
Canadian Quantity of Brazilian
Coffee beans demanded
(pounds)
$4.00 1,000
$3.50 2,500
$3.00 3,000
$2.50 5,000
$2.00 5,500
b. Complete the following table by inserting the total Brazilian Coffee beans
demanded by both the Brazilians and Canadians at each price (the combined
(total) demand schedule for Brazilian Coffee beans).
Price of Brazilian
Coffee beans
Canadian
Quantity of
Brazilian Coffee
Brazilian
Quantity of
Brazilian Coffee
Total Brazilian
Coffee
Demanded
v. 6.16.17 Page 12 of 16
⊘ This is a preview!⊘
Do you want full access?
Subscribe today to unlock all pages.
Trusted by 1+ million students worldwide
1 out of 16
Your All-in-One AI-Powered Toolkit for Academic Success.
+13062052269
info@desklib.com
Available 24*7 on WhatsApp / Email
![[object Object]](/_next/static/media/star-bottom.7253800d.svg)
Unlock your academic potential
Copyright © 2020–2025 A2Z Services. All Rights Reserved. Developed and managed by ZUCOL.