Midterm Assignment On Hypothesis
Added on 2022-07-28
9 Pages2194 Words32 Views
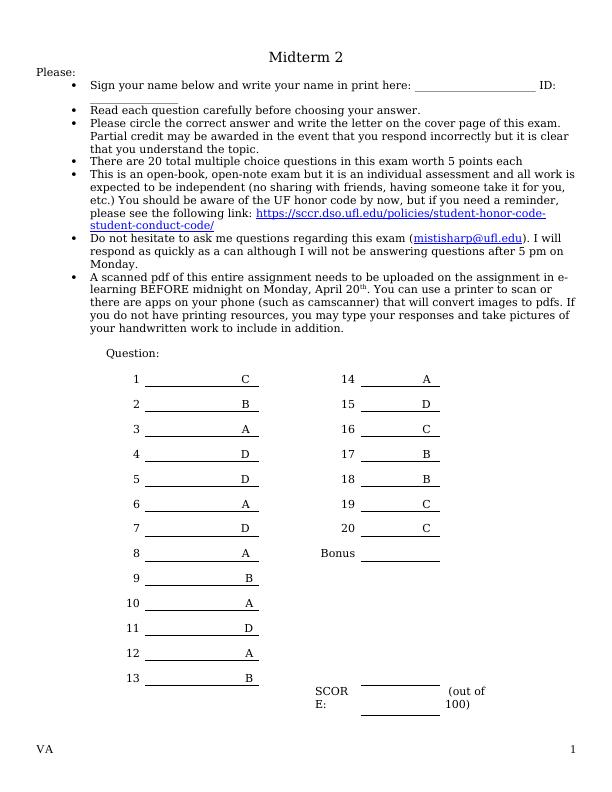
Midterm 2
Please:
Sign your name below and write your name in print here: ______________________ ID:
________________
Read each question carefully before choosing your answer.
Please circle the correct answer and write the letter on the cover page of this exam.
Partial credit may be awarded in the event that you respond incorrectly but it is clear
that you understand the topic.
There are 20 total multiple choice questions in this exam worth 5 points each
This is an open-book, open-note exam but it is an individual assessment and all work is
expected to be independent (no sharing with friends, having someone take it for you,
etc.) You should be aware of the UF honor code by now, but if you need a reminder,
please see the following link: https://sccr.dso.ufl.edu/policies/student-honor-code-
student-conduct-code/
Do not hesitate to ask me questions regarding this exam (mistisharp@ufl.edu). I will
respond as quickly as a can although I will not be answering questions after 5 pm on
Monday.
A scanned pdf of this entire assignment needs to be uploaded on the assignment in e-
learning BEFORE midnight on Monday, April 20th. You can use a printer to scan or
there are apps on your phone (such as camscanner) that will convert images to pdfs. If
you do not have printing resources, you may type your responses and take pictures of
your handwritten work to include in addition.
Question:
1 C 14 A
2 B 15 D
3 A 16 C
4 D 17 B
5 D 18 B
6 A 19 C
7 D 20 C
8 A Bonus
9 B
10 A
11 D
12 A
13 B
SCOR
E:
(out of
100)
VA 1
Name: ______________________________ UF Honor Pledge: We, the members of the University of
Florida Community, pledge to hold ourselves and our peers to the highest standards of honesty
and integrity.
VA 2
Florida Community, pledge to hold ourselves and our peers to the highest standards of honesty
and integrity.
VA 2
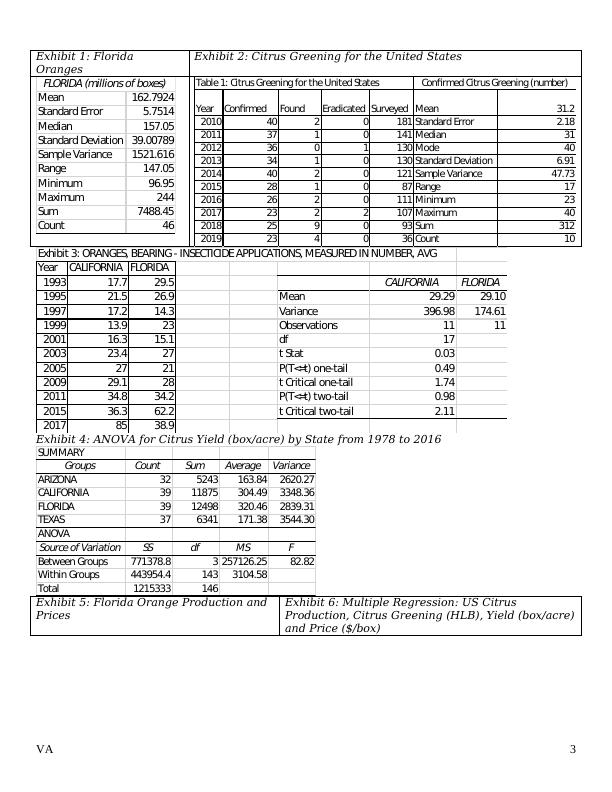
Exhibit 1: Florida
Oranges
Exhibit 2: Citrus Greening for the United States
Mean 162.7924
Standard Error 5.7514
Median 157.05
Standard Deviation 39.00789
Sample Variance 1521.616
Range 147.05
Minimum 96.95
Maximum 244
Sum 7488.45
Count 46
FLORIDA (millions of boxes) Table 1: Citrus Greening for the United States
Year Confirmed Found Eradicated Surveyed Mean 31.2
2010 40 2 0 181 Standard Error 2.18
2011 37 1 0 141 Median 31
2012 36 0 1 130 Mode 40
2013 34 1 0 130 Standard Deviation 6.91
2014 40 2 0 121 Sample Variance 47.73
2015 28 1 0 87 Range 17
2016 26 2 0 111 Minimum 23
2017 23 2 2 107 Maximum 40
2018 25 9 0 93 Sum 312
2019 23 4 0 36 Count 10
Confirmed Citrus Greening (number)
Exhibit 3: ORANGES, BEARING - INSECTICIDE APPLICATIONS, MEASURED IN NUMBER, AVG
Year CALIFORNIA FLORIDA
1993 17.7 29.5 CALIFORNIA FLORIDA
1995 21.5 26.9 Mean 29.29 29.10
1997 17.2 14.3 Variance 396.98 174.61
1999 13.9 23 Observations 11 11
2001 16.3 15.1 df 17
2003 23.4 27 t Stat 0.03
2005 27 21 P(T<=t) one-tail 0.49
2009 29.1 28 t Critical one-tail 1.74
2011 34.8 34.2 P(T<=t) two-tail 0.98
2015 36.3 62.2 t Critical two-tail 2.11
2017 85 38.9
322.2 320.1Exhibit 4: ANOVA for Citrus Yield (box/acre) by State from 1978 to 2016
SUMMARY
Groups Count Sum Average Variance
ARIZONA 32 5243 163.84 2620.27
CALIFORNIA 39 11875 304.49 3348.36
FLORIDA 39 12498 320.46 2839.31
TEXAS 37 6341 171.38 3544.30
ANOVA
Source of Variation SS df MS F
Between Groups 771378.8 3 257126.25 82.82
Within Groups 443954.4 143 3104.58
Total 1215333 146
Exhibit 5: Florida Orange Production and
Prices
Exhibit 6: Multiple Regression: US Citrus
Production, Citrus Greening (HLB), Yield (box/acre)
and Price ($/box)
VA 3
End of preview
Want to access all the pages? Upload your documents or become a member.