MKT 220: Deli Depot Data Analysis
VerifiedAdded on 2019/10/18
|7
|1609
|392
Project
AI Summary
This marketing research project uses SPSS to analyze data from a Deli Depot customer survey. The analysis focuses on several key variables, including employee friendliness and competence, food quality and variety, prices, service speed, and customer satisfaction. The data is analyzed to identify differences between male and female respondents, those who would recommend or not recommend Deli Depot, and those with different satisfaction levels. Frequencies, means, medians, modes, and standard deviations are calculated. Bar and pie charts are created to visualize the data. The project concludes with a PowerPoint presentation summarizing the findings and identifying areas of opportunity for Deli Depot based on the analysis.
MKT 220 E&I Chapter 11
Basic Data Analysis for Quantitative Research
(Deli Depot)
1. Using SPSS and the Deli Depot database (see Blackboard/Course Documents/Chapter
11), provide frequencies, means, modes, and medians for the relevant variables on the
questionnaire. The questionnaire is shown in Chapter 10 (attached here).
To answer this question, we first need to understand the type of questions as well as their
corresponding measures of central tendency and dispersion, as well as statistic tests.
Variables X1-X6 are interval, which means that they have the most robust measures of
central tendency and dispersion.
I see that out of the six variables, X1 and X3 refer to employees; X4 and X5 refer to Food.
As such, I will analyze the information in blocks of two (instead of comparing each variable
at a time). I will group X2 Competitive Prices, and X6 Fast Service together since both
indicate the type of industry (fast food) where Deli Depot participate.
X1 Friendly Employees
X3 Competent Employees
X4 Excellent Food Quality
X5 Wide Variety of Food
X2 Competitive Prices
X6 Fast Service
2. In addition, develop bar charts and pie charts where appropriate for the data you
analyzed. I can select the chart options during the analysis.
3. Identify any differences that may exist between male and female respondents, those who
would definitely recommend/not recommend, and the different satisfaction levels.
Differences between Male and Female respondents
In order to answer this question, we need to split the file into gender.
First, we go to Data/Split File
Select Compare Groups
Move the GENDER variable to the Groups Based on Window
Click OK
Now, we analyze the information based on the statement from question 1.
Analyze/Descriptive Statistics/Frequencies
Move X1 and X3 to the Variable(s) window
Click on the block Display Frequency Tables
Click Statistics
From the Central Tendency window select Mean, Median, Mode.
From the Dispersion window, select SD
At this point, we are not going to develop any charts.
Click OK
Paraphrase This Document
Need a fresh take? Get an instant paraphrase of this document with our AI Paraphraser
MKT 220 E&I Chapter 11
Basic Data Analysis for Quantitative Research
(Deli Depot)
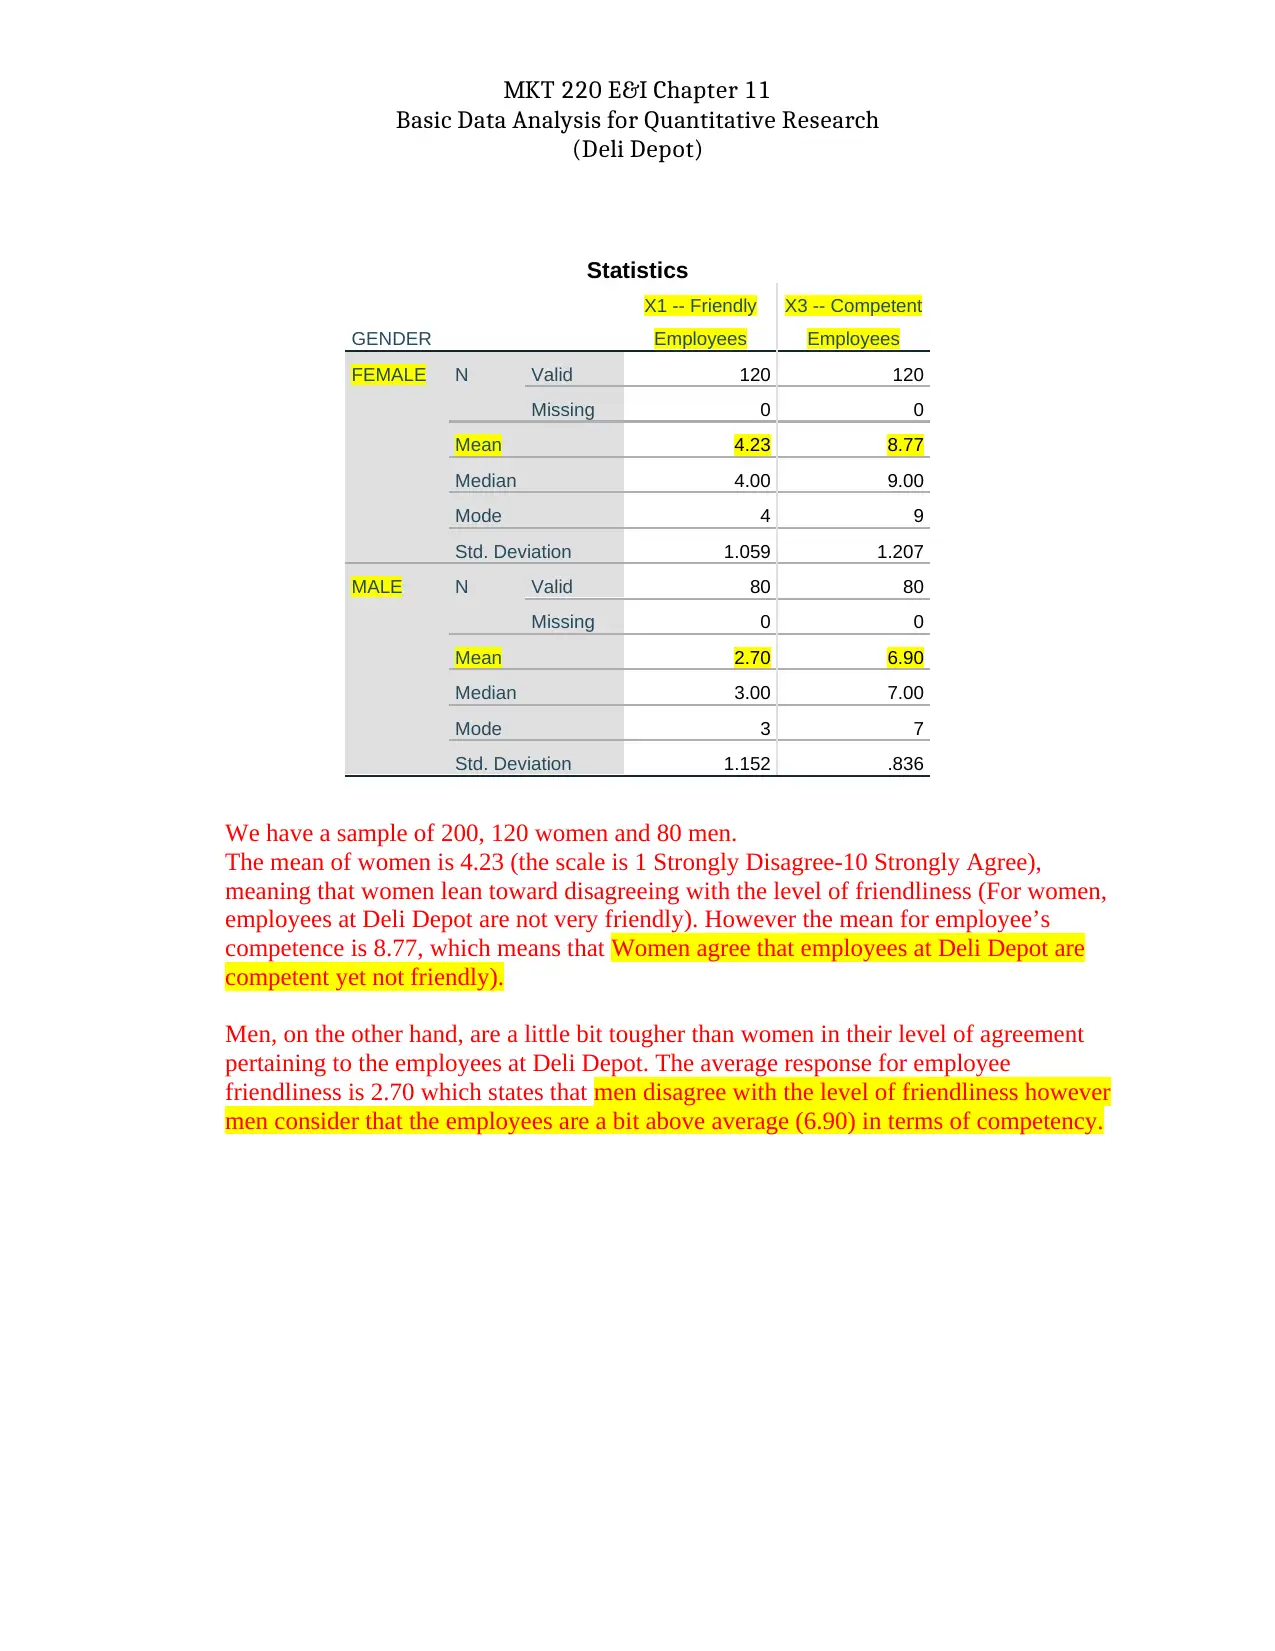
Statistics
GENDER
X1 -- Friendly
Employees
X3 -- Competent
Employees
FEMALE N Valid 120 120
Missing 0 0
Mean 4.23 8.77
Median 4.00 9.00
Mode 4 9
Std. Deviation 1.059 1.207
MALE N Valid 80 80
Missing 0 0
Mean 2.70 6.90
Median 3.00 7.00
Mode 3 7
Std. Deviation 1.152 .836
We have a sample of 200, 120 women and 80 men.
The mean of women is 4.23 (the scale is 1 Strongly Disagree-10 Strongly Agree),
meaning that women lean toward disagreeing with the level of friendliness (For women,
employees at Deli Depot are not very friendly). However the mean for employee’s
competence is 8.77, which means that Women agree that employees at Deli Depot are
competent yet not friendly).
Men, on the other hand, are a little bit tougher than women in their level of agreement
pertaining to the employees at Deli Depot. The average response for employee
friendliness is 2.70 which states that men disagree with the level of friendliness however
men consider that the employees are a bit above average (6.90) in terms of competency.
Basic Data Analysis for Quantitative Research
(Deli Depot)
Statistics
GENDER
X1 -- Friendly
Employees
X3 -- Competent
Employees
FEMALE N Valid 120 120
Missing 0 0
Mean 4.23 8.77
Median 4.00 9.00
Mode 4 9
Std. Deviation 1.059 1.207
MALE N Valid 80 80
Missing 0 0
Mean 2.70 6.90
Median 3.00 7.00
Mode 3 7
Std. Deviation 1.152 .836
We have a sample of 200, 120 women and 80 men.
The mean of women is 4.23 (the scale is 1 Strongly Disagree-10 Strongly Agree),
meaning that women lean toward disagreeing with the level of friendliness (For women,
employees at Deli Depot are not very friendly). However the mean for employee’s
competence is 8.77, which means that Women agree that employees at Deli Depot are
competent yet not friendly).
Men, on the other hand, are a little bit tougher than women in their level of agreement
pertaining to the employees at Deli Depot. The average response for employee
friendliness is 2.70 which states that men disagree with the level of friendliness however
men consider that the employees are a bit above average (6.90) in terms of competency.
MKT 220 E&I Chapter 11
Basic Data Analysis for Quantitative Research
(Deli Depot)
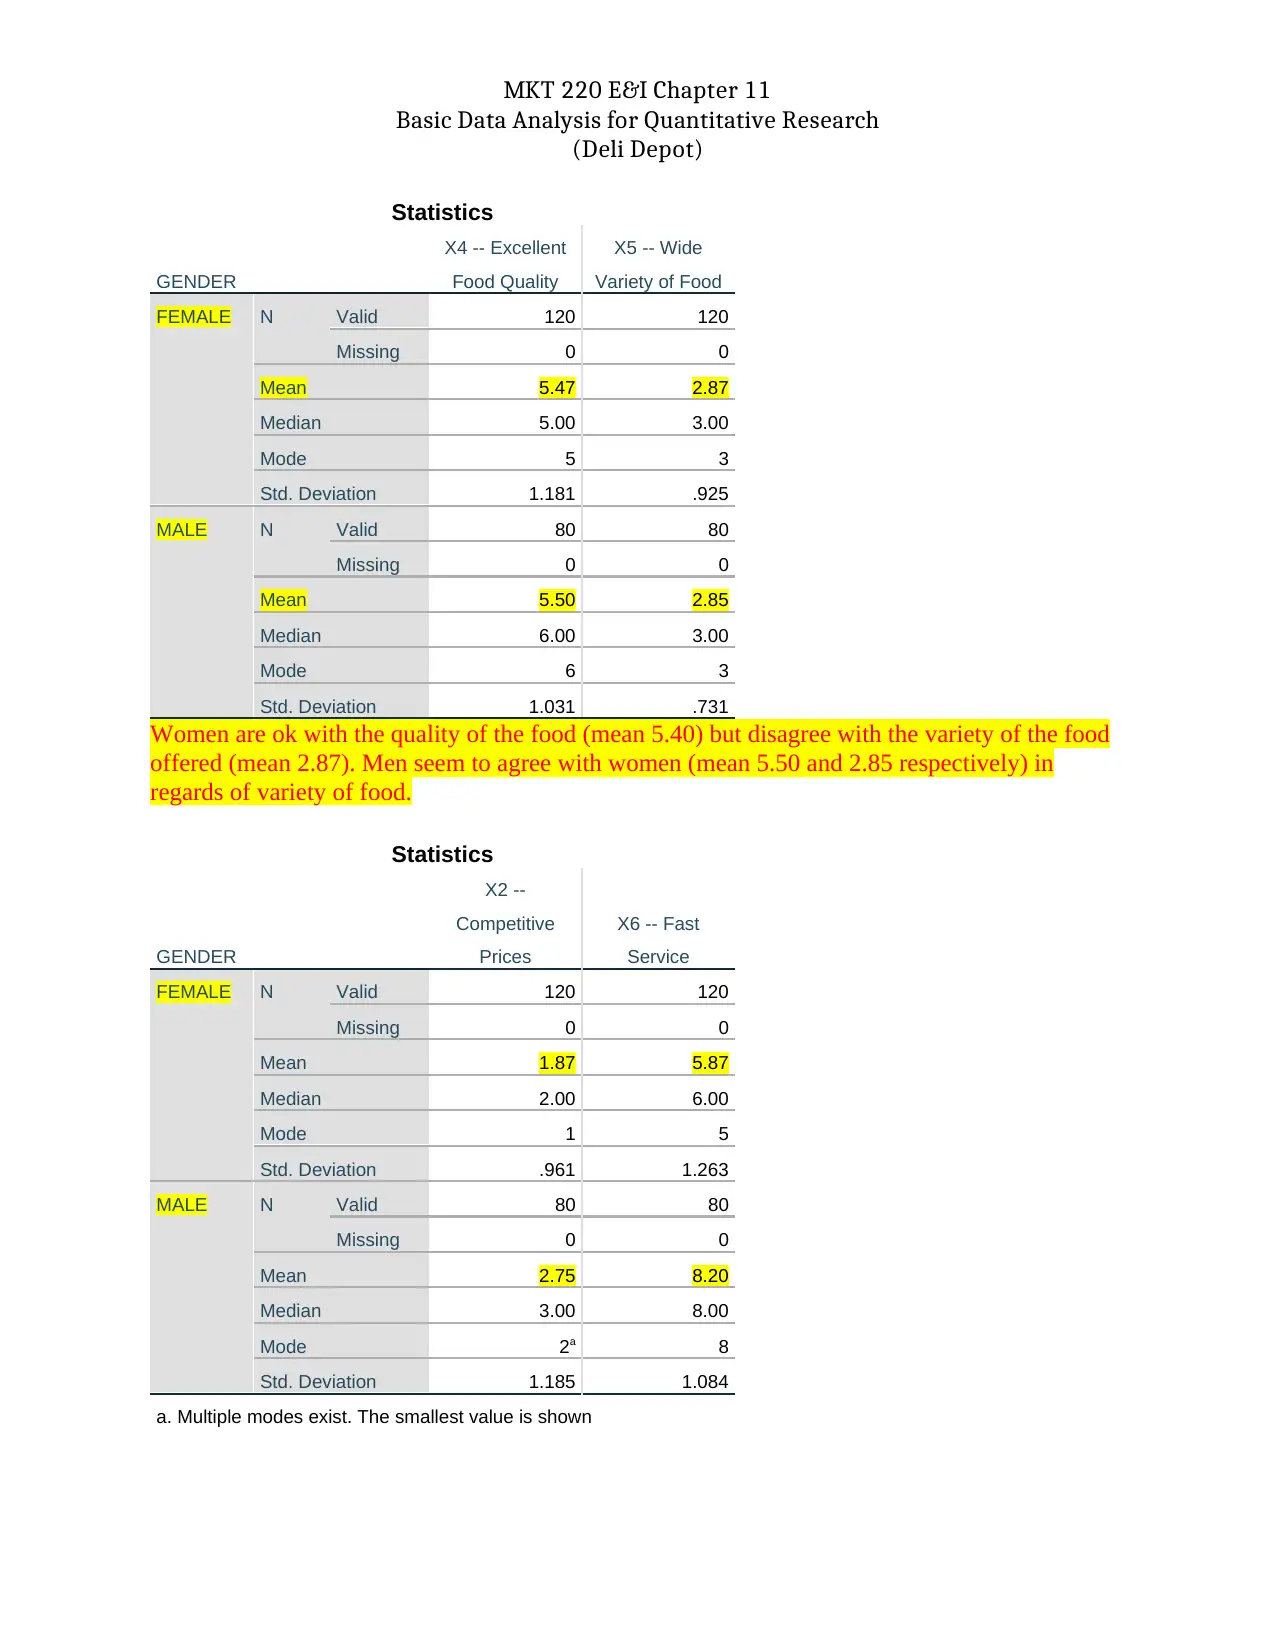
Statistics
GENDER
X4 -- Excellent
Food Quality
X5 -- Wide
Variety of Food
FEMALE N Valid 120 120
Missing 0 0
Mean 5.47 2.87
Median 5.00 3.00
Mode 5 3
Std. Deviation 1.181 .925
MALE N Valid 80 80
Missing 0 0
Mean 5.50 2.85
Median 6.00 3.00
Mode 6 3
Std. Deviation 1.031 .731
Women are ok with the quality of the food (mean 5.40) but disagree with the variety of the food
offered (mean 2.87). Men seem to agree with women (mean 5.50 and 2.85 respectively) in
regards of variety of food.
Statistics
GENDER
X2 --
Competitive
Prices
X6 -- Fast
Service
FEMALE N Valid 120 120
Missing 0 0
Mean 1.87 5.87
Median 2.00 6.00
Mode 1 5
Std. Deviation .961 1.263
MALE N Valid 80 80
Missing 0 0
Mean 2.75 8.20
Median 3.00 8.00
Mode 2a 8
Std. Deviation 1.185 1.084
a. Multiple modes exist. The smallest value is shown
Basic Data Analysis for Quantitative Research
(Deli Depot)
Statistics
GENDER
X4 -- Excellent
Food Quality
X5 -- Wide
Variety of Food
FEMALE N Valid 120 120
Missing 0 0
Mean 5.47 2.87
Median 5.00 3.00
Mode 5 3
Std. Deviation 1.181 .925
MALE N Valid 80 80
Missing 0 0
Mean 5.50 2.85
Median 6.00 3.00
Mode 6 3
Std. Deviation 1.031 .731
Women are ok with the quality of the food (mean 5.40) but disagree with the variety of the food
offered (mean 2.87). Men seem to agree with women (mean 5.50 and 2.85 respectively) in
regards of variety of food.
Statistics
GENDER
X2 --
Competitive
Prices
X6 -- Fast
Service
FEMALE N Valid 120 120
Missing 0 0
Mean 1.87 5.87
Median 2.00 6.00
Mode 1 5
Std. Deviation .961 1.263
MALE N Valid 80 80
Missing 0 0
Mean 2.75 8.20
Median 3.00 8.00
Mode 2a 8
Std. Deviation 1.185 1.084
a. Multiple modes exist. The smallest value is shown
⊘ This is a preview!⊘
Do you want full access?
Subscribe today to unlock all pages.
Trusted by 1+ million students worldwide
MKT 220 E&I Chapter 11
Basic Data Analysis for Quantitative Research
(Deli Depot)
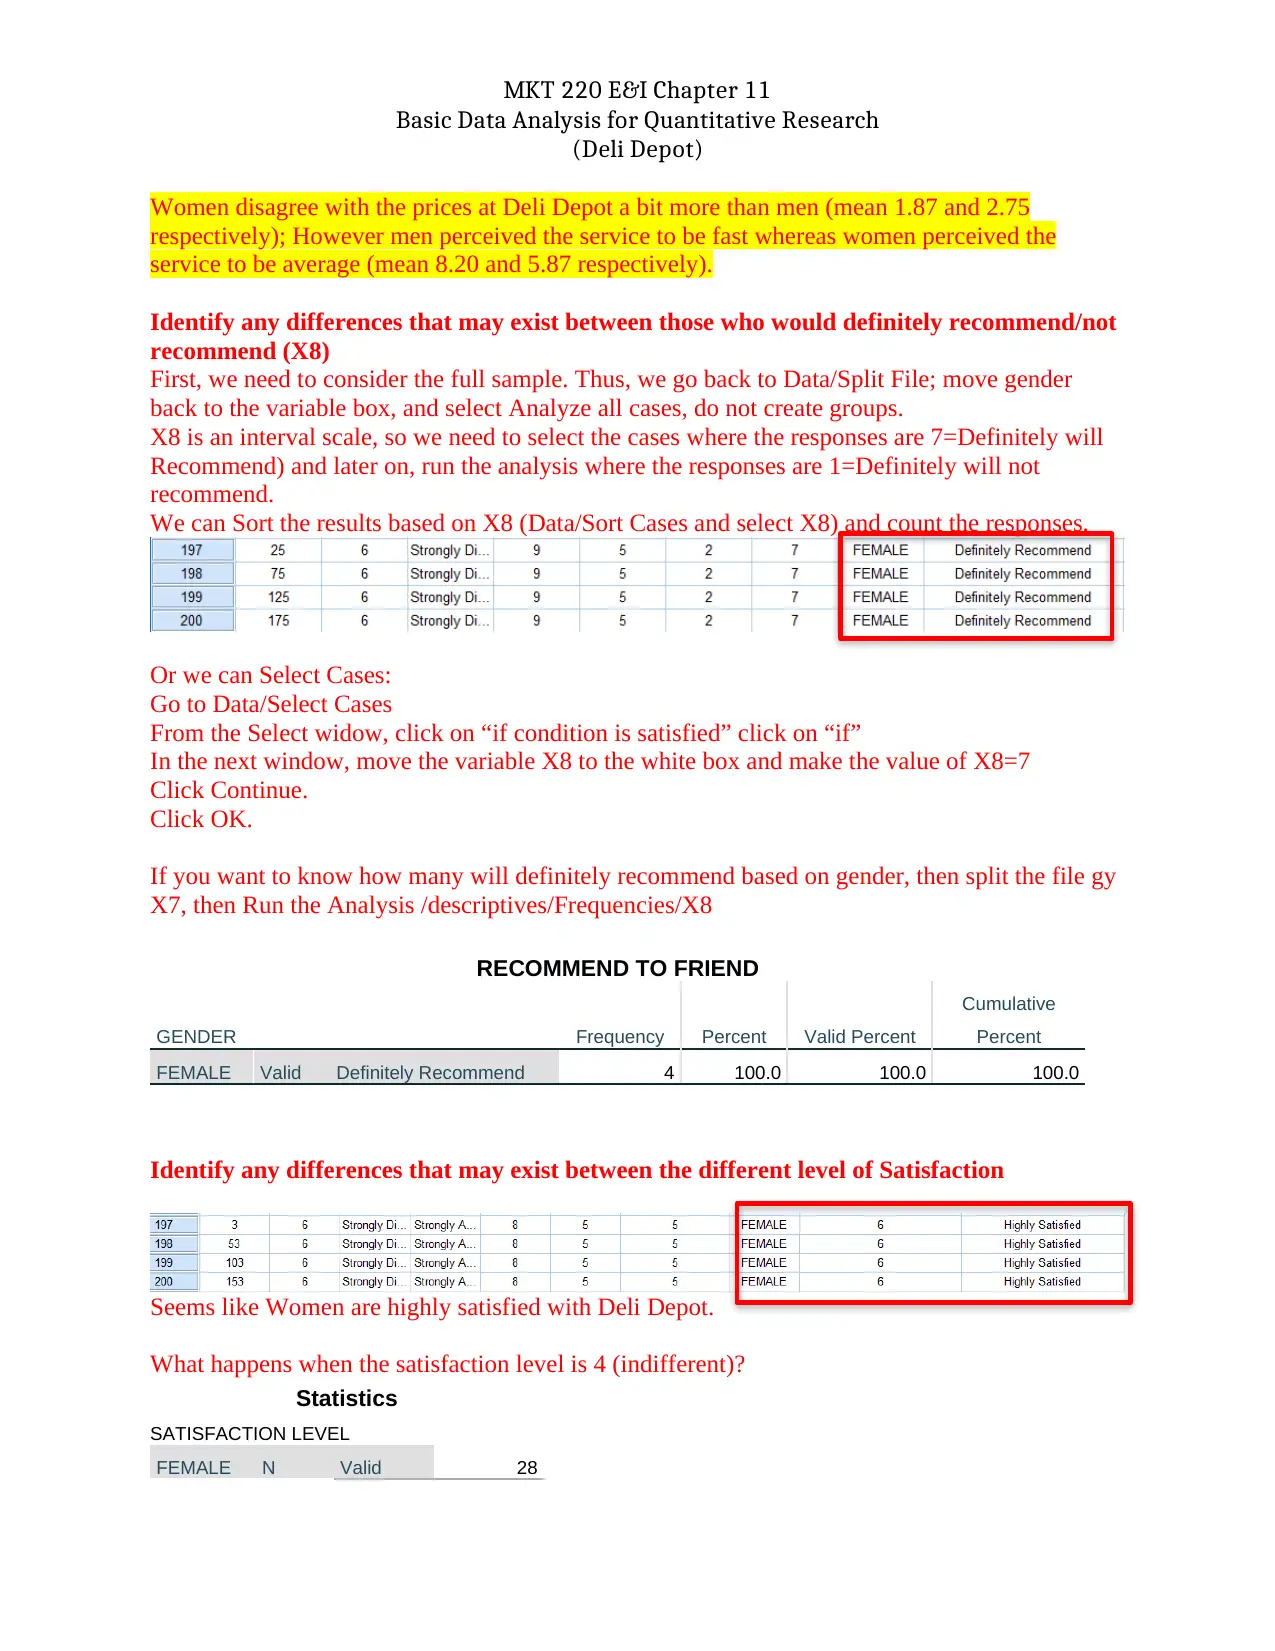
Women disagree with the prices at Deli Depot a bit more than men (mean 1.87 and 2.75
respectively); However men perceived the service to be fast whereas women perceived the
service to be average (mean 8.20 and 5.87 respectively).
Identify any differences that may exist between those who would definitely recommend/not
recommend (X8)
First, we need to consider the full sample. Thus, we go back to Data/Split File; move gender
back to the variable box, and select Analyze all cases, do not create groups.
X8 is an interval scale, so we need to select the cases where the responses are 7=Definitely will
Recommend) and later on, run the analysis where the responses are 1=Definitely will not
recommend.
We can Sort the results based on X8 (Data/Sort Cases and select X8) and count the responses.
Or we can Select Cases:
Go to Data/Select Cases
From the Select widow, click on “if condition is satisfied” click on “if”
In the next window, move the variable X8 to the white box and make the value of X8=7
Click Continue.
Click OK.
If you want to know how many will definitely recommend based on gender, then split the file gy
X7, then Run the Analysis /descriptives/Frequencies/X8
RECOMMEND TO FRIEND
GENDER Frequency Percent Valid Percent
Cumulative
Percent
FEMALE Valid Definitely Recommend 4 100.0 100.0 100.0
Identify any differences that may exist between the different level of Satisfaction
Seems like Women are highly satisfied with Deli Depot.
What happens when the satisfaction level is 4 (indifferent)?
Statistics
SATISFACTION LEVEL
FEMALE N Valid 28
Basic Data Analysis for Quantitative Research
(Deli Depot)
Women disagree with the prices at Deli Depot a bit more than men (mean 1.87 and 2.75
respectively); However men perceived the service to be fast whereas women perceived the
service to be average (mean 8.20 and 5.87 respectively).
Identify any differences that may exist between those who would definitely recommend/not
recommend (X8)
First, we need to consider the full sample. Thus, we go back to Data/Split File; move gender
back to the variable box, and select Analyze all cases, do not create groups.
X8 is an interval scale, so we need to select the cases where the responses are 7=Definitely will
Recommend) and later on, run the analysis where the responses are 1=Definitely will not
recommend.
We can Sort the results based on X8 (Data/Sort Cases and select X8) and count the responses.
Or we can Select Cases:
Go to Data/Select Cases
From the Select widow, click on “if condition is satisfied” click on “if”
In the next window, move the variable X8 to the white box and make the value of X8=7
Click Continue.
Click OK.
If you want to know how many will definitely recommend based on gender, then split the file gy
X7, then Run the Analysis /descriptives/Frequencies/X8
RECOMMEND TO FRIEND
GENDER Frequency Percent Valid Percent
Cumulative
Percent
FEMALE Valid Definitely Recommend 4 100.0 100.0 100.0
Identify any differences that may exist between the different level of Satisfaction
Seems like Women are highly satisfied with Deli Depot.
What happens when the satisfaction level is 4 (indifferent)?
Statistics
SATISFACTION LEVEL
FEMALE N Valid 28
Paraphrase This Document
Need a fresh take? Get an instant paraphrase of this document with our AI Paraphraser
MKT 220 E&I Chapter 11
Basic Data Analysis for Quantitative Research
(Deli Depot)
Missing 0
MALE N Valid 36
Missing 0
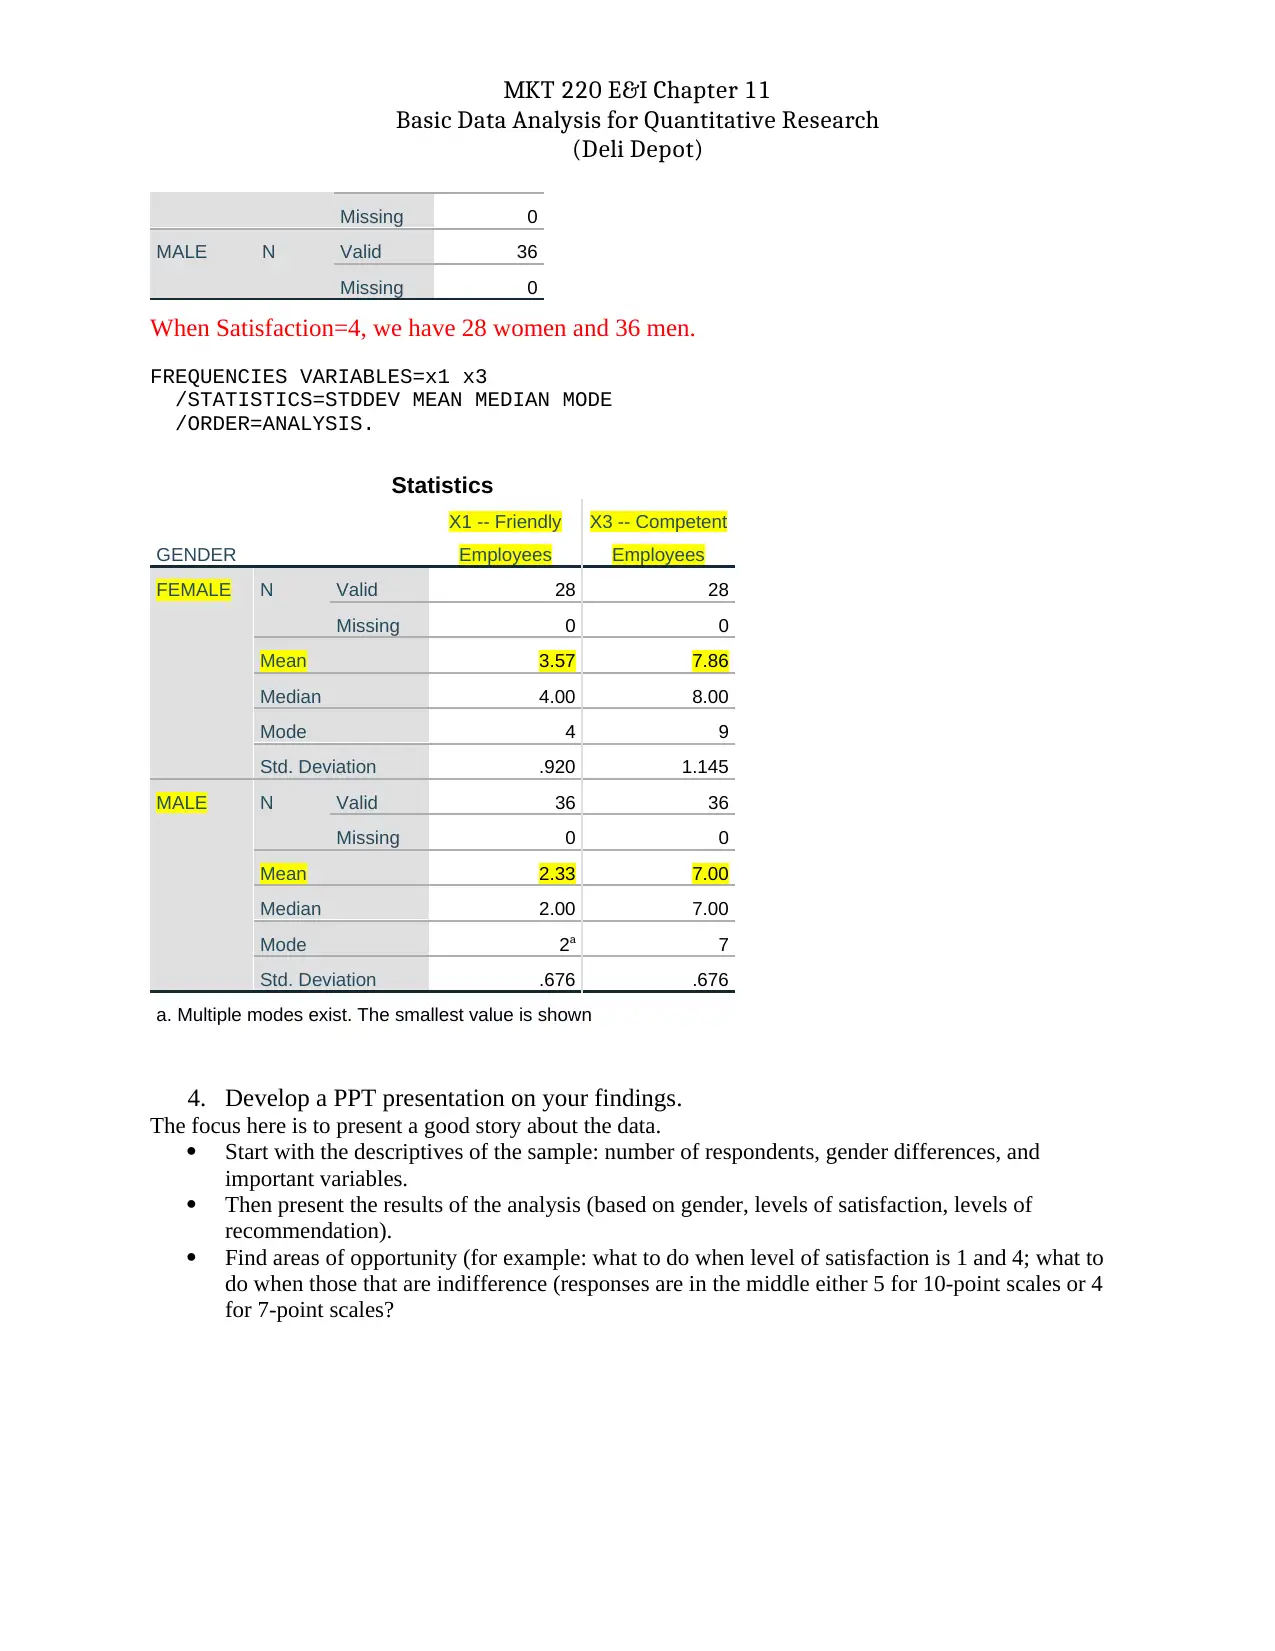
When Satisfaction=4, we have 28 women and 36 men.
FREQUENCIES VARIABLES=x1 x3
/STATISTICS=STDDEV MEAN MEDIAN MODE
/ORDER=ANALYSIS.
Statistics
GENDER
X1 -- Friendly
Employees
X3 -- Competent
Employees
FEMALE N Valid 28 28
Missing 0 0
Mean 3.57 7.86
Median 4.00 8.00
Mode 4 9
Std. Deviation .920 1.145
MALE N Valid 36 36
Missing 0 0
Mean 2.33 7.00
Median 2.00 7.00
Mode 2a 7
Std. Deviation .676 .676
a. Multiple modes exist. The smallest value is shown
4. Develop a PPT presentation on your findings.
The focus here is to present a good story about the data.
Start with the descriptives of the sample: number of respondents, gender differences, and
important variables.
Then present the results of the analysis (based on gender, levels of satisfaction, levels of
recommendation).
Find areas of opportunity (for example: what to do when level of satisfaction is 1 and 4; what to
do when those that are indifference (responses are in the middle either 5 for 10-point scales or 4
for 7-point scales?
Basic Data Analysis for Quantitative Research
(Deli Depot)
Missing 0
MALE N Valid 36
Missing 0
When Satisfaction=4, we have 28 women and 36 men.
FREQUENCIES VARIABLES=x1 x3
/STATISTICS=STDDEV MEAN MEDIAN MODE
/ORDER=ANALYSIS.
Statistics
GENDER
X1 -- Friendly
Employees
X3 -- Competent
Employees
FEMALE N Valid 28 28
Missing 0 0
Mean 3.57 7.86
Median 4.00 8.00
Mode 4 9
Std. Deviation .920 1.145
MALE N Valid 36 36
Missing 0 0
Mean 2.33 7.00
Median 2.00 7.00
Mode 2a 7
Std. Deviation .676 .676
a. Multiple modes exist. The smallest value is shown
4. Develop a PPT presentation on your findings.
The focus here is to present a good story about the data.
Start with the descriptives of the sample: number of respondents, gender differences, and
important variables.
Then present the results of the analysis (based on gender, levels of satisfaction, levels of
recommendation).
Find areas of opportunity (for example: what to do when level of satisfaction is 1 and 4; what to
do when those that are indifference (responses are in the middle either 5 for 10-point scales or 4
for 7-point scales?
MKT 220 E&I Chapter 11
Basic Data Analysis for Quantitative Research
(Deli Depot)
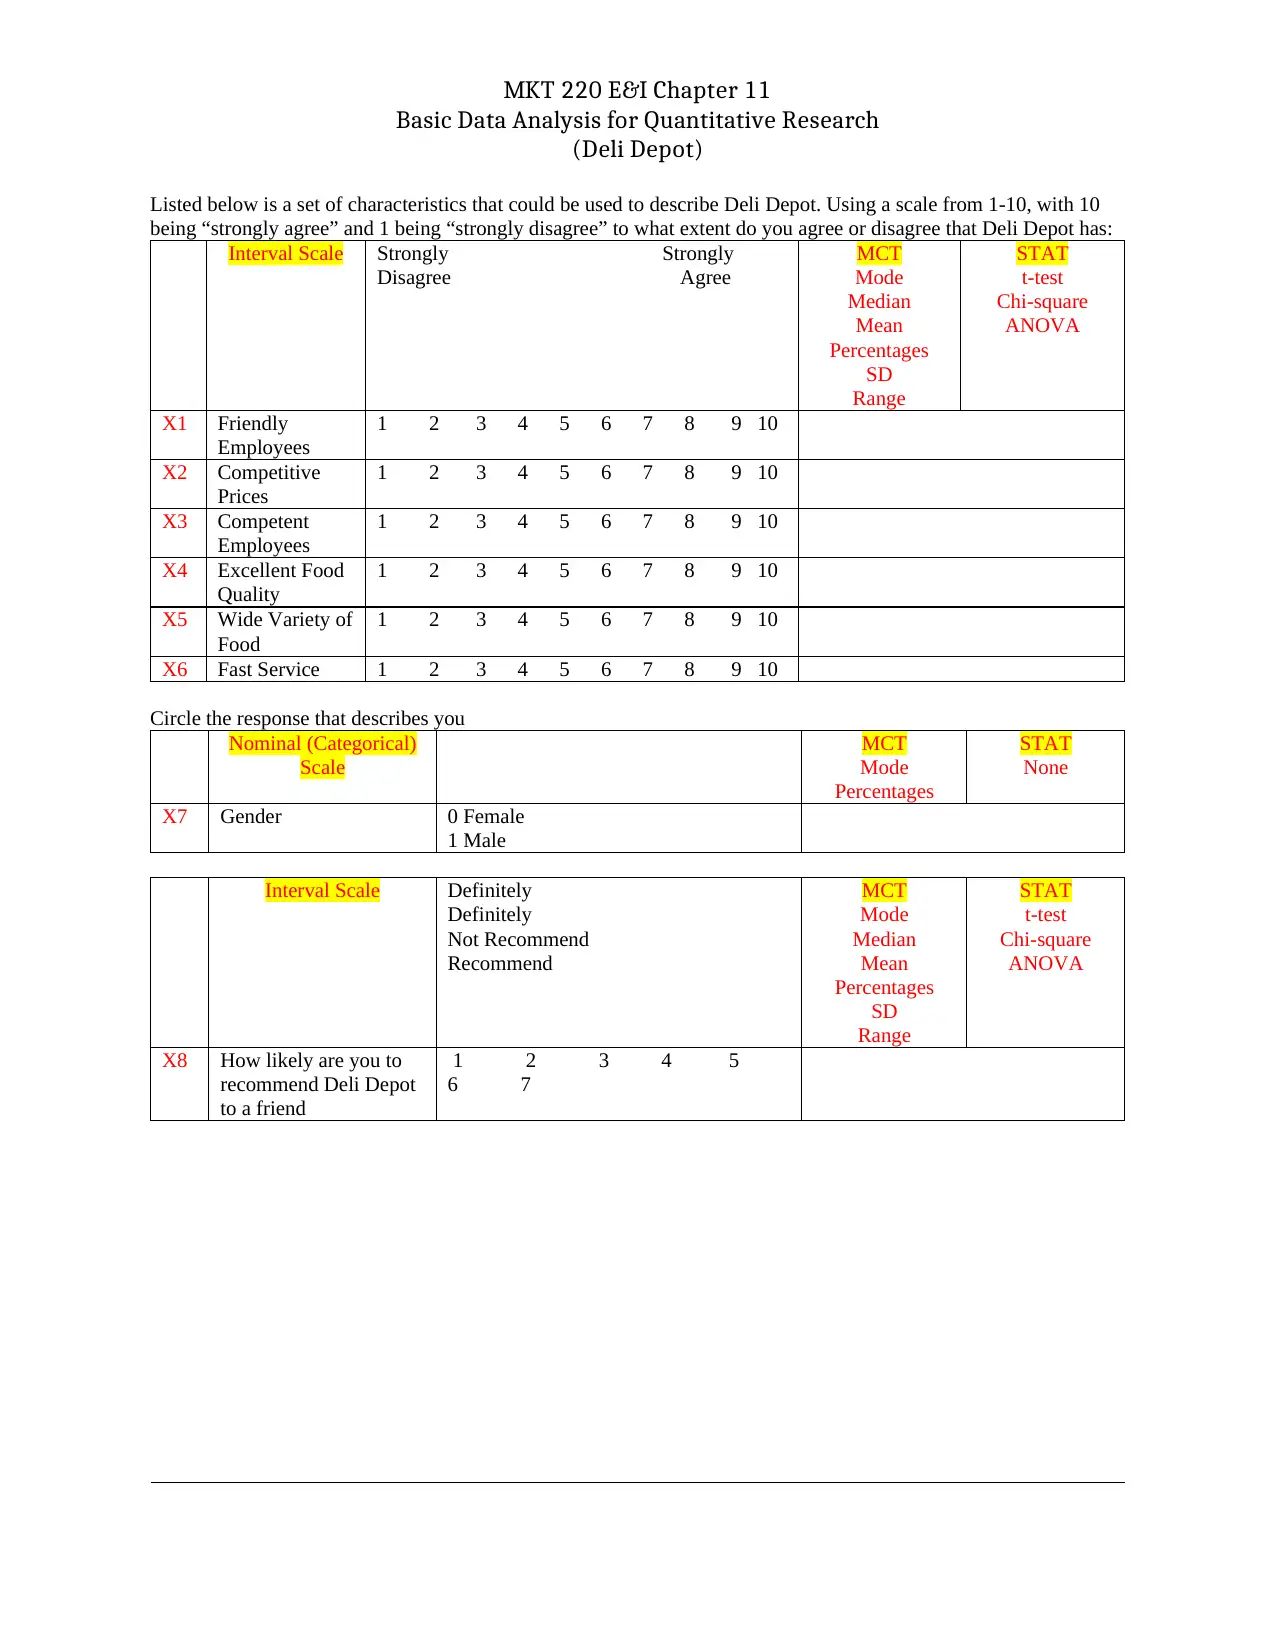
Listed below is a set of characteristics that could be used to describe Deli Depot. Using a scale from 1-10, with 10
being “strongly agree” and 1 being “strongly disagree” to what extent do you agree or disagree that Deli Depot has:
Interval Scale Strongly Strongly
Disagree Agree
MCT
Mode
Median
Mean
Percentages
SD
Range
STAT
t-test
Chi-square
ANOVA
X1 Friendly
Employees
1 2 3 4 5 6 7 8 9 10
X2 Competitive
Prices
1 2 3 4 5 6 7 8 9 10
X3 Competent
Employees
1 2 3 4 5 6 7 8 9 10
X4 Excellent Food
Quality
1 2 3 4 5 6 7 8 9 10
X5 Wide Variety of
Food
1 2 3 4 5 6 7 8 9 10
X6 Fast Service 1 2 3 4 5 6 7 8 9 10
Circle the response that describes you
Nominal (Categorical)
Scale
MCT
Mode
Percentages
STAT
None
X7 Gender 0 Female
1 Male
Interval Scale Definitely
Definitely
Not Recommend
Recommend
MCT
Mode
Median
Mean
Percentages
SD
Range
STAT
t-test
Chi-square
ANOVA
X8 How likely are you to
recommend Deli Depot
to a friend
1 2 3 4 5
6 7
Basic Data Analysis for Quantitative Research
(Deli Depot)
Listed below is a set of characteristics that could be used to describe Deli Depot. Using a scale from 1-10, with 10
being “strongly agree” and 1 being “strongly disagree” to what extent do you agree or disagree that Deli Depot has:
Interval Scale Strongly Strongly
Disagree Agree
MCT
Mode
Median
Mean
Percentages
SD
Range
STAT
t-test
Chi-square
ANOVA
X1 Friendly
Employees
1 2 3 4 5 6 7 8 9 10
X2 Competitive
Prices
1 2 3 4 5 6 7 8 9 10
X3 Competent
Employees
1 2 3 4 5 6 7 8 9 10
X4 Excellent Food
Quality
1 2 3 4 5 6 7 8 9 10
X5 Wide Variety of
Food
1 2 3 4 5 6 7 8 9 10
X6 Fast Service 1 2 3 4 5 6 7 8 9 10
Circle the response that describes you
Nominal (Categorical)
Scale
MCT
Mode
Percentages
STAT
None
X7 Gender 0 Female
1 Male
Interval Scale Definitely
Definitely
Not Recommend
Recommend
MCT
Mode
Median
Mean
Percentages
SD
Range
STAT
t-test
Chi-square
ANOVA
X8 How likely are you to
recommend Deli Depot
to a friend
1 2 3 4 5
6 7
⊘ This is a preview!⊘
Do you want full access?
Subscribe today to unlock all pages.
Trusted by 1+ million students worldwide
MKT 220 E&I Chapter 11
Basic Data Analysis for Quantitative Research
(Deli Depot)
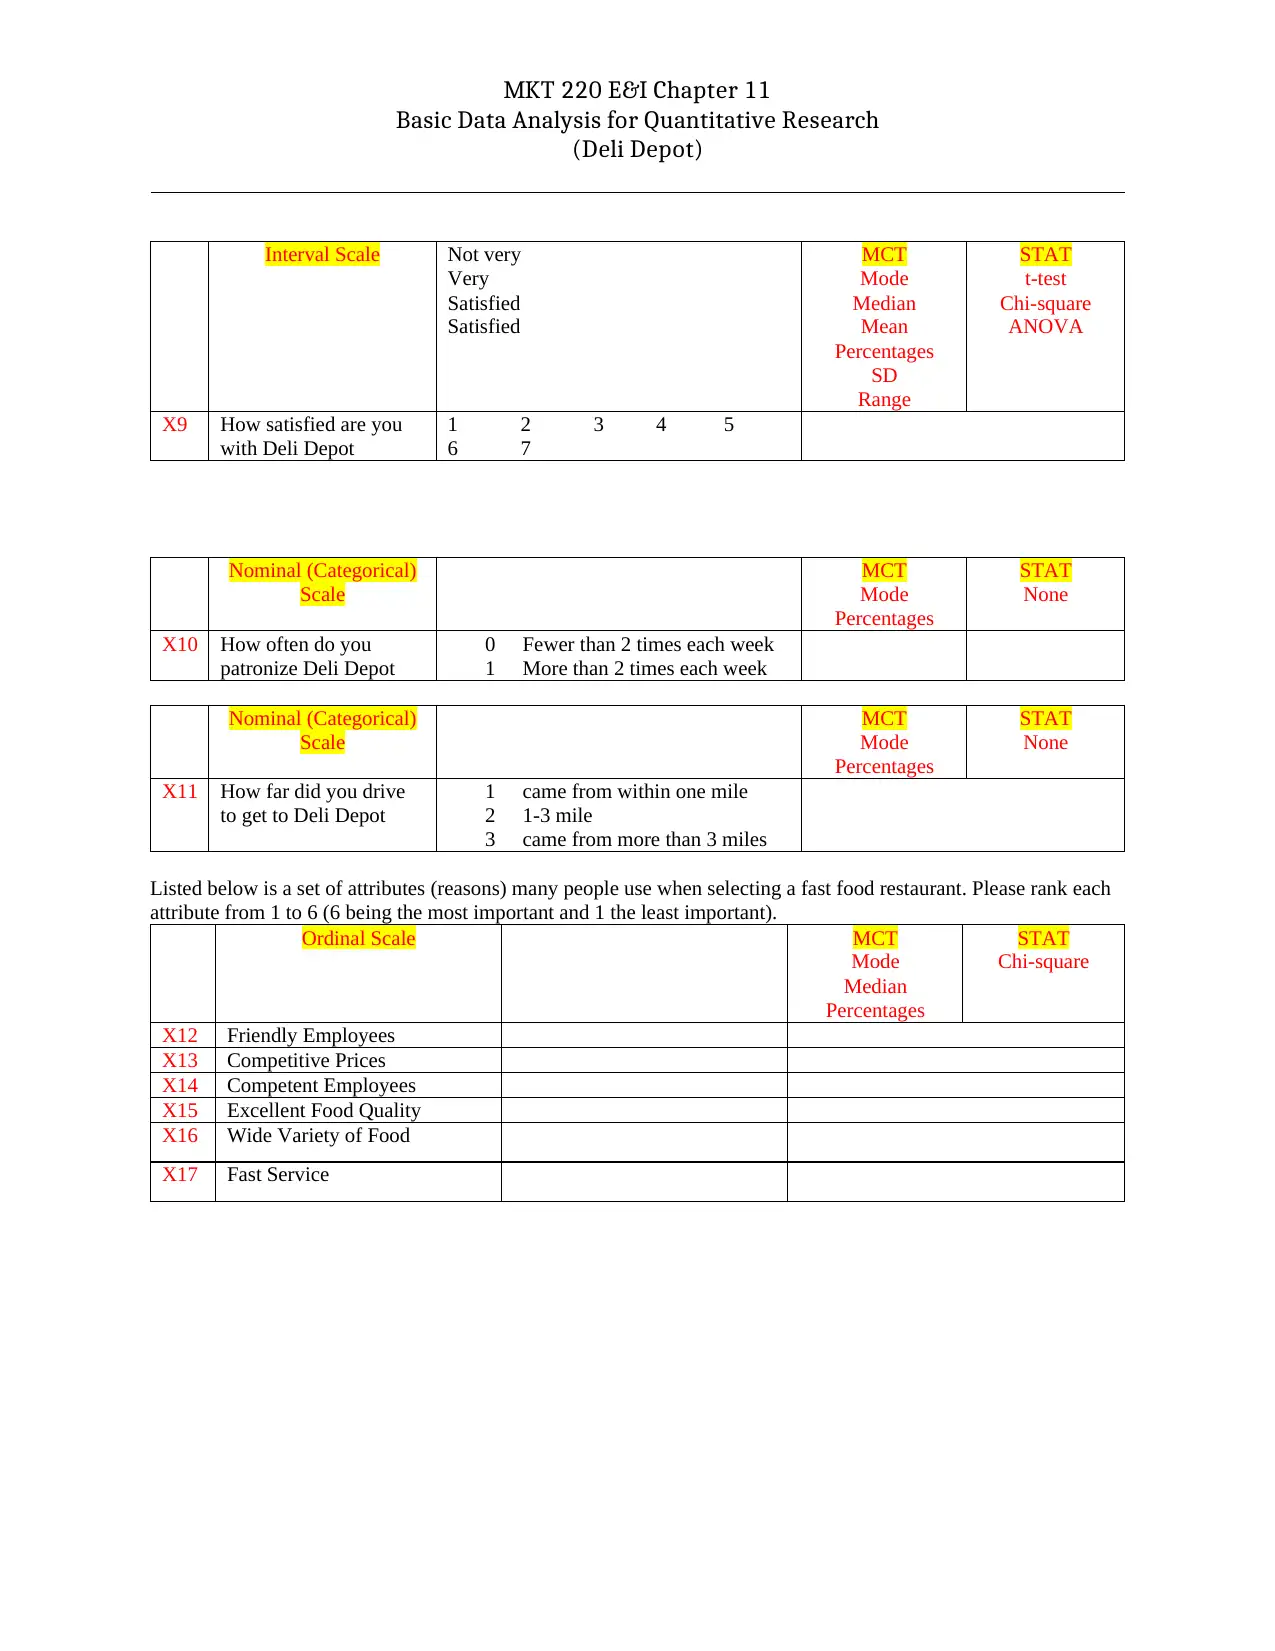
Interval Scale Not very
Very
Satisfied
Satisfied
MCT
Mode
Median
Mean
Percentages
SD
Range
STAT
t-test
Chi-square
ANOVA
X9 How satisfied are you
with Deli Depot
1 2 3 4 5
6 7
Nominal (Categorical)
Scale
MCT
Mode
Percentages
STAT
None
X10 How often do you
patronize Deli Depot
0 Fewer than 2 times each week
1 More than 2 times each week
Nominal (Categorical)
Scale
MCT
Mode
Percentages
STAT
None
X11 How far did you drive
to get to Deli Depot
1 came from within one mile
2 1-3 mile
3 came from more than 3 miles
Listed below is a set of attributes (reasons) many people use when selecting a fast food restaurant. Please rank each
attribute from 1 to 6 (6 being the most important and 1 the least important).
Ordinal Scale MCT
Mode
Median
Percentages
STAT
Chi-square
X12 Friendly Employees
X13 Competitive Prices
X14 Competent Employees
X15 Excellent Food Quality
X16 Wide Variety of Food
X17 Fast Service
Basic Data Analysis for Quantitative Research
(Deli Depot)
Interval Scale Not very
Very
Satisfied
Satisfied
MCT
Mode
Median
Mean
Percentages
SD
Range
STAT
t-test
Chi-square
ANOVA
X9 How satisfied are you
with Deli Depot
1 2 3 4 5
6 7
Nominal (Categorical)
Scale
MCT
Mode
Percentages
STAT
None
X10 How often do you
patronize Deli Depot
0 Fewer than 2 times each week
1 More than 2 times each week
Nominal (Categorical)
Scale
MCT
Mode
Percentages
STAT
None
X11 How far did you drive
to get to Deli Depot
1 came from within one mile
2 1-3 mile
3 came from more than 3 miles
Listed below is a set of attributes (reasons) many people use when selecting a fast food restaurant. Please rank each
attribute from 1 to 6 (6 being the most important and 1 the least important).
Ordinal Scale MCT
Mode
Median
Percentages
STAT
Chi-square
X12 Friendly Employees
X13 Competitive Prices
X14 Competent Employees
X15 Excellent Food Quality
X16 Wide Variety of Food
X17 Fast Service
1 out of 7
Your All-in-One AI-Powered Toolkit for Academic Success.
+13062052269
info@desklib.com
Available 24*7 on WhatsApp / Email
![[object Object]](/_next/static/media/star-bottom.7253800d.svg)
Unlock your academic potential
Copyright © 2020–2026 A2Z Services. All Rights Reserved. Developed and managed by ZUCOL.