Modelling Per Capita GDP - PDF
Added on 2020-05-11
16 Pages2236 Words46 Views
Modelling Per Capita GDP (US$) 1
PER CAPITA GDP (US$)
POPULATION PERCENTAGE HAVING ACCESS TO ELECTRICITY
POPULATION PERCENTAGE WITHIN THE RANGE 15 – 64 YEARS OLD
INFLATION, CONSUMER PRICES (% ANNUAL)
Name
Course Number
Date
Faculty Name
PER CAPITA GDP (US$)
POPULATION PERCENTAGE HAVING ACCESS TO ELECTRICITY
POPULATION PERCENTAGE WITHIN THE RANGE 15 – 64 YEARS OLD
INFLATION, CONSUMER PRICES (% ANNUAL)
Name
Course Number
Date
Faculty Name
Modelling Per Capita GDP (US$) 2
Modelling Per Capita GDP (US$)
1. Task 1 – Introduction
Per capita GDP is a statistical measure of Country’s growth, which is calculated using the gross
domestic product and population size in a specified period. It is a good measure to the compared
growth of a country over the other. This paper will focus on predicting this measure through a linear
model by using four other indicators. These indicators include; population with access to electricity
(percentage), the percentage of population between 15-64 years, annual percentage of inflation for
consumer prices and a dummy variable measuring whether a country is a member of WTO or GATT
member. Multiple regression models will be used to predict the Per capita GDP using the stated
independent variables. These predictor variables have been used in this model because it is presumed
that they are correlated to the general growth of a country. A better-performing country will have
higher per capita GDP compared to those which have poor growth.
1.1 Variables
Response variable (Y) – Per Capita GDP (US$)
Predictor variables: -
X1 – Access to electricity (percent of total population)
X2 – Population percentage between 15-64 years
X3 – Inflation consumer prices (annual percentage)
X4 – dummy variable. < 1 – Have been both a WTO and GATT member >, < 0 – Either only A
WTO member or not at all > (Data.worldbank.org, 2017).
Modelling Per Capita GDP (US$) 3
1.2 Priori signs for the coefficients
I would expect that X1 – access to electricity is accompanied by a positive coefficient because
the presence of reliable power improves innovation and production.
Countries with a higher population between 15 and 64 years are expected to have better growth
because this is a productive age group. Expecting a positive coefficient.
High inflation on consumer prices is associated with poor GDP growth because inflation
deteriorates the economy. Expecting a negative sign for X3.
Members of world trade organization have better platforms to do business. Expecting a positive
sign for the X4 coefficient.
2. Task 2 – Correlation plots
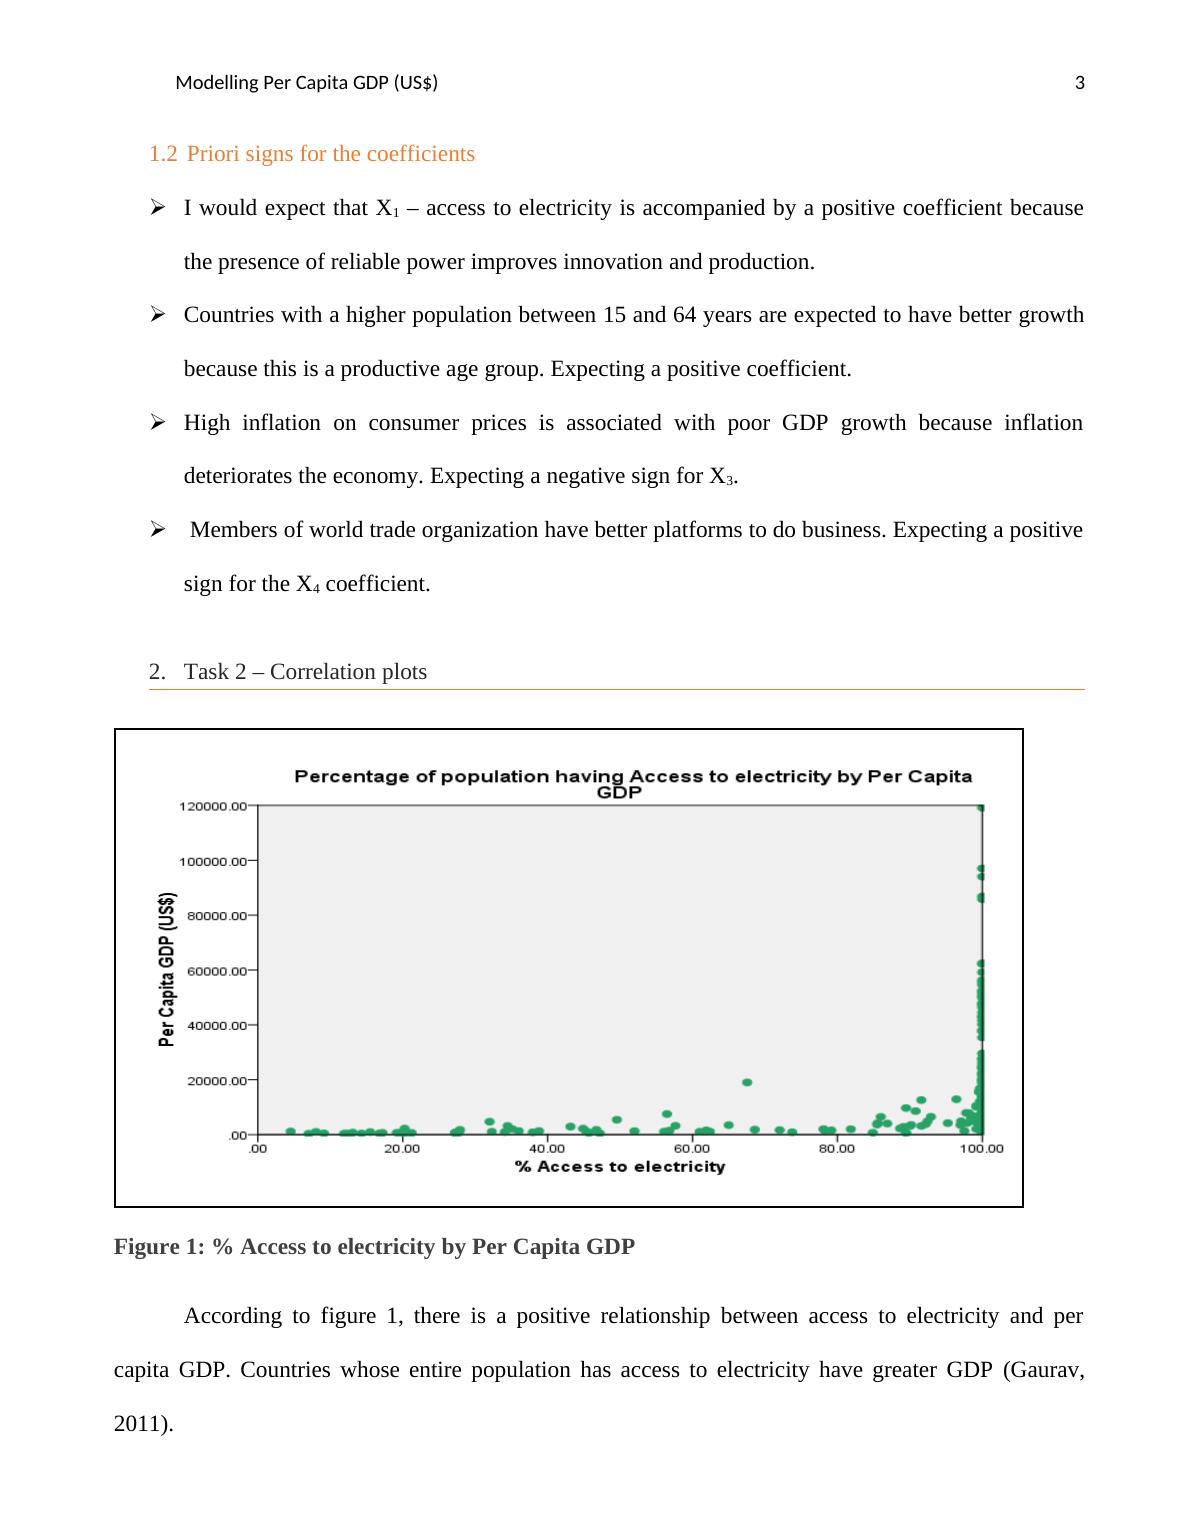
Figure 1: % Access to electricity by Per Capita GDP
According to figure 1, there is a positive relationship between access to electricity and per
capita GDP. Countries whose entire population has access to electricity have greater GDP (Gaurav,
2011).
1.2 Priori signs for the coefficients
I would expect that X1 – access to electricity is accompanied by a positive coefficient because
the presence of reliable power improves innovation and production.
Countries with a higher population between 15 and 64 years are expected to have better growth
because this is a productive age group. Expecting a positive coefficient.
High inflation on consumer prices is associated with poor GDP growth because inflation
deteriorates the economy. Expecting a negative sign for X3.
Members of world trade organization have better platforms to do business. Expecting a positive
sign for the X4 coefficient.
2. Task 2 – Correlation plots
Figure 1: % Access to electricity by Per Capita GDP
According to figure 1, there is a positive relationship between access to electricity and per
capita GDP. Countries whose entire population has access to electricity have greater GDP (Gaurav,
2011).
Modelling Per Capita GDP (US$) 4
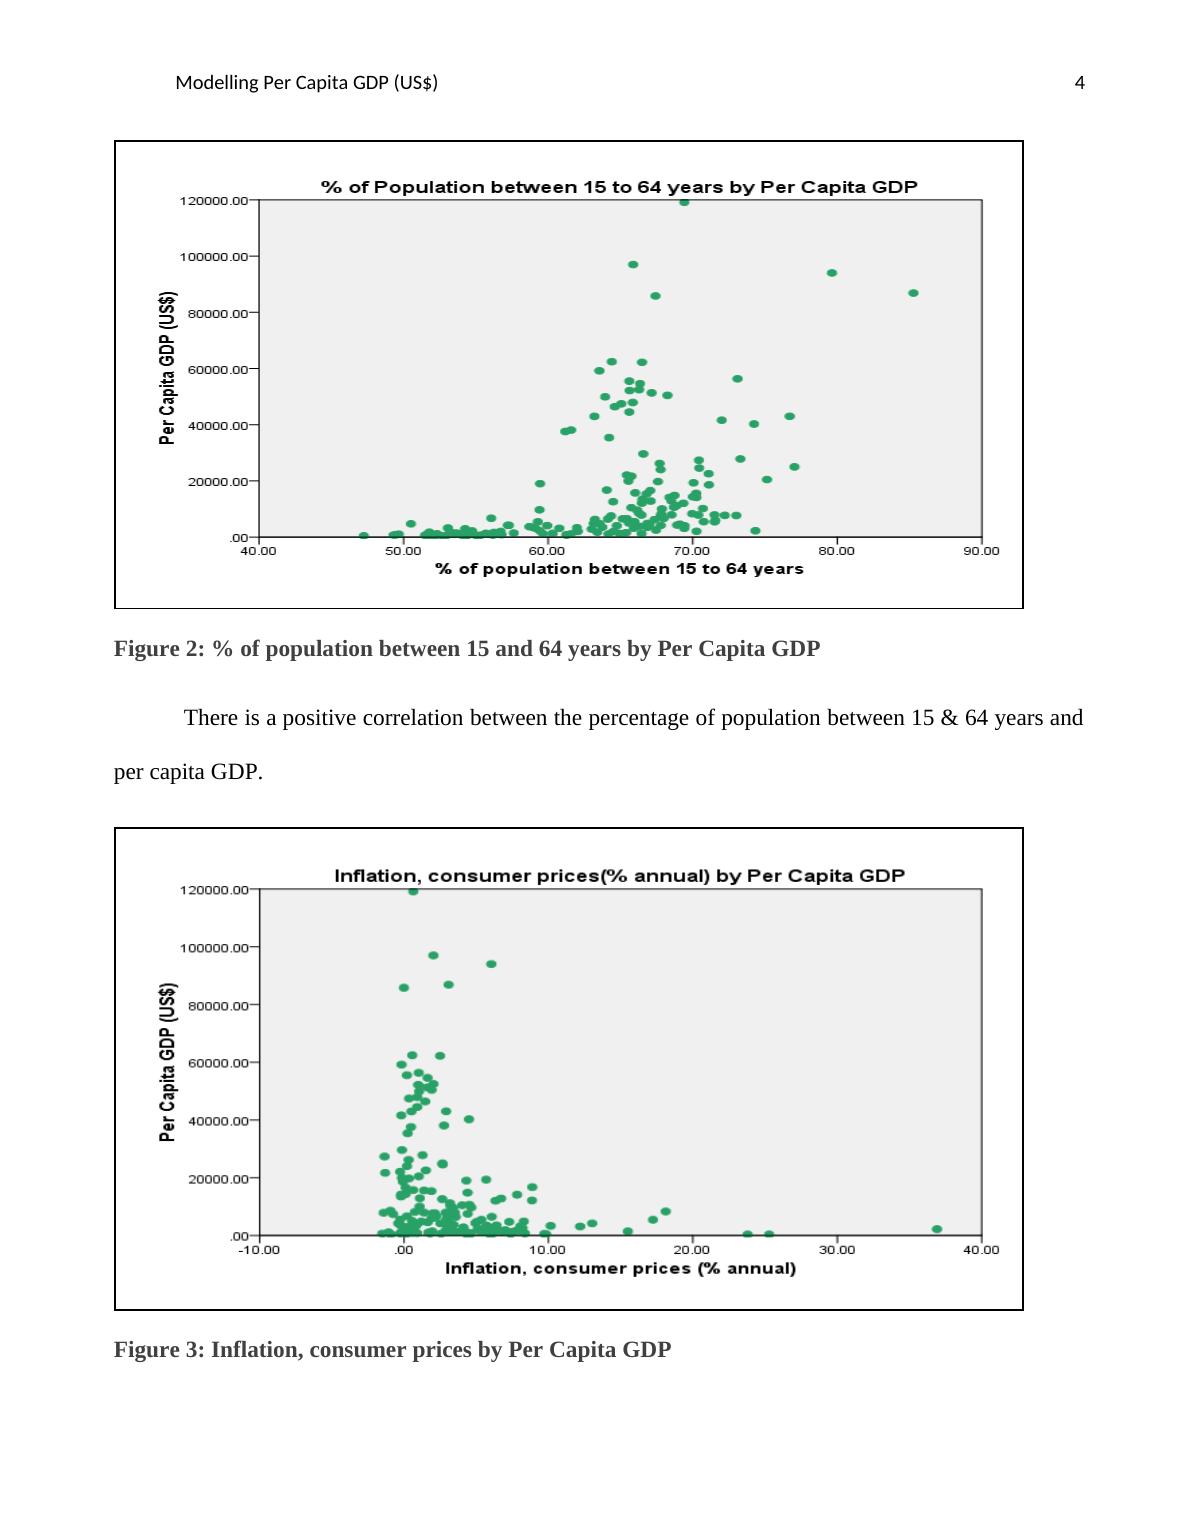
Figure 2: % of population between 15 and 64 years by Per Capita GDP
There is a positive correlation between the percentage of population between 15 & 64 years and
per capita GDP.
Figure 3: Inflation, consumer prices by Per Capita GDP
Figure 2: % of population between 15 and 64 years by Per Capita GDP
There is a positive correlation between the percentage of population between 15 & 64 years and
per capita GDP.
Figure 3: Inflation, consumer prices by Per Capita GDP
End of preview
Want to access all the pages? Upload your documents or become a member.
Related Documents
An Economic Growth Analysis of Singaporelg...
|17
|3111
|213
Trade Openness and its Impact on GDP per Capita: A Comparative Study of USA and Lao PDRlg...
|5
|927
|199