Module 3 Discussion: Bell Curve and Probability Analysis

Verified

Added on  2019/09/23

|1
|361
|80
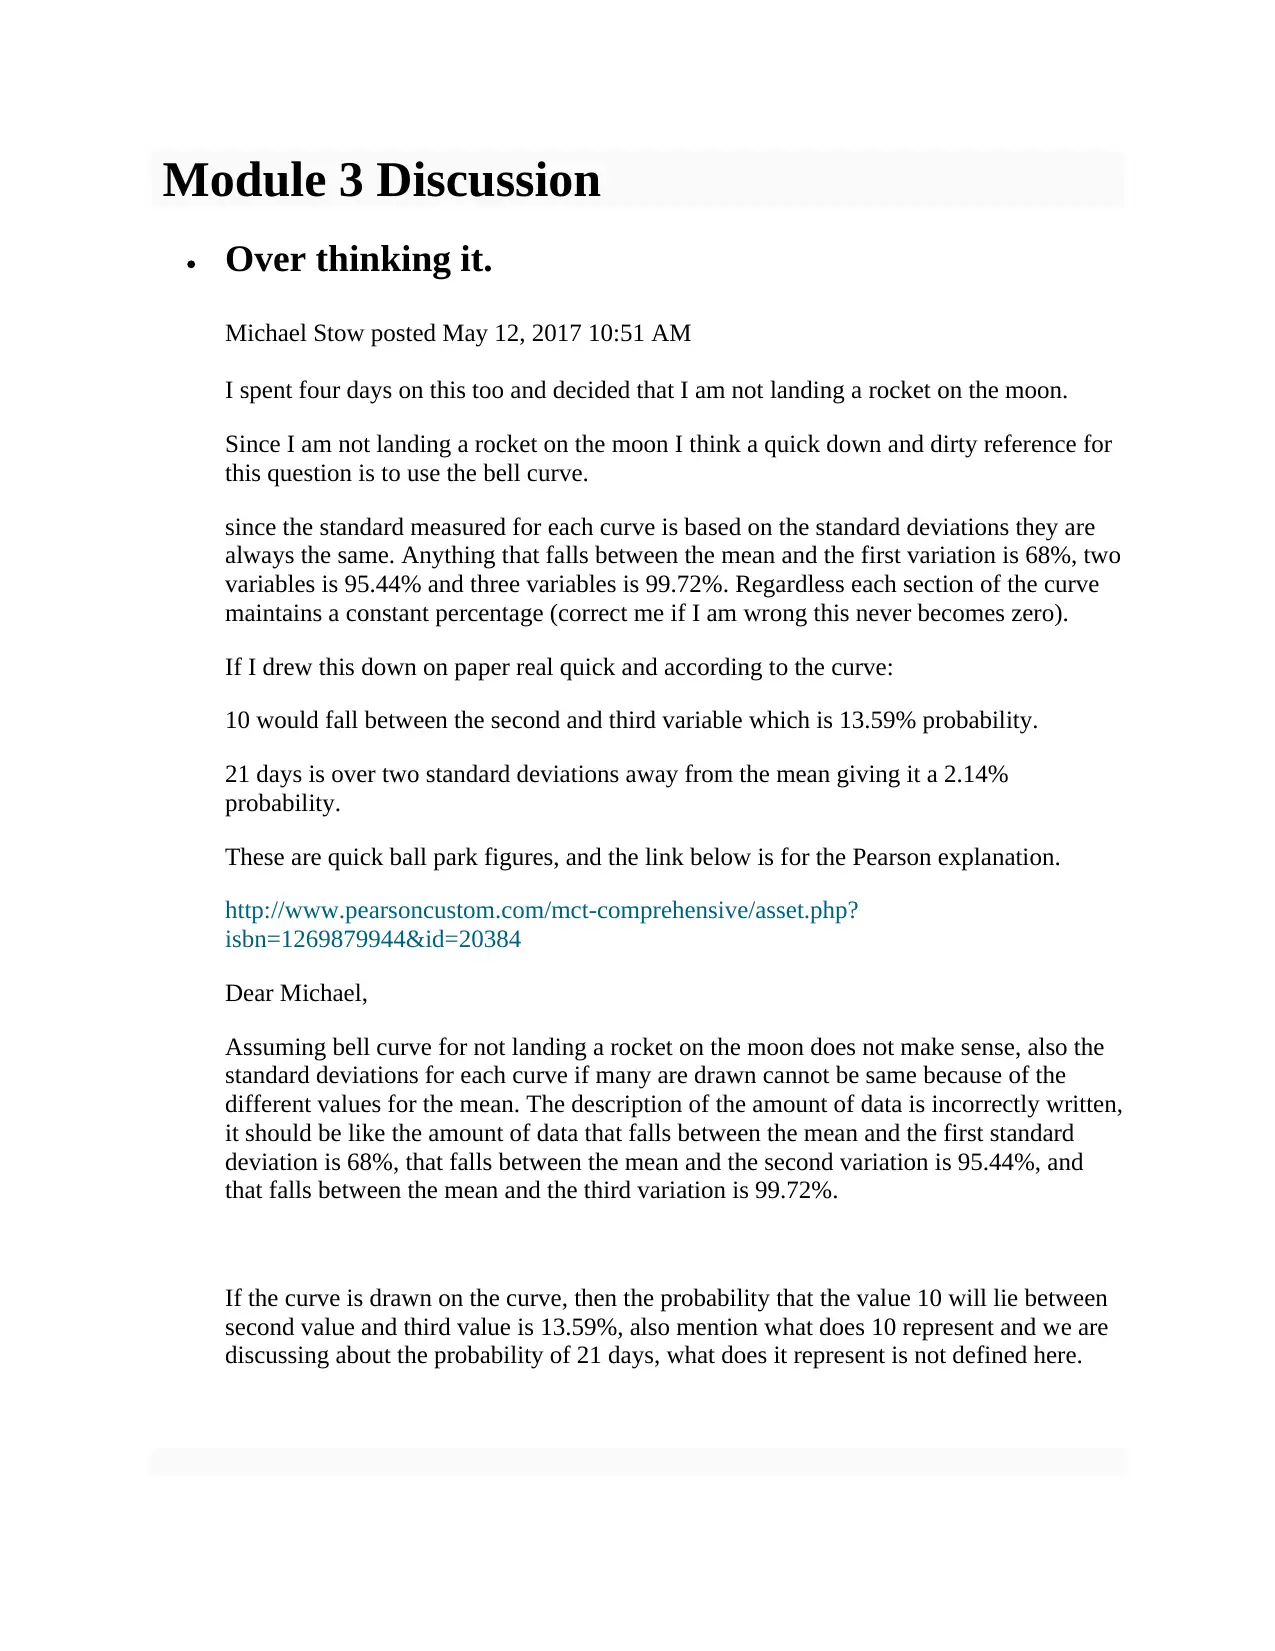
Discussion Board Post
AI Summary
This discussion post, part of Module 3, explores the concepts of the bell curve, standard deviations, and probability. The assignment analyzes a student's initial post that attempts to apply the bell curve to a scenario and provides a critique of the initial post. The response highlights inaccuracies in the student's understanding of the bell curve, particularly regarding standard deviations and probability calculations. It emphasizes the importance of correctly interpreting the curve's values and clarifies the meaning of different data points within the distribution. The post also questions the context of the original analysis, highlighting that the application is incorrect and providing a more accurate explanation of the bell curve's principles. The discussion aims to clarify the correct application of statistical methods in the analysis of data.
Document Page
Module 3 Discussion
Over thinking it.
Michael Stow posted May 12, 2017 10:51 AM
I spent four days on this too and decided that I am not landing a rocket on the moon.
Since I am not landing a rocket on the moon I think a quick down and dirty reference for
this question is to use the bell curve.
since the standard measured for each curve is based on the standard deviations they are
always the same. Anything that falls between the mean and the first variation is 68%, two
variables is 95.44% and three variables is 99.72%. Regardless each section of the curve
maintains a constant percentage (correct me if I am wrong this never becomes zero).
If I drew this down on paper real quick and according to the curve:
10 would fall between the second and third variable which is 13.59% probability.
21 days is over two standard deviations away from the mean giving it a 2.14%
probability.
These are quick ball park figures, and the link below is for the Pearson explanation.
http://www.pearsoncustom.com/mct-comprehensive/asset.php?
isbn=1269879944&id=20384
Dear Michael,
Assuming bell curve for not landing a rocket on the moon does not make sense, also the
standard deviations for each curve if many are drawn cannot be same because of the
different values for the mean. The description of the amount of data is incorrectly written,
it should be like the amount of data that falls between the mean and the first standard
deviation is 68%, that falls between the mean and the second variation is 95.44%, and
that falls between the mean and the third variation is 99.72%.
If the curve is drawn on the curve, then the probability that the value 10 will lie between
second value and third value is 13.59%, also mention what does 10 represent and we are
discussing about the probability of 21 days, what does it represent is not defined here.
tabler-icon-diamond-filled.svg

Paraphrase This Document

Need a fresh take? Get an instant paraphrase of this document with our AI Paraphraser
[object Object]