CPCCBC5002A: Monitoring Costing Systems in Building Construction
VerifiedAdded on 2023/06/11
|11
|2685
|410
Report
AI Summary
This report provides a comprehensive analysis of costing systems for a medium-rise building project, specifically focusing on roofing work. It includes the identification and classification of project costs, a detailed roofing estimate covering materials, labor, and equipment, and an assessment of cost-related risks such as inflation, underestimation, and local taxes. Pessimistic cash flow projections, incorporating contingency plans, are presented along with an S-curve illustrating cumulative costs over time. The report also monitors project expenditure, outlines methods for managing cash inflows and outflows, and identifies critical financial phases. Furthermore, it addresses labor cost variations, proposes a variation document, and references relevant literature to support its findings. This analysis aims to provide a robust framework for monitoring and controlling costs in building and construction projects.
Monitor Costing Systems 1
CPCCBC5002A – MONITOR COSTING SYSTEMS ON MEDIUM-RISE BUILDING AND
CONSTRUCTION PROJECTS
Name
Course
Professor
University
City/state
Date
CPCCBC5002A – MONITOR COSTING SYSTEMS ON MEDIUM-RISE BUILDING AND
CONSTRUCTION PROJECTS
Name
Course
Professor
University
City/state
Date
Paraphrase This Document
Need a fresh take? Get an instant paraphrase of this document with our AI Paraphraser
Monitor Costing Systems 2
CPCCBC5002A – Monitor Costing Systems on Medium-Rise Building and Construction
Projects
Assessment 1: Identify and classify project costs
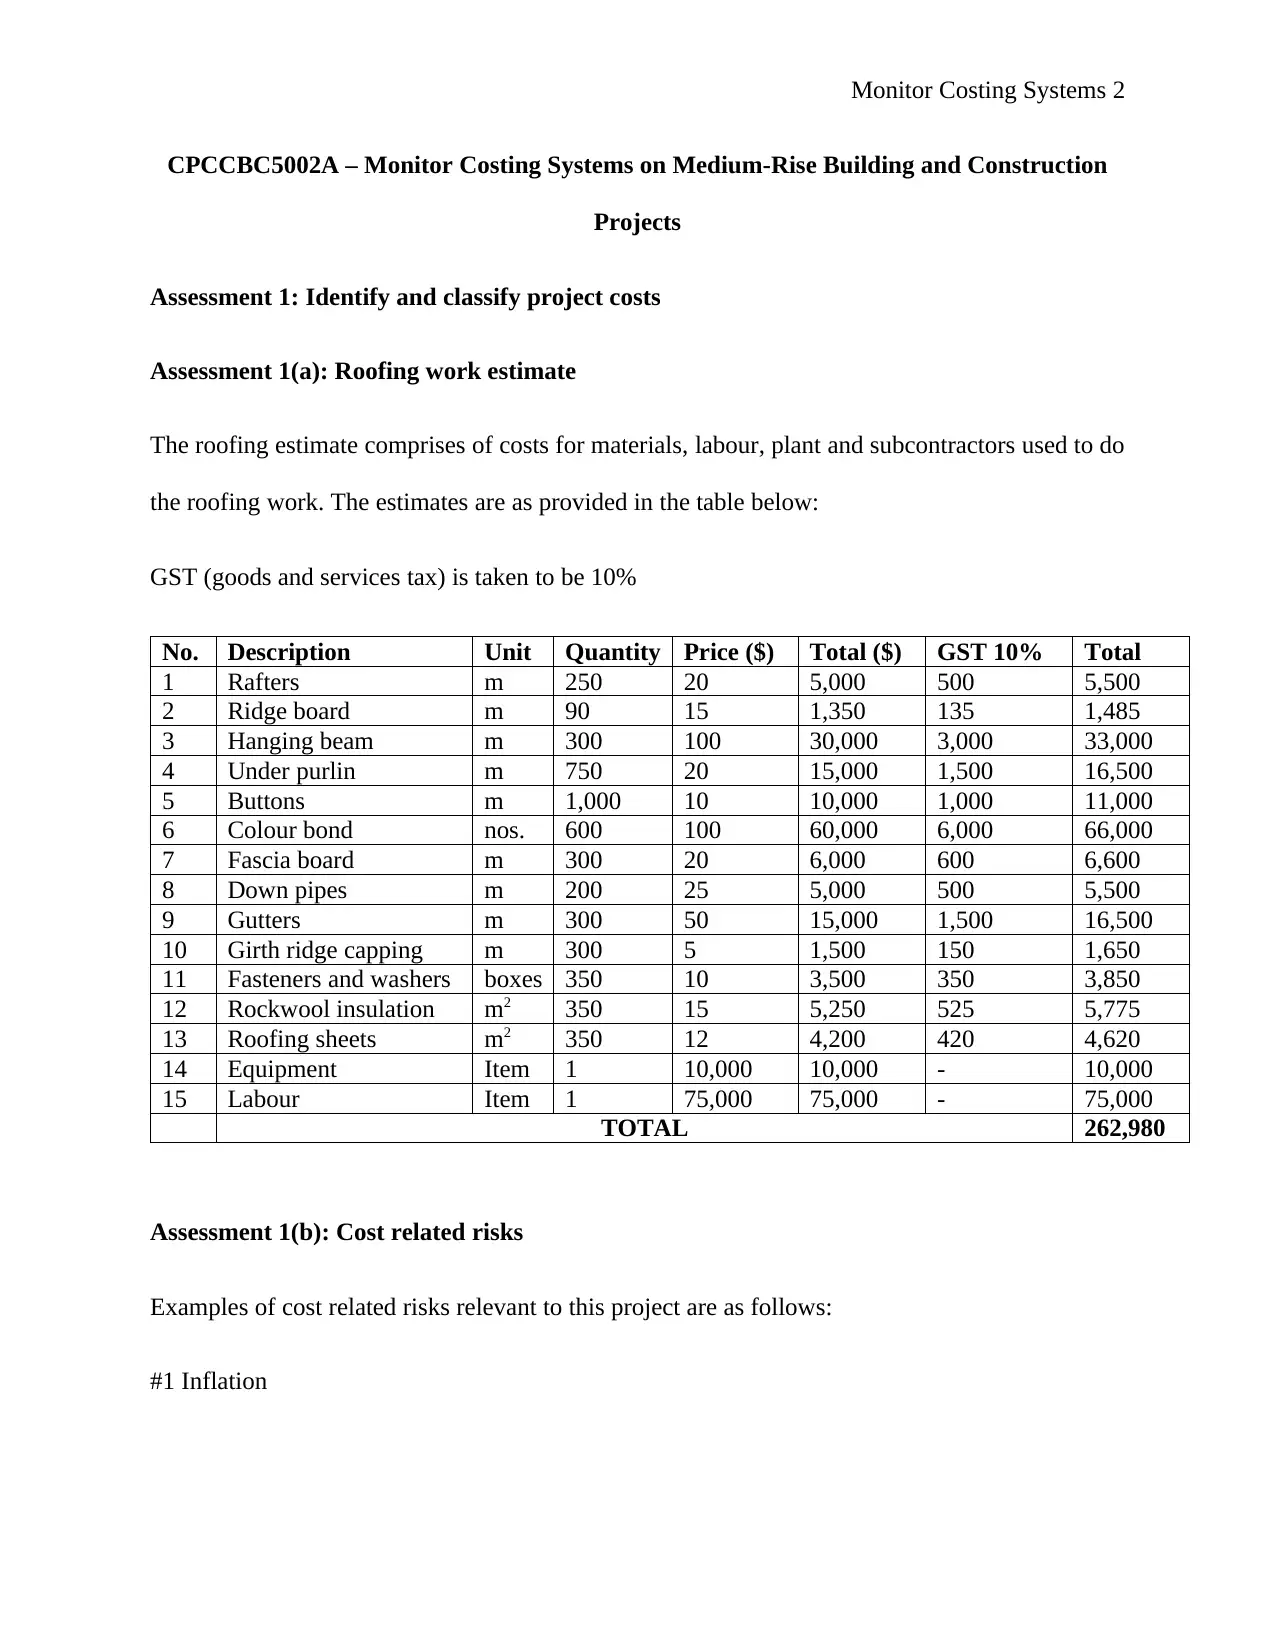
Assessment 1(a): Roofing work estimate
The roofing estimate comprises of costs for materials, labour, plant and subcontractors used to do
the roofing work. The estimates are as provided in the table below:
GST (goods and services tax) is taken to be 10%
No. Description Unit Quantity Price ($) Total ($) GST 10% Total
1 Rafters m 250 20 5,000 500 5,500
2 Ridge board m 90 15 1,350 135 1,485
3 Hanging beam m 300 100 30,000 3,000 33,000
4 Under purlin m 750 20 15,000 1,500 16,500
5 Buttons m 1,000 10 10,000 1,000 11,000
6 Colour bond nos. 600 100 60,000 6,000 66,000
7 Fascia board m 300 20 6,000 600 6,600
8 Down pipes m 200 25 5,000 500 5,500
9 Gutters m 300 50 15,000 1,500 16,500
10 Girth ridge capping m 300 5 1,500 150 1,650
11 Fasteners and washers boxes 350 10 3,500 350 3,850
12 Rockwool insulation m2 350 15 5,250 525 5,775
13 Roofing sheets m2 350 12 4,200 420 4,620
14 Equipment Item 1 10,000 10,000 - 10,000
15 Labour Item 1 75,000 75,000 - 75,000
TOTAL 262,980
Assessment 1(b): Cost related risks
Examples of cost related risks relevant to this project are as follows:
#1 Inflation
CPCCBC5002A – Monitor Costing Systems on Medium-Rise Building and Construction
Projects
Assessment 1: Identify and classify project costs
Assessment 1(a): Roofing work estimate
The roofing estimate comprises of costs for materials, labour, plant and subcontractors used to do
the roofing work. The estimates are as provided in the table below:
GST (goods and services tax) is taken to be 10%
No. Description Unit Quantity Price ($) Total ($) GST 10% Total
1 Rafters m 250 20 5,000 500 5,500
2 Ridge board m 90 15 1,350 135 1,485
3 Hanging beam m 300 100 30,000 3,000 33,000
4 Under purlin m 750 20 15,000 1,500 16,500
5 Buttons m 1,000 10 10,000 1,000 11,000
6 Colour bond nos. 600 100 60,000 6,000 66,000
7 Fascia board m 300 20 6,000 600 6,600
8 Down pipes m 200 25 5,000 500 5,500
9 Gutters m 300 50 15,000 1,500 16,500
10 Girth ridge capping m 300 5 1,500 150 1,650
11 Fasteners and washers boxes 350 10 3,500 350 3,850
12 Rockwool insulation m2 350 15 5,250 525 5,775
13 Roofing sheets m2 350 12 4,200 420 4,620
14 Equipment Item 1 10,000 10,000 - 10,000
15 Labour Item 1 75,000 75,000 - 75,000
TOTAL 262,980
Assessment 1(b): Cost related risks
Examples of cost related risks relevant to this project are as follows:
#1 Inflation
Monitor Costing Systems 3
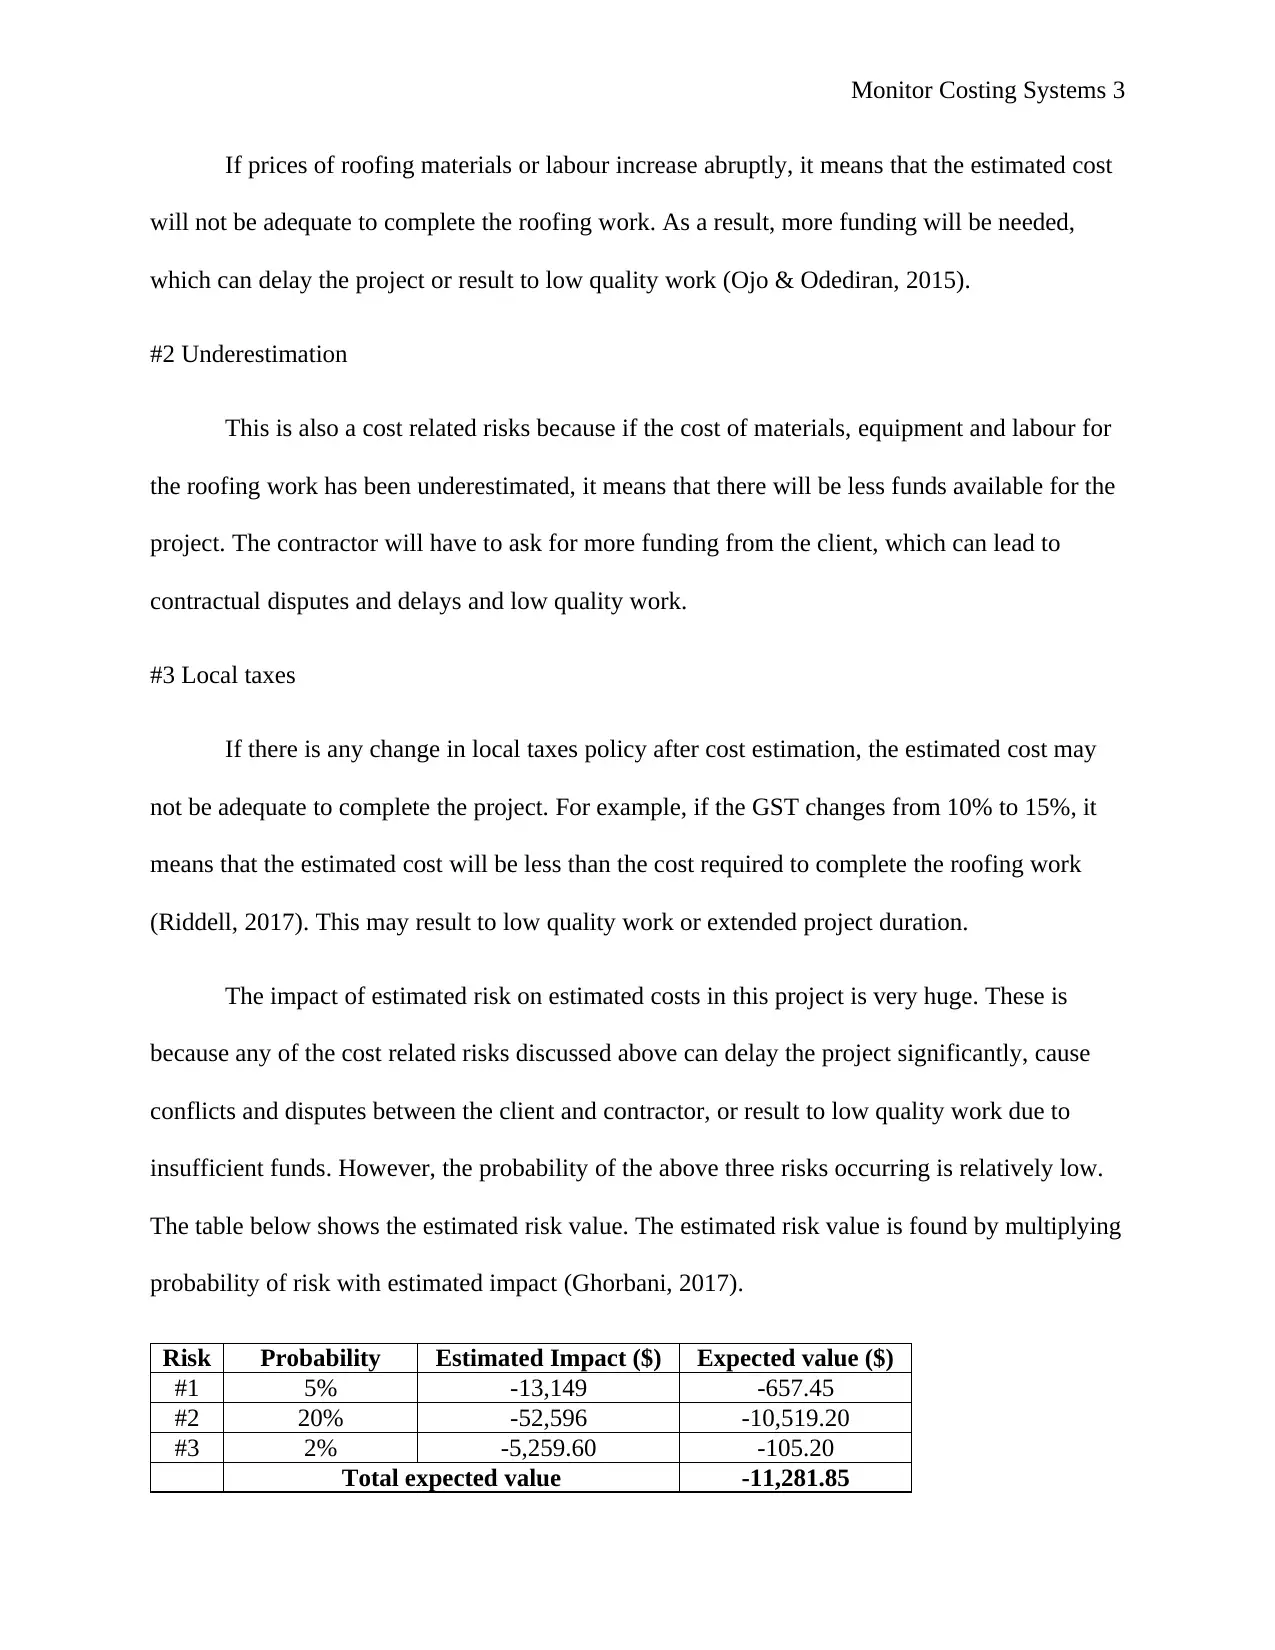
If prices of roofing materials or labour increase abruptly, it means that the estimated cost
will not be adequate to complete the roofing work. As a result, more funding will be needed,
which can delay the project or result to low quality work (Ojo & Odediran, 2015).
#2 Underestimation
This is also a cost related risks because if the cost of materials, equipment and labour for
the roofing work has been underestimated, it means that there will be less funds available for the
project. The contractor will have to ask for more funding from the client, which can lead to
contractual disputes and delays and low quality work.
#3 Local taxes
If there is any change in local taxes policy after cost estimation, the estimated cost may
not be adequate to complete the project. For example, if the GST changes from 10% to 15%, it
means that the estimated cost will be less than the cost required to complete the roofing work
(Riddell, 2017). This may result to low quality work or extended project duration.
The impact of estimated risk on estimated costs in this project is very huge. These is
because any of the cost related risks discussed above can delay the project significantly, cause
conflicts and disputes between the client and contractor, or result to low quality work due to
insufficient funds. However, the probability of the above three risks occurring is relatively low.
The table below shows the estimated risk value. The estimated risk value is found by multiplying
probability of risk with estimated impact (Ghorbani, 2017).
Risk Probability Estimated Impact ($) Expected value ($)
#1 5% -13,149 -657.45
#2 20% -52,596 -10,519.20
#3 2% -5,259.60 -105.20
Total expected value -11,281.85
⊘ This is a preview!⊘
Do you want full access?
Subscribe today to unlock all pages.
Trusted by 1+ million students worldwide
Monitor Costing Systems 4
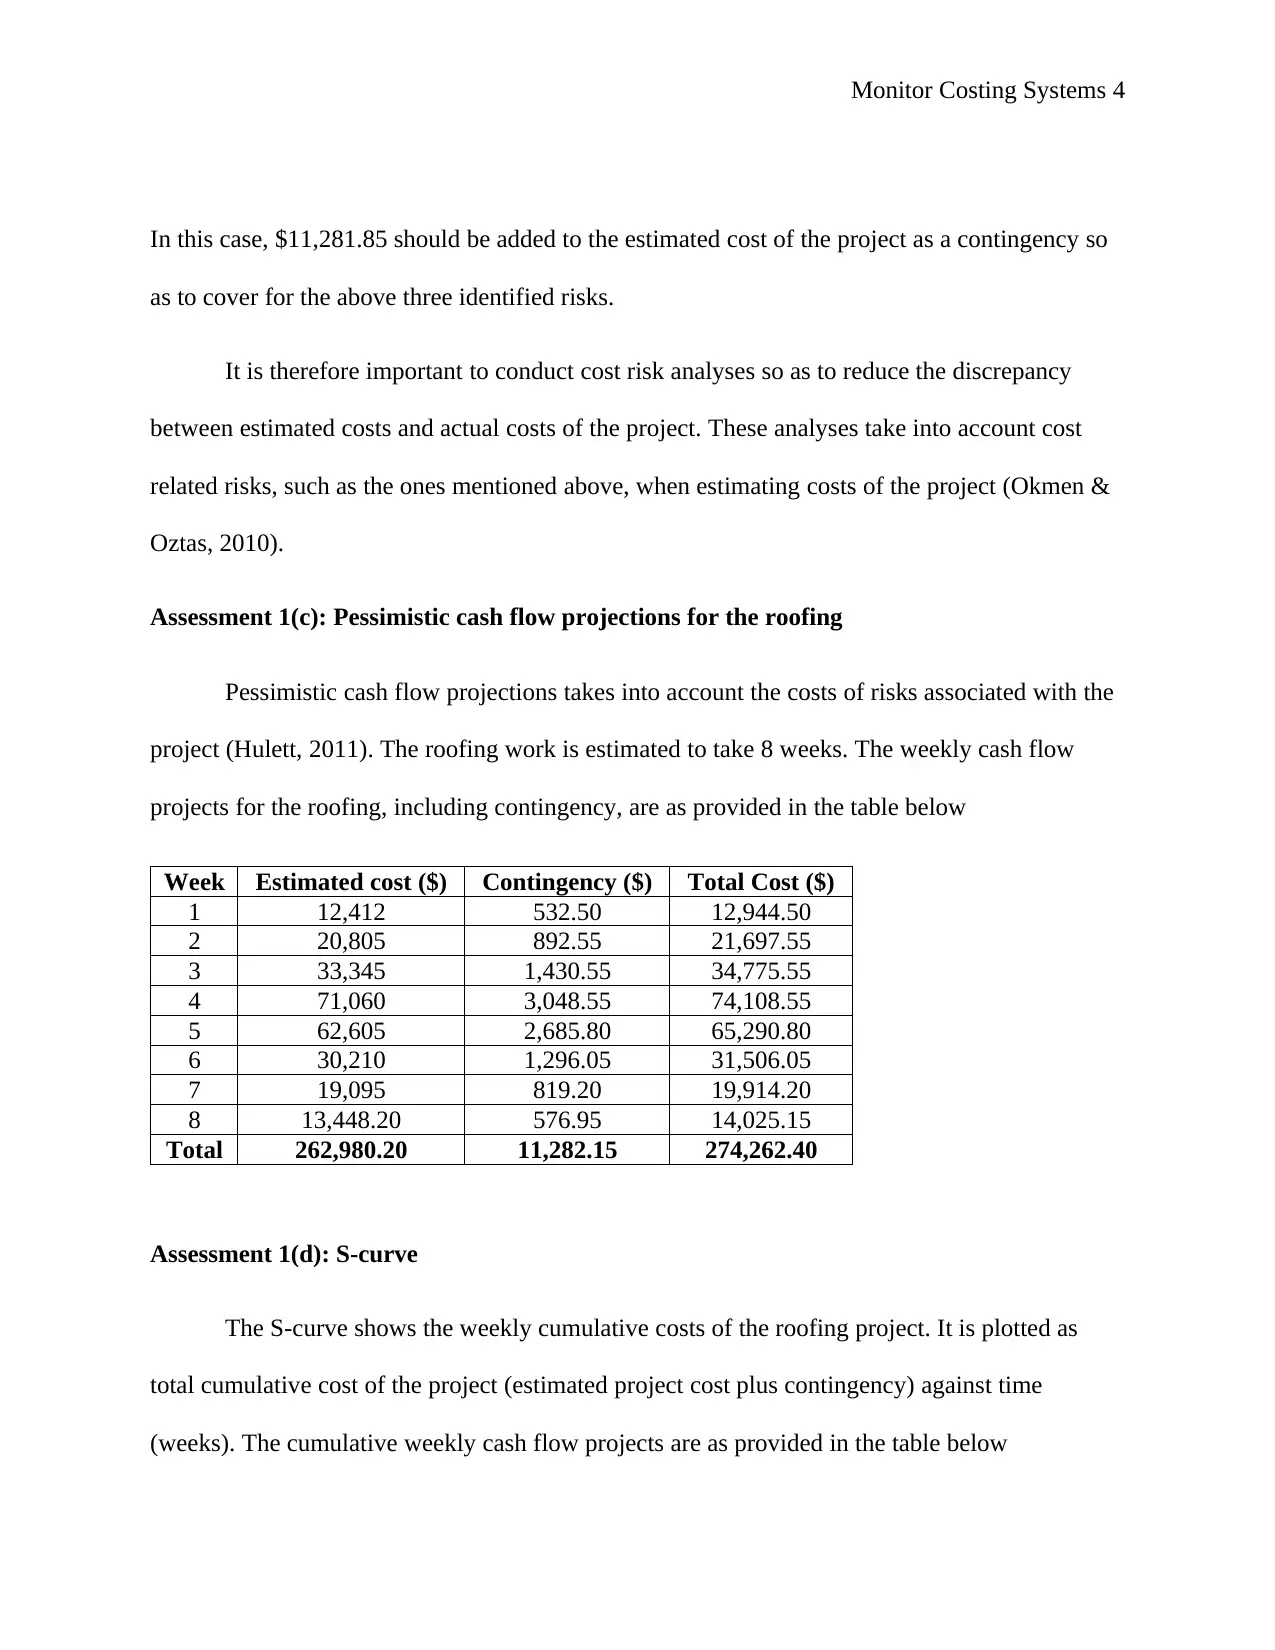
In this case, $11,281.85 should be added to the estimated cost of the project as a contingency so
as to cover for the above three identified risks.
It is therefore important to conduct cost risk analyses so as to reduce the discrepancy
between estimated costs and actual costs of the project. These analyses take into account cost
related risks, such as the ones mentioned above, when estimating costs of the project (Okmen &
Oztas, 2010).
Assessment 1(c): Pessimistic cash flow projections for the roofing
Pessimistic cash flow projections takes into account the costs of risks associated with the
project (Hulett, 2011). The roofing work is estimated to take 8 weeks. The weekly cash flow
projects for the roofing, including contingency, are as provided in the table below
Week Estimated cost ($) Contingency ($) Total Cost ($)
1 12,412 532.50 12,944.50
2 20,805 892.55 21,697.55
3 33,345 1,430.55 34,775.55
4 71,060 3,048.55 74,108.55
5 62,605 2,685.80 65,290.80
6 30,210 1,296.05 31,506.05
7 19,095 819.20 19,914.20
8 13,448.20 576.95 14,025.15
Total 262,980.20 11,282.15 274,262.40
Assessment 1(d): S-curve
The S-curve shows the weekly cumulative costs of the roofing project. It is plotted as
total cumulative cost of the project (estimated project cost plus contingency) against time
(weeks). The cumulative weekly cash flow projects are as provided in the table below
Paraphrase This Document
Need a fresh take? Get an instant paraphrase of this document with our AI Paraphraser
Monitor Costing Systems 5
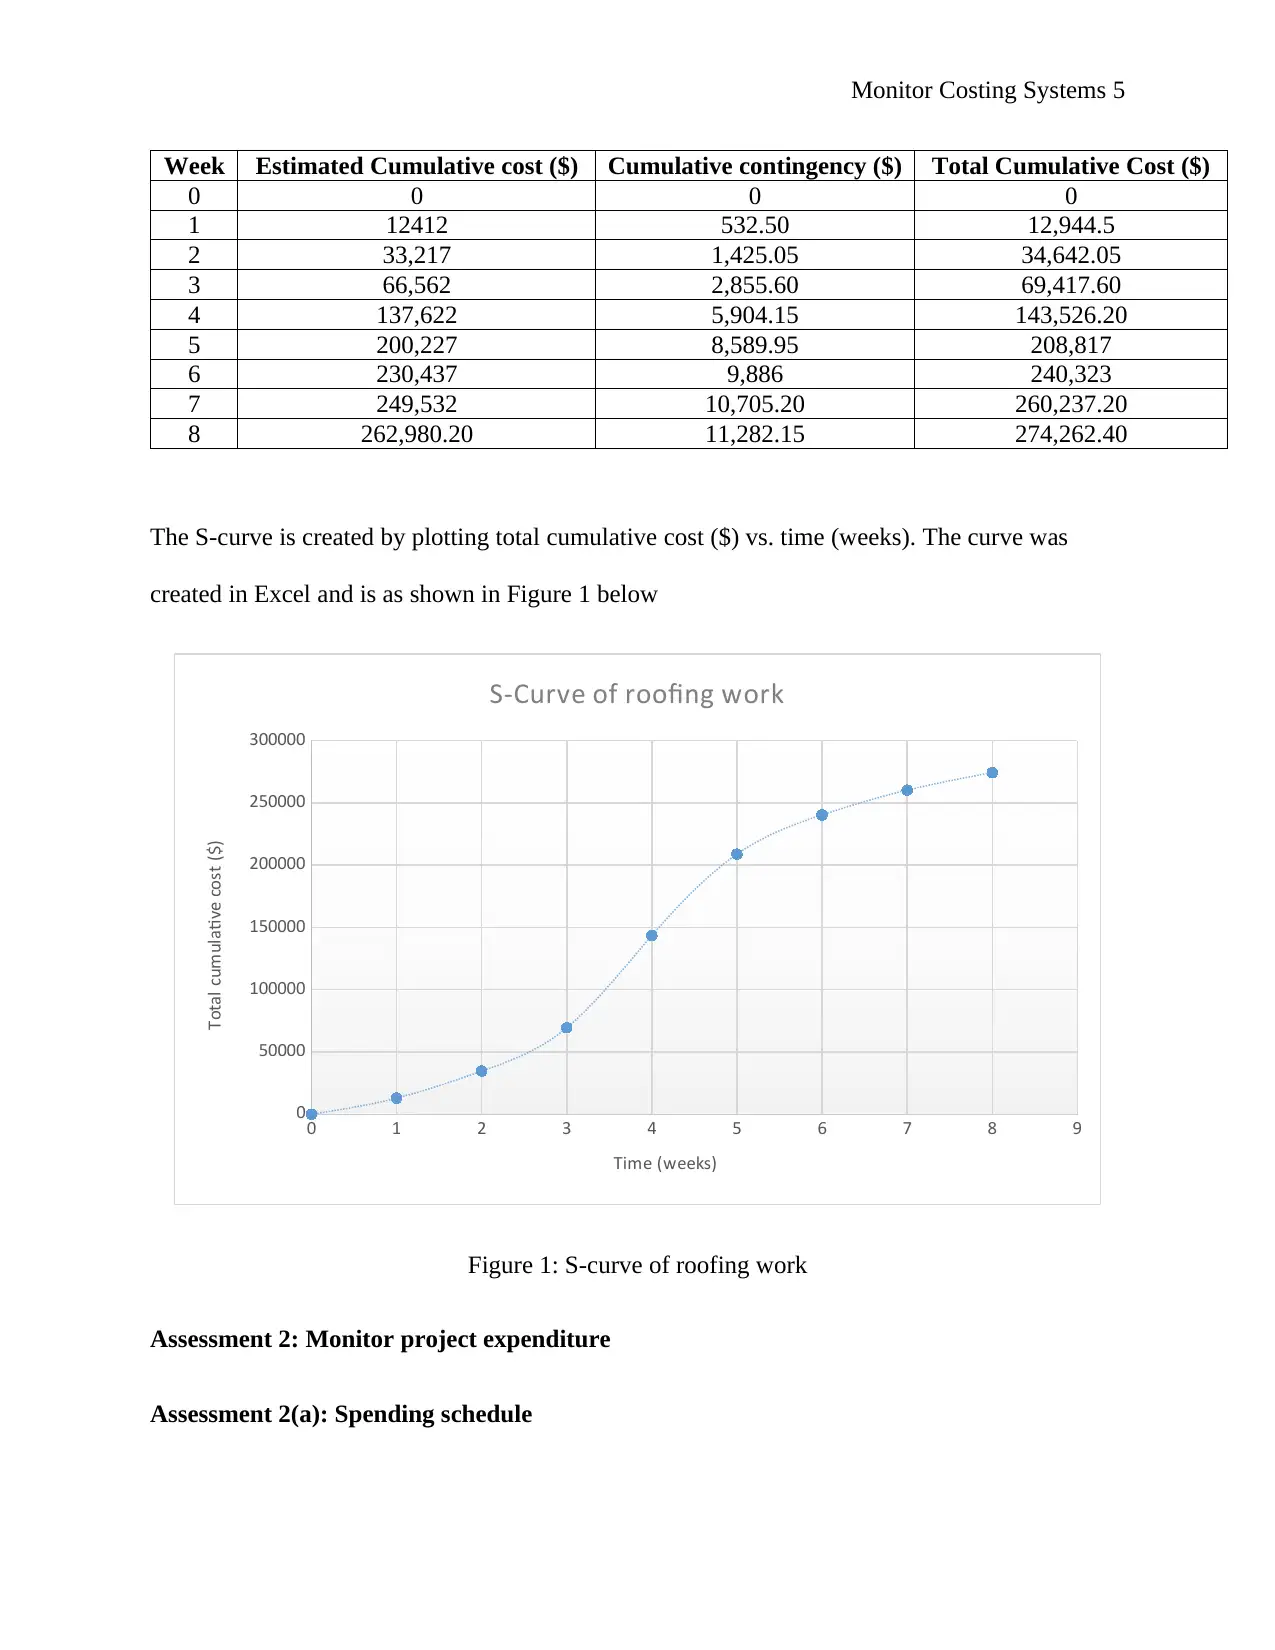
Week Estimated Cumulative cost ($) Cumulative contingency ($) Total Cumulative Cost ($)
0 0 0 0
1 12412 532.50 12,944.5
2 33,217 1,425.05 34,642.05
3 66,562 2,855.60 69,417.60
4 137,622 5,904.15 143,526.20
5 200,227 8,589.95 208,817
6 230,437 9,886 240,323
7 249,532 10,705.20 260,237.20
8 262,980.20 11,282.15 274,262.40
The S-curve is created by plotting total cumulative cost ($) vs. time (weeks). The curve was
created in Excel and is as shown in Figure 1 below
0 1 2 3 4 5 6 7 8 9
0
50000
100000
150000
200000
250000
300000
S-Curve of roofing work
Time (weeks)
Total cumulative cost ($)
Figure 1: S-curve of roofing work
Assessment 2: Monitor project expenditure
Assessment 2(a): Spending schedule
Monitor Costing Systems 6
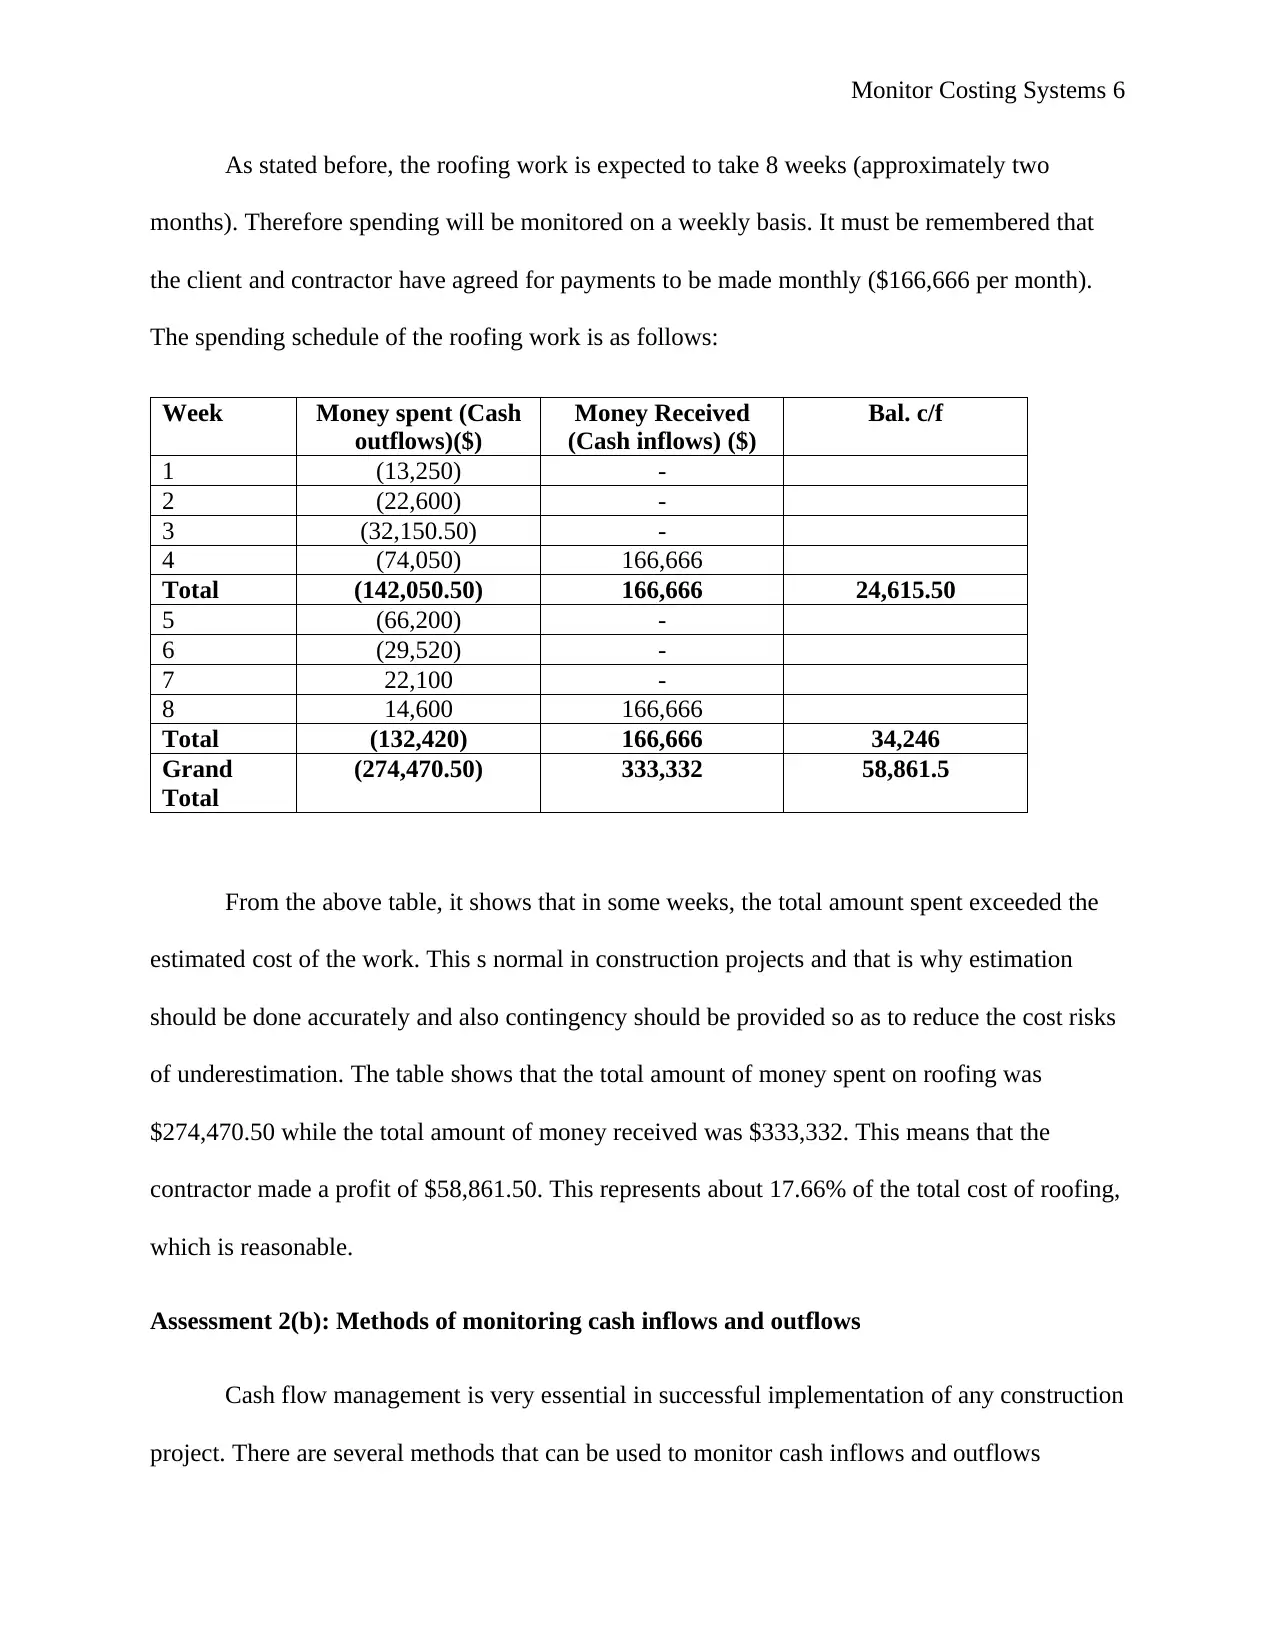
As stated before, the roofing work is expected to take 8 weeks (approximately two
months). Therefore spending will be monitored on a weekly basis. It must be remembered that
the client and contractor have agreed for payments to be made monthly ($166,666 per month).
The spending schedule of the roofing work is as follows:
Week Money spent (Cash
outflows)($)
Money Received
(Cash inflows) ($)
Bal. c/f
1 (13,250) -
2 (22,600) -
3 (32,150.50) -
4 (74,050) 166,666
Total (142,050.50) 166,666 24,615.50
5 (66,200) -
6 (29,520) -
7 22,100 -
8 14,600 166,666
Total (132,420) 166,666 34,246
Grand
Total
(274,470.50) 333,332 58,861.5
From the above table, it shows that in some weeks, the total amount spent exceeded the
estimated cost of the work. This s normal in construction projects and that is why estimation
should be done accurately and also contingency should be provided so as to reduce the cost risks
of underestimation. The table shows that the total amount of money spent on roofing was
$274,470.50 while the total amount of money received was $333,332. This means that the
contractor made a profit of $58,861.50. This represents about 17.66% of the total cost of roofing,
which is reasonable.
Assessment 2(b): Methods of monitoring cash inflows and outflows
Cash flow management is very essential in successful implementation of any construction
project. There are several methods that can be used to monitor cash inflows and outflows
⊘ This is a preview!⊘
Do you want full access?
Subscribe today to unlock all pages.
Trusted by 1+ million students worldwide
Monitor Costing Systems 7
depending on the type and size of the project. Some of these methods that can be used to monitor
cash inflows and outflows of the roofing work include the following:
Invoices and receipts: in this method, invoices show the amount that the company has
been paid or is expecting to be paid, and the money that the company has paid is planning to pay
out. The two gives an indication on whether the company is operating within the estimated
project budget.
Keeping records: this method is where all financial records are kept and evaluated. The
records include list and costs of materials purchased, damaged materials, leased equipment,
maintenance of equipment, labour, compensation, staffs laid off, new employees, etc. It helps in
identifying areas where money is being spent and probably how to avoid or minimize some
expenses.
Cash flow status report: this report gives a summary of all cash spent and received within
a certain period. The report helps in determining total costs, billings, payables and receivables
(Cantoria, 2011). This information is useful in establishing the amount of money getting in and
going out of the account.
Cost cutting plan: this method entails identifying strategies that can be used to cut costs.
The plan has to be comprehensive and it definitely starts by monitoring how money is spent and
identifying any opportunities of saving it.
Assigning individual responsibilities: this is where the company assigns individuals in
charge of specific departments to prepare daily reports on money spent and received. This report
provides a daily update on cash flows thus helping in monitoring cash inflows and outflows.
Paraphrase This Document
Need a fresh take? Get an instant paraphrase of this document with our AI Paraphraser
Monitor Costing Systems 8
Projecting cash flow: this entails predicting when the company will spent or receive
money, and comparing estimated costs (project budget) and actual costs.
Assessment 2(c): Critical financial phases
An early start and early finish of the roof work is susceptible to financial challenges and
therefore it is very important for the contractor to discuss with the client on how the required
funds can be provided earlier than planned. Nevertheless, the likely critical financial phases in
cash flow for this project are as follows:
The first phase is spending personal money. Since the company is starting the work early,
it has to spend its own money as they wait for the agreed time before the client can make the first
payment. It is like the company making a “personal” loan to the work.
The second phase is where the company will have to source funds externally so as to
sustain the project. This will be still before the client makes the first pay. Therefore it will be
before end of the first month.
The third phase is where the client has made the first payment. The company uses the
money to pay suppliers, equipment leased and some casual laborers. However, the money may
not be enough to cater for conventional expenses of the company, such as administrative costs.
At this point, the company will use some money to repay the money borrowed in the second
financial phase.
The fourth phase is where the company has received another payment from the client and
using it to pay for all expenses. At this point, the project is paying off and the company is self-
sufficient.
Monitor Costing Systems 9
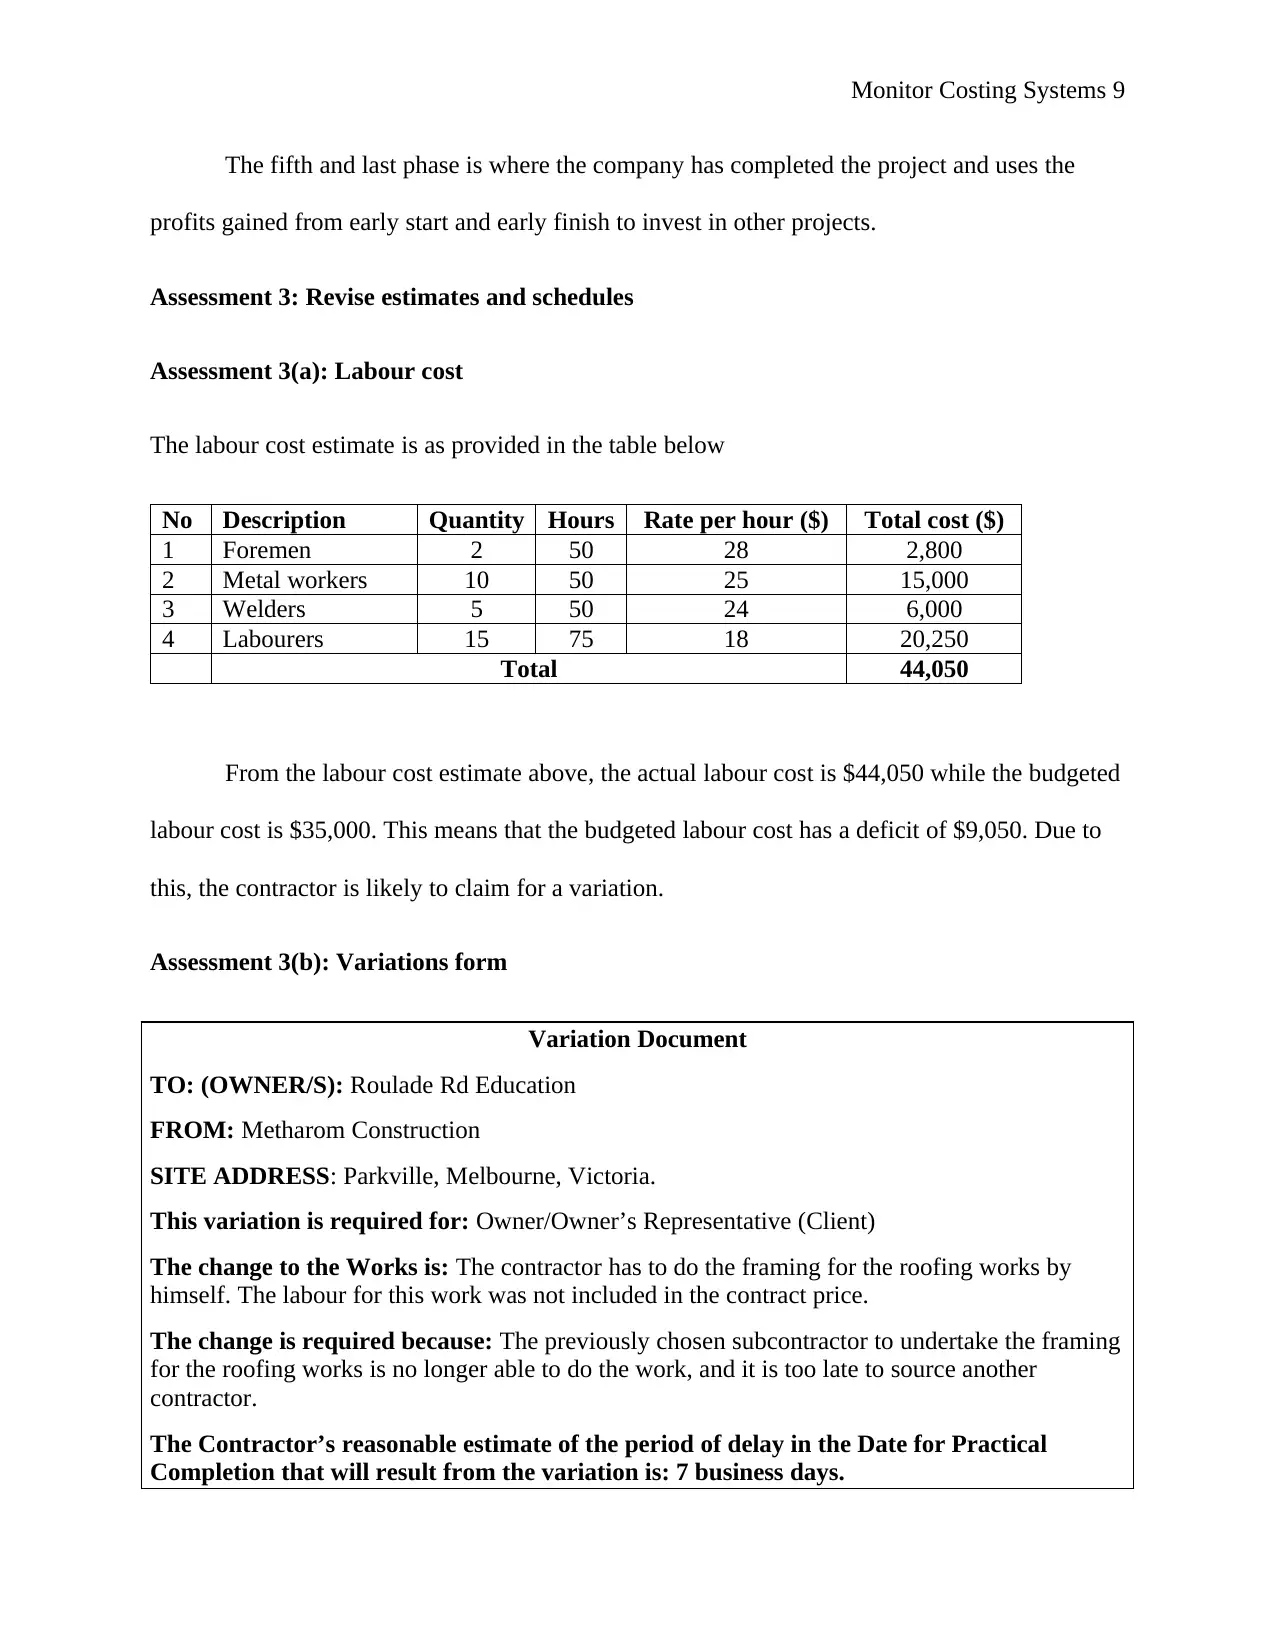
The fifth and last phase is where the company has completed the project and uses the
profits gained from early start and early finish to invest in other projects.
Assessment 3: Revise estimates and schedules
Assessment 3(a): Labour cost
The labour cost estimate is as provided in the table below
No Description Quantity Hours Rate per hour ($) Total cost ($)
1 Foremen 2 50 28 2,800
2 Metal workers 10 50 25 15,000
3 Welders 5 50 24 6,000
4 Labourers 15 75 18 20,250
Total 44,050
From the labour cost estimate above, the actual labour cost is $44,050 while the budgeted
labour cost is $35,000. This means that the budgeted labour cost has a deficit of $9,050. Due to
this, the contractor is likely to claim for a variation.
Assessment 3(b): Variations form
Variation Document
TO: (OWNER/S): Roulade Rd Education
FROM: Metharom Construction
SITE ADDRESS: Parkville, Melbourne, Victoria.
This variation is required for: Owner/Owner’s Representative (Client)
The change to the Works is: The contractor has to do the framing for the roofing works by
himself. The labour for this work was not included in the contract price.
The change is required because: The previously chosen subcontractor to undertake the framing
for the roofing works is no longer able to do the work, and it is too late to source another
contractor.
The Contractor’s reasonable estimate of the period of delay in the Date for Practical
Completion that will result from the variation is: 7 business days.
⊘ This is a preview!⊘
Do you want full access?
Subscribe today to unlock all pages.
Trusted by 1+ million students worldwide
Monitor Costing Systems 10
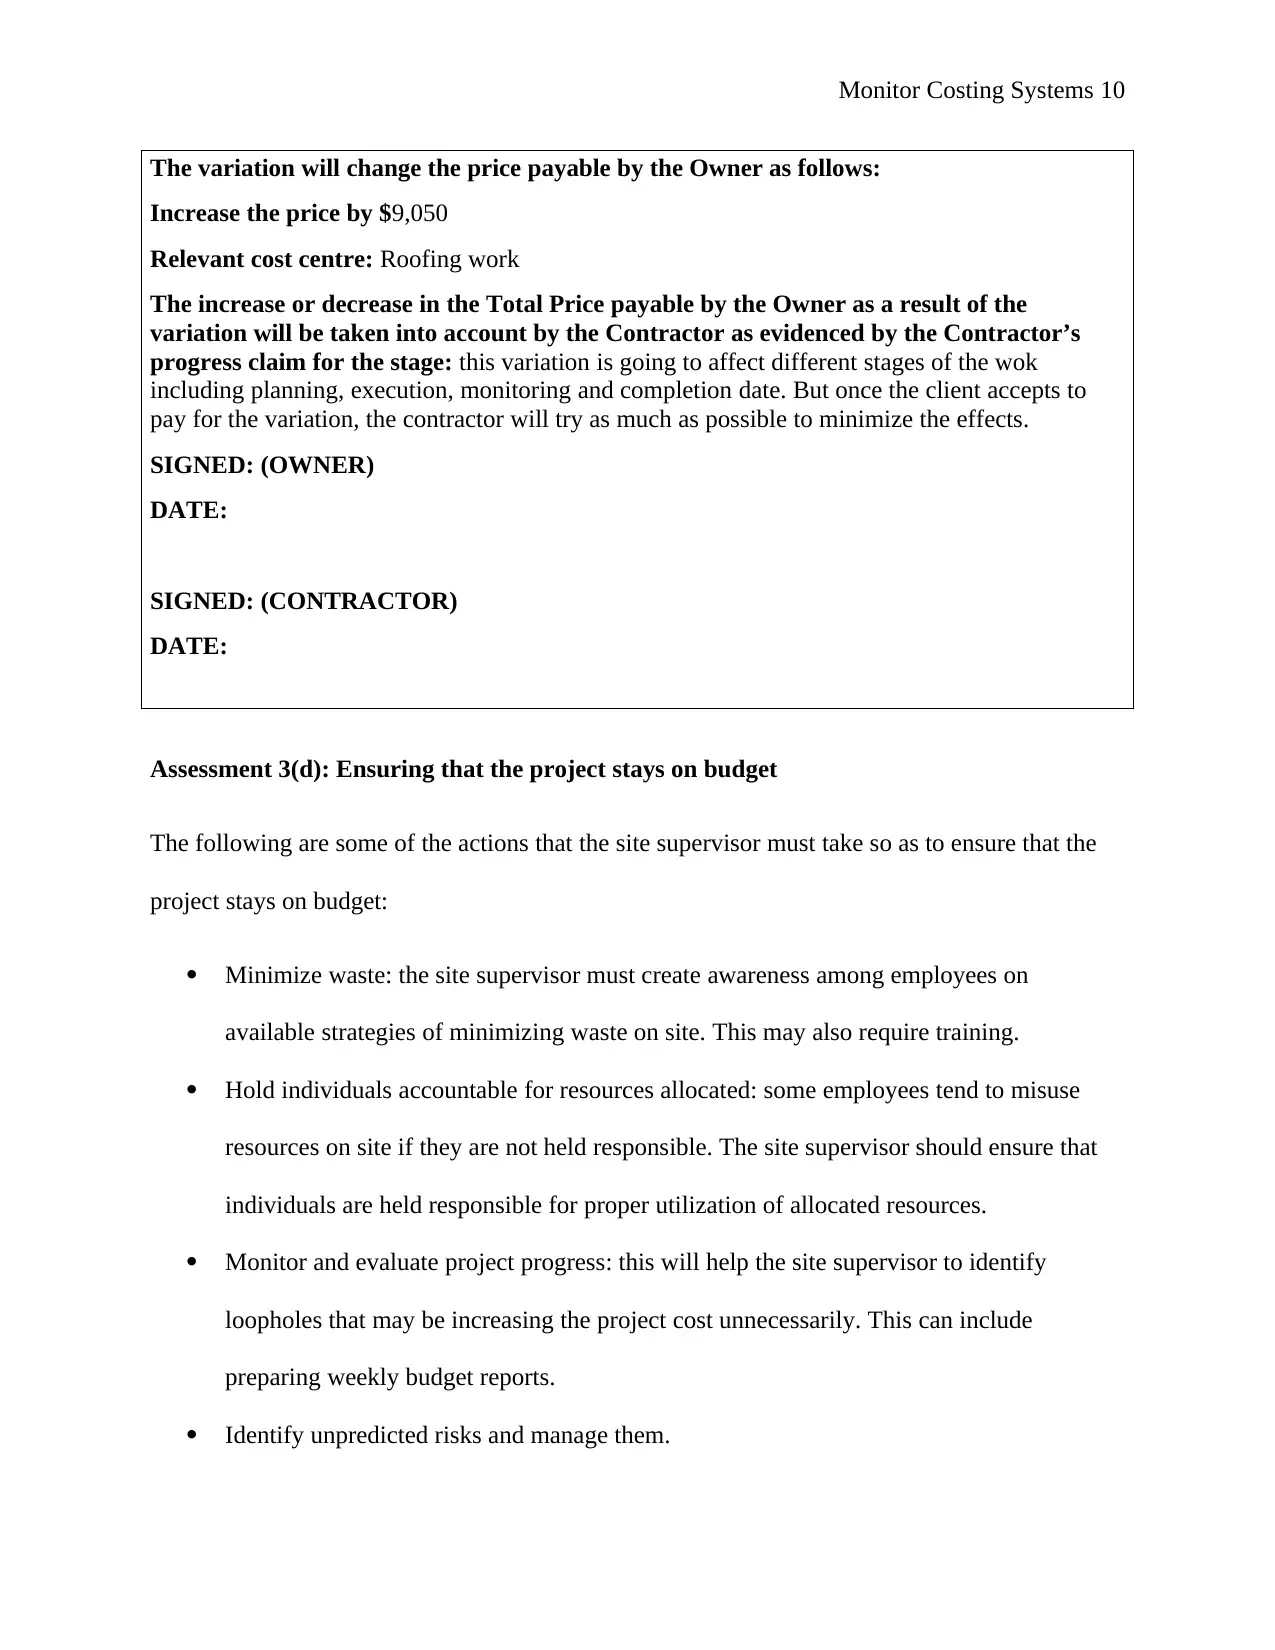
The variation will change the price payable by the Owner as follows:
Increase the price by $9,050
Relevant cost centre: Roofing work
The increase or decrease in the Total Price payable by the Owner as a result of the
variation will be taken into account by the Contractor as evidenced by the Contractor’s
progress claim for the stage: this variation is going to affect different stages of the wok
including planning, execution, monitoring and completion date. But once the client accepts to
pay for the variation, the contractor will try as much as possible to minimize the effects.
SIGNED: (OWNER)
DATE:
SIGNED: (CONTRACTOR)
DATE:
Assessment 3(d): Ensuring that the project stays on budget
The following are some of the actions that the site supervisor must take so as to ensure that the
project stays on budget:
Minimize waste: the site supervisor must create awareness among employees on
available strategies of minimizing waste on site. This may also require training.
Hold individuals accountable for resources allocated: some employees tend to misuse
resources on site if they are not held responsible. The site supervisor should ensure that
individuals are held responsible for proper utilization of allocated resources.
Monitor and evaluate project progress: this will help the site supervisor to identify
loopholes that may be increasing the project cost unnecessarily. This can include
preparing weekly budget reports.
Identify unpredicted risks and manage them.
Paraphrase This Document
Need a fresh take? Get an instant paraphrase of this document with our AI Paraphraser
Monitor Costing Systems 11
Keep all staffs informed about cost reduction efforts put in place and how they will
benefit from it.
References
Cantoria, C., 2011.
Managing Cash Flow Control in Construction Projects. [Online]
Available at: https://www.brighthubpm.com/monitoring-projects/114395-managing-cash-flow-control-
in-construction-projects/
[Accessed 20 July 2018].
Ghorbani, S., 2017.
How Cost Contingency is Calculated?. [Online]
Available at: https://www.projectcontrolacademy.com/cost-contingency-calculation/
[Accessed 20 July 2018].
Hulett, D., 2011.
Integrated cost-schedule risk analysis. 1st ed. Abingdon, UK: Routledge.
Ojo, G. & Odediran, S., 2015. Significance of Construction Cost Estimating Risks in Nigeria.
International
Journal of Civil Engineering and Construction Science, 2(1), pp. 1-8.
Okmen, O. & Oztas, A., 2010. Construction cost analysis under uncertainty with correlated cost risk
analysis model.
Construction Management and Economics, 28(2), p. 2030212.
Riddell, T., 2017.
The Types of Risks in Construction Projects. [Online]
Available at: https://esub.com/the-types-of-risks-in-construction-projects-to-watch-out-for/
[Accessed 20 July 2018].
1 out of 11
Your All-in-One AI-Powered Toolkit for Academic Success.
+13062052269
info@desklib.com
Available 24*7 on WhatsApp / Email
![[object Object]](/_next/static/media/star-bottom.7253800d.svg)
Unlock your academic potential
Copyright © 2020–2025 A2Z Services. All Rights Reserved. Developed and managed by ZUCOL.