Economic Evaluation of Multi-Condition Collaborative Care Management for Depression, Diabetes and Coronary Heart Disease
VerifiedAdded on 2023/06/08
|18
|5932
|392
AI Summary
This study evaluates the economic impact of multi-condition collaborative care management for depression, diabetes and coronary heart disease. The study focuses on the significance of economic evaluations in healthcare and the need for effective resource management for a sustainable healthcare system.
Contribute Materials
Your contribution can guide someone’s learning journey. Share your
documents today.
Contents
Section1: Need for economic evaluation.....................................................................................................2
Section 2:.....................................................................................................................................................3
Subject of study.......................................................................................................................................3
ealth technologyH :..............................................................................................................................3
Diseases:..............................................................................................................................................3
ype of interventionT :.............................................................................................................................3
ypothesis study questionH / :...................................................................................................................3
ey elements of studyK .............................................................................................................................4
Study population....................................................................................................................................4
Modeling and statistical e plorationx ..........................................................................................................4
Setting..................................................................................................................................................... 5
Dates to which data relate...................................................................................................................5
ink between effectiveness and cost dataL ................................................................................................5
Details about clinical evidence................................................................................................................5
Study sample.......................................................................................................................................5
Study design........................................................................................................................................6
Analysis of ff ectivenessE ..........................................................................................................................6
ff
ectiveness resultsE .................................................................................................................................6
Clinical conclusions:.............................................................................................................................7
Section 3:...................................................................................................................................................7
conomic analysisE ....................................................................................................................................7
Measure of health benefit used.............................................................................................................7
Direct costs:.........................................................................................................................................8
roductivity costsP :..................................................................................................................................8
Currency:.............................................................................................................................................8
Statistical analysis of quantities costs/ :.........................................................................................................8
Methods used to allow for uncertainty...............................................................................................9
Results.....................................................................................................................................................9
stimated benefits used in the economic analysisE ...................................................................................9
Cost results..........................................................................................................................................9
Synthesis of costs and benefits............................................................................................................10
Secure Best Marks with AI Grader
Need help grading? Try our AI Grader for instant feedback on your assignments.
Author s conclusion’ ...........................................................................................................................10
Section Critical commentary4: ..................................................................................................................10
Choice of comparator:.......................................................................................................................10
Validity of estimates of effectiveness.......................................................................................................11
Validity of estimate of health benefit....................................................................................................12
Validity of estimate of costs.................................................................................................................12
ther issuesO .......................................................................................................................................13
Section uture research5: F .......................................................................................................................13
Section1: Need for economic evaluation
Effective resource management for a sustainable healthcare system and informed decisions regarding
resource allocation demands the utilization of economic considerations in the planning, decision making,
evaluation, and management of health systems (1). The economic evaluations allow the assessment of
forces of demand and supply through methods of quantitative analysis, econometric modeling, and
analytic models. These further facilitate the evaluation of complex interventions (2,3). Therefore, such
evaluations also help in informed health policy formulation and guide clinical decisions. Drawing from
the significance of economic evaluations in healthcare the evaluation study under the analysis for present
assignment focuses on the significant issues of co-morbid depression, diabetes and/or coronary heart
disease (CHD). The physiological implications of conditions such as diabetes and coronary heart disease
often pave the way to co-morbid depression (4,5). The disorders are characterized by dysregulation of the
hypothalamic-pituitary-adrenal axis, activated inflammatory responses, and the adverse impact of
functioning. Depression co-morbidity further worsens self-care and health in diabetic patients, with
additional pressure from the economic burden of diabetes (6,7).
Similarly, depression also finds a detrimental relationship with CHD prognosis, therefore the debilitating
quality of life, and costs of healthcare. The patients suffering from CHD have been indicated to acquire
subsyndromal or syndromal depression, which demands the depression management systems in place (8).
The association between the two conditions has been regarded as high, and the future predictions indicate
towards the rise of the respective association(9,10). Also, the presence or elevation of depression could, in
turn, increase the prognostic risk of recurrence of CHD and result in mortality. The chronic nature of such
conditions further contributes to complex medical regimes, conflicting medical advices, duplicative tests,
and poor adherence (11). The interventions which find implications for improvement on clinical
conditions do not necessarily exert a holistic impact on the quality of life and cost-efficacy. Therefore, in
the lieu of before mentioned health policy challenges presented by the co-morbid depression and chronic
diseases of diabetes and CHD, the present economic evaluation is necessary for assessing the economic
way for the design and administration of cost-effective interventions which improve the medical control
of the conditions with simultaneous improvement of status of quality of life.
Section 2:
Subject of study
Health technology:
The health technology utilized by the authors included the multi-condition collaborative care
management, TEAMcare intervention. The management approach comprised of a holistic combination of
principles from depression interventions, chronic care model, and integrated treat-to-target medication
strategy. The single treatment approach found application across all the three conditions of diabetes,
CHD, and depression. The healthcare provider team comprised of primary care physicians, and nurse care
manager who worked closely with both patients and PCP for effective implementation. The treatment
was compared with usual primary care administered to outpatients suffering from depression and
diabetes/CHD.
Diseases:
The study focused on the chronic illness of diabetes and Coronary Heart Disease (CHD), with co-morbid
depression.
Type of intervention:
The type of intervention was collaborative care management intervention, wherein the physician-
supervised nurses collaborated with primary care physicians to provide treatment of multiple disease risk
factors. The nurses helped the patients for the optimized systematic management of illnesses through
identification of clinical goals and development of individualized care plans. The nurses also intervened
in patient education and utilized techniques to promote the performing of self-care activities among
patients.
Hypothesis/study question:
The study aimed to answer the question that whether the interventions which improve medical disease
control and depression outcomes could also improve quality of life and cost-effectiveness of medical
Secure Best Marks with AI Grader
Need help grading? Try our AI Grader for instant feedback on your assignments.
care. The authors compared the outcomes of the patients under multi condition care management plan
and those who received usual care. The study differed from previous trials which solely focused on
improvement in depression by focusing on multi condition care intervention. The perspective of the study
was the healthcare system.
Key elements of the study
The type of study is cost-effective analysis.
Study population
The study population comprised of patients recruited from 14 Group Health (GH) primary clinics in the
state of Washington. The patients were suffering from diabetes, CHD or both with 1 or more poorly
controlled parameters. The patients who demonstrated poorly controlled parameters further had to have a
depression score of at least 10 on Patient Health Questionnaire-9. The patients were excluded if suffering
from terminal illness, planning bariatric surgery, severe hearing loss, or residence in long-term care. Also,
those receiving psychiatric care for schizophrenia or bipolar disorder, or antipsychotics for mood
stabilization and mental confusion were excluded. The selected patient's post-screening were randomized
to the intervention group or the usual care group. The usual care patients received care for depression,
diabetes, and CHD solely under the care of PCP
Modeling and statistical exploration
For comparison between the intervention and usual care groups the author's utilized linear regression
models with adjustments for baseline measures (which was based on the Fieller theorem for estimation of
incremental cost and incremental cost-effectiveness). The regression model was utilized to generate the
estimates of Quality Adjusted Life Years based on age, sex, and outcomes of microalbuminuria, HbA,
LDL, and levels of SBP over 24 months. The models for timepoints conferring to 18 and 24 months were
estimated utilizing the generalized estimating equations to account for correlation over time. To
determine the probabilities of association between the intervention and cost-effectiveness the
bootstrapping procedure was performed. Furthermore, the estimated QALY about each was calculated by
multiplying the patient level data by coefficients of regression.
Setting
The practice setting for the study was outpatient care, wherein the patients were provided with primary
level health care. The study was conducted in Washington, United States.
Dates to which data relate
The effectiveness and cost data were collected from a period of May 1, 2007, to October 31, 2008. The
cost of services and usage was measured using the computerized cost accounting records about the
healthcare plan. The intervention service costs were calculated using the actual salary of physicians and
30% overheads in addition to fringe benefit rates.
Link between effectiveness and cost data
The cost analysis was undertaken on the same patient sample to obtain the cost-effectiveness data. The
costing was undertaken prospectively.
Details about clinical evidence
Study sample
The authors reported their study to have 80% power in detecting the mean(SD) difference in scores of
SCL-20 by 0.165(0.5) points, and the 15% difference in patients who achieve disease control over all the
three measures of levels of glycated hemoglobin, systolic blood pressure, and LDL cholesterol levels. The
random sampling method was employed for patient recruitment. An initial sample size of 145 with an
attrition rate of 15% was decided upon, however for more efficient estimation of the overall impact of
intervention the recruitment target was increased to 290, out of which 73 individuals declined baseline
interviews. Therefore 214 patients were recruited successfully for the study. The 214 patients were
randomly assigned to intervention (106) and usual care groups (108). None of the patients were excluded
from the initial sample.
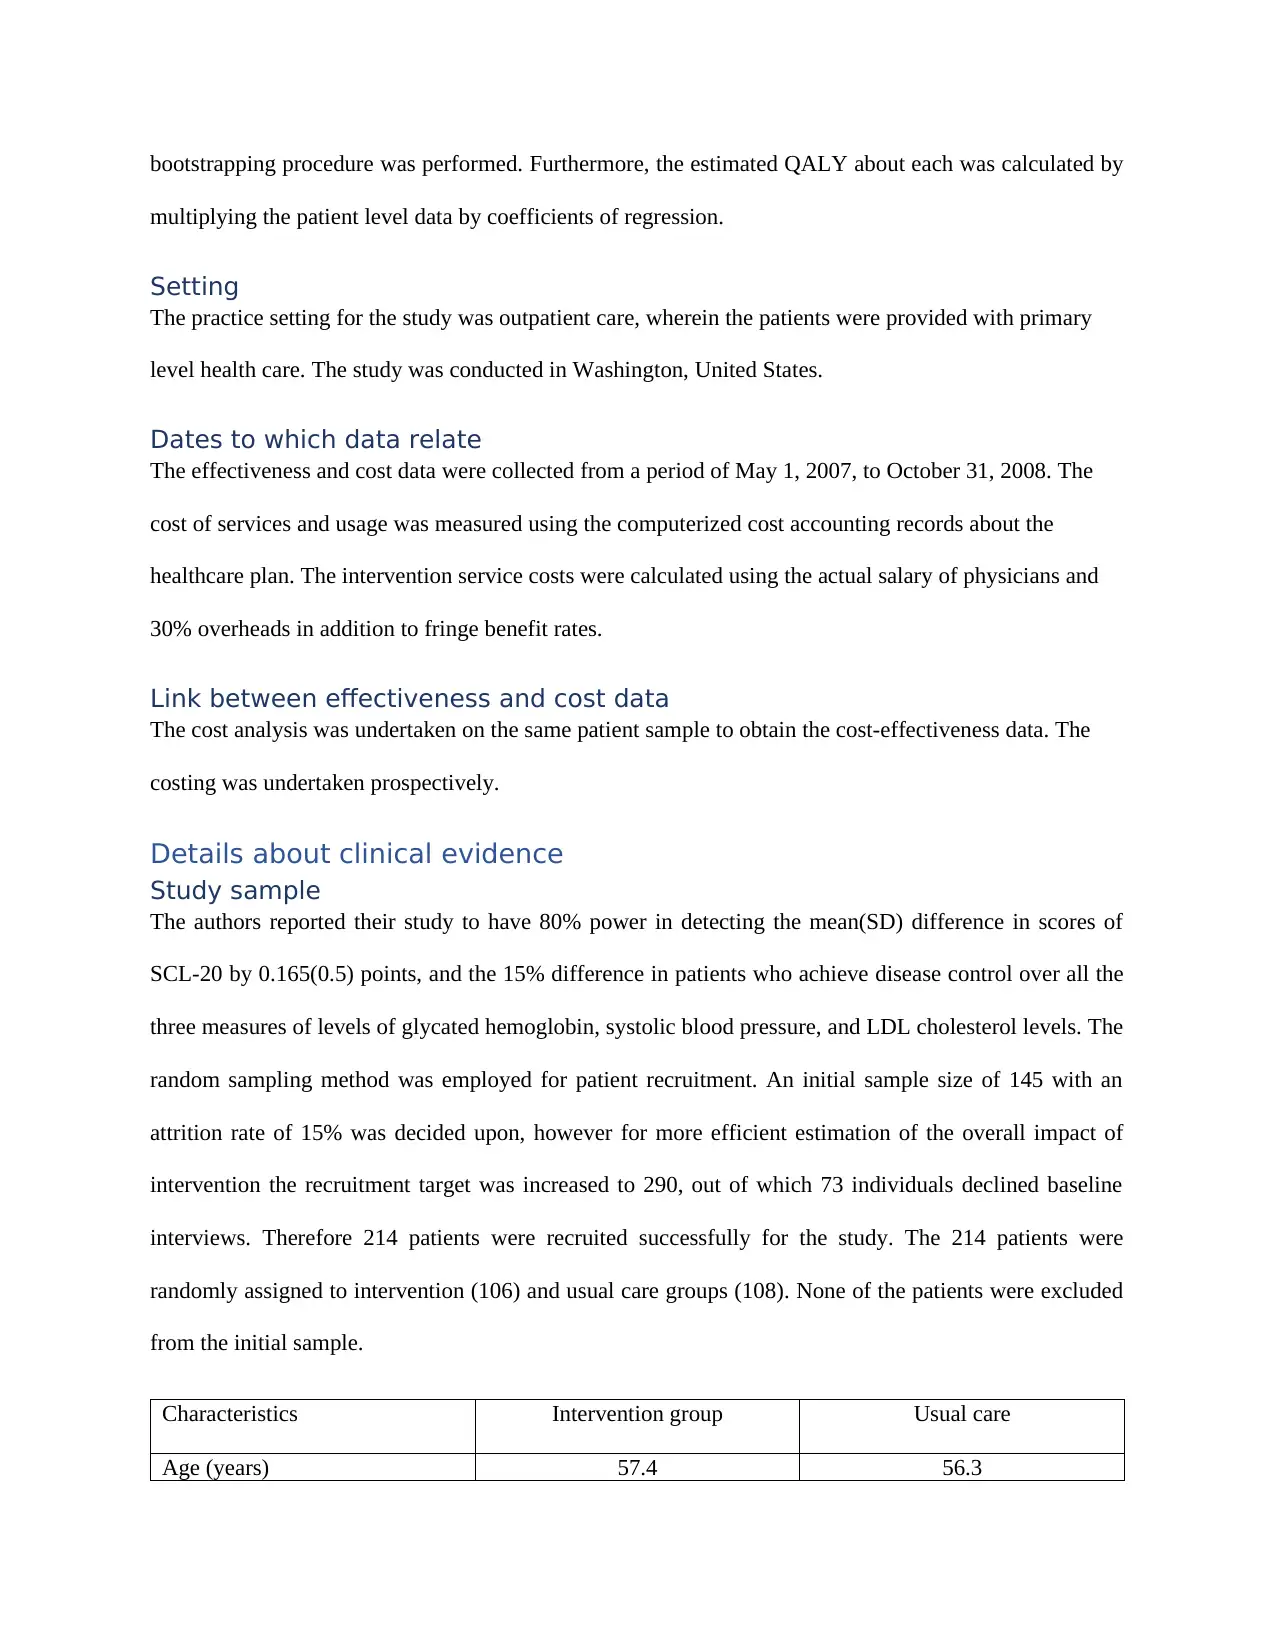
Characteristics Intervention group Usual care
Age (years) 57.4 56.3
multiplying the patient level data by coefficients of regression.
Setting
The practice setting for the study was outpatient care, wherein the patients were provided with primary
level health care. The study was conducted in Washington, United States.
Dates to which data relate
The effectiveness and cost data were collected from a period of May 1, 2007, to October 31, 2008. The
cost of services and usage was measured using the computerized cost accounting records about the
healthcare plan. The intervention service costs were calculated using the actual salary of physicians and
30% overheads in addition to fringe benefit rates.
Link between effectiveness and cost data
The cost analysis was undertaken on the same patient sample to obtain the cost-effectiveness data. The
costing was undertaken prospectively.
Details about clinical evidence
Study sample
The authors reported their study to have 80% power in detecting the mean(SD) difference in scores of
SCL-20 by 0.165(0.5) points, and the 15% difference in patients who achieve disease control over all the
three measures of levels of glycated hemoglobin, systolic blood pressure, and LDL cholesterol levels. The
random sampling method was employed for patient recruitment. An initial sample size of 145 with an
attrition rate of 15% was decided upon, however for more efficient estimation of the overall impact of
intervention the recruitment target was increased to 290, out of which 73 individuals declined baseline
interviews. Therefore 214 patients were recruited successfully for the study. The 214 patients were
randomly assigned to intervention (106) and usual care groups (108). None of the patients were excluded
from the initial sample.
Characteristics Intervention group Usual care
Age (years) 57.4 56.3
Percentage of females 48 56
Percentage of non-whites 25 22
Percentage of depression 72 76
Percentage of CHD 23 30
Percentage of diabetes 89 82
ableT 1 atient sample characteristics: P
Study design
The study opted for a multi-center randomized controlled trial design. The study was conducted across 14
GH clinics in Washington. The randomization was completed using a permuted-block design wherein
blocks of 4, 6, and eight patients were selected. As the randomized patients were then contacted by the
nurse managers therefore blinding was not possible. The patients were followed up for a period of 24-
months, at the end of which both the intervention and usual care groups showed 79% completion of
follow up.
Analysis of Effectiveness
The primary outcome measures comprised of evaluation of depressive symptoms, and the clinical
symptoms concerning the diseased conditions of CHD and diabetes. The depressive symptoms were
measured using the depression-free days. The depression-free days were calculated using the symptom
checklist-20 (SCL-20), with the threshold scores correlated with the Hamilton depression scores. The
clinical symptoms were assessed utilized lab assessments of glycated hemoglobin, systolic blood pressure
(SBP), and low-density lipoprotein cholesterol (LDL-C) levels. The analysis was based on an intention-
to-treat basis. The differences in the baseline measures for the assessment outcomes were adjusted using
linear regression.
Effectiveness results
The effectiveness results showed higher outpatient and inpatient costs for patients in the intervention
group as compared to the usual care patients. No significant differences were found between the two
Paraphrase This Document
Need a fresh take? Get an instant paraphrase of this document with our AI Paraphraser
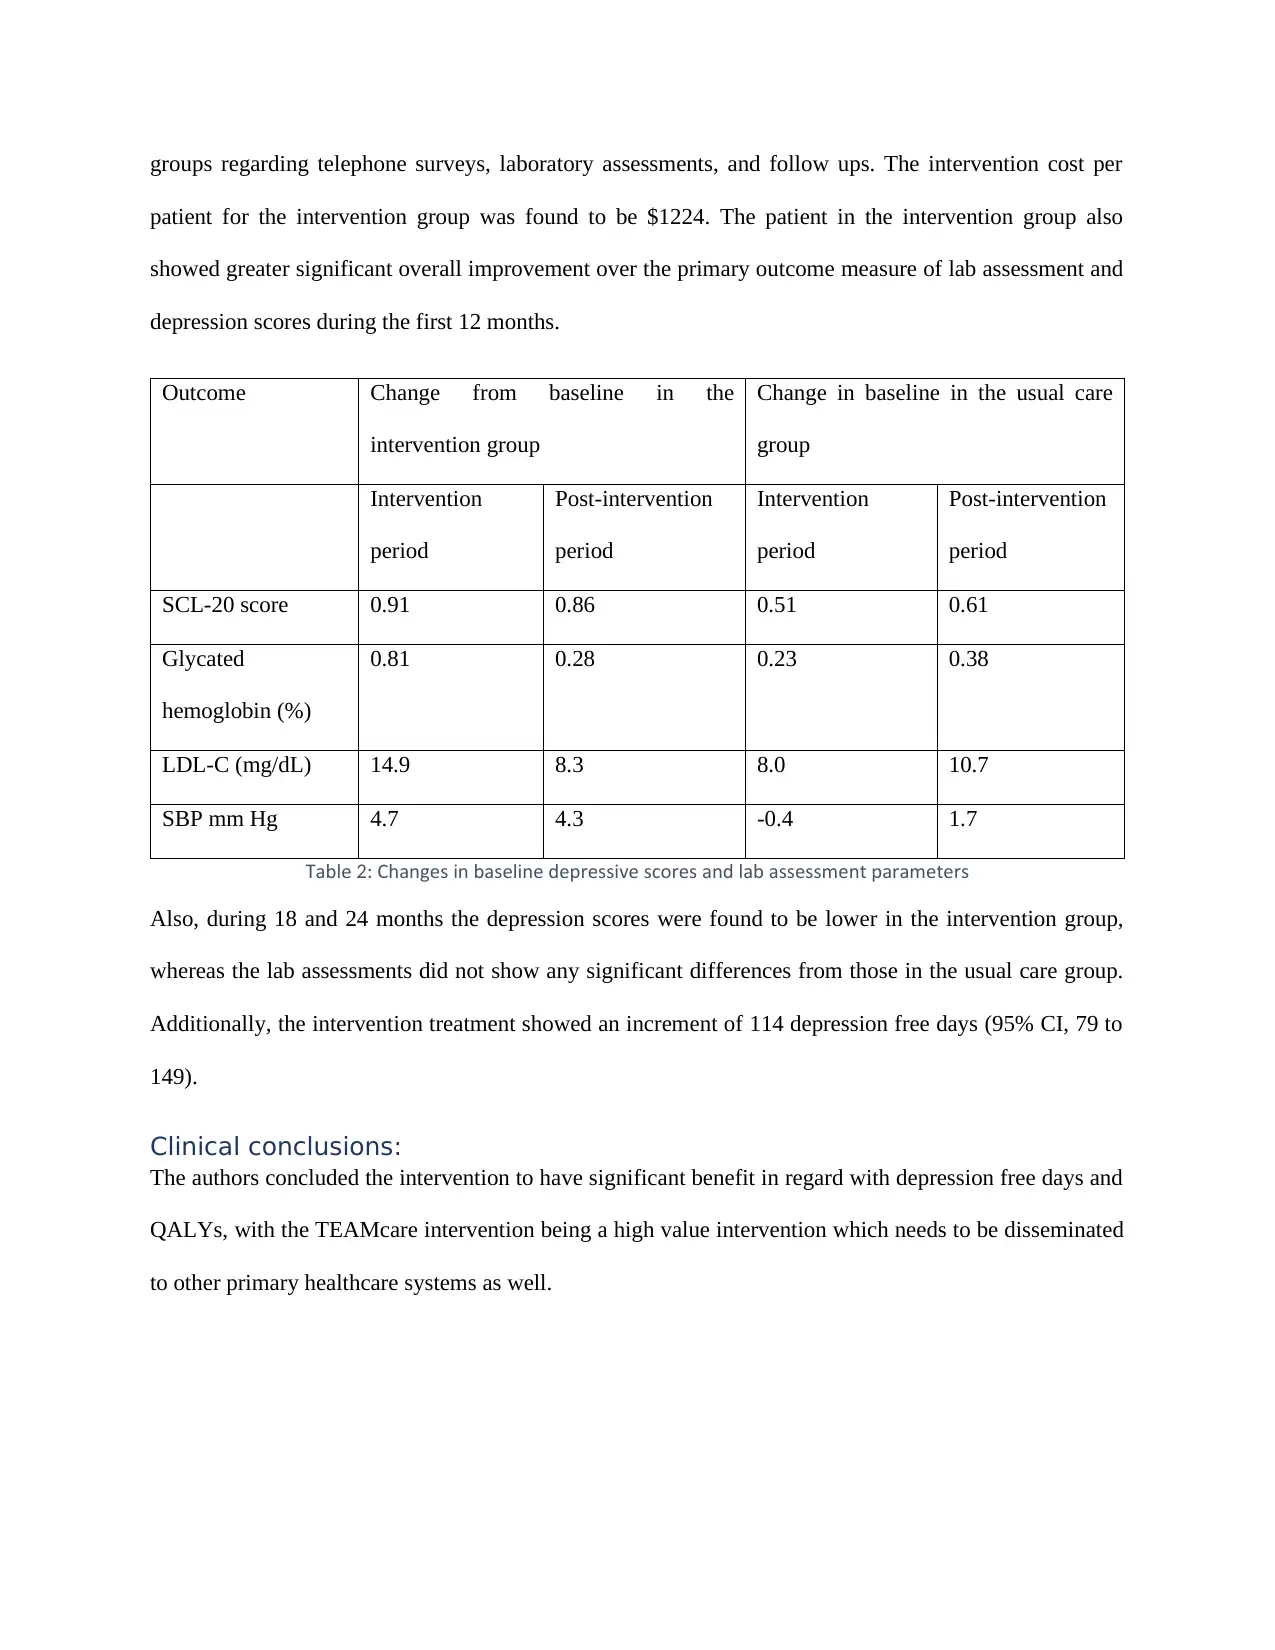
groups regarding telephone surveys, laboratory assessments, and follow ups. The intervention cost per
patient for the intervention group was found to be $1224. The patient in the intervention group also
showed greater significant overall improvement over the primary outcome measure of lab assessment and
depression scores during the first 12 months.
Outcome Change from baseline in the
intervention group
Change in baseline in the usual care
group
Intervention
period
Post-intervention
period
Intervention
period
Post-intervention
period
SCL-20 score 0.91 0.86 0.51 0.61
Glycated
hemoglobin (%)
0.81 0.28 0.23 0.38
LDL-C (mg/dL) 14.9 8.3 8.0 10.7
SBP mm Hg 4.7 4.3 -0.4 1.7
ableT 2 Changes in baseline depressive scores and lab assessment parameters:
Also, during 18 and 24 months the depression scores were found to be lower in the intervention group,
whereas the lab assessments did not show any significant differences from those in the usual care group.
Additionally, the intervention treatment showed an increment of 114 depression free days (95% CI, 79 to
149).
Clinical conclusions:
The authors concluded the intervention to have significant benefit in regard with depression free days and
QALYs, with the TEAMcare intervention being a high value intervention which needs to be disseminated
to other primary healthcare systems as well.
Section 3:
Economic analysis
Measure of health benefit used
The authors utilized the summary health benefit measure of Quality Adjusted Life Years (QALYs) which
was estimated using the changes in the difference of depression-free days and changes in the glycated
hemoglobin, SBP, and LDL-C level from baseline to period of 24 months between the intervention and
usual care patient groups. The 214 patients and 151 doctors were used to eliciting the values, and the
utilities were valued over the period of 24 months, that is, the intervention and post-intervention period.
The measurements were obtained using the telephonic surveys for depression scores, and lab assessments
as the patients visited the clinic. The utilities were measured using the estimates published in literature
instead of employing multi-attribute utility scales.
Direct costs:
The direct costs from the perspective of the healthcare system were included in the study. The usage and
costing of the service as obtained from Group Health’s (GH) computerized accounting records were
utilized. These costs included the budget costs regarding the services provided or purchased by the
clinics. The intervention costs of the study were also calculated which included physician salary, fringe
benefits, in-person nurse visits, telephone contact, fixed cost of physician supervision for each participant,
and information system support. The study also involved the outpatient costs which involved the
outpatient services purchased or provided by GH and the intervention staff.
Productivity costs:
Productivity costs were not considered.
Currency:
US dollar.
Statistical analysis of quantities/costs:
The assumptions of homoscedasticity were tested using the Breusch-Pagan/Cook-Weisbergtes for both
the outpatient and inpatient costs. The incremental effectiveness, incremental total outpatient costs and
incremental cost-effectiveness ratios for participants were calculated utilizing the repeated observations of
laboratory data, SCL-20 scores, and costs based on each interview. The incremental total outpatient costs
and gain in depression free days were adjusted for age, sex, total outpatient costs, and baseline depression
scores. A bootstrap technique with 10,000 replicates was used to determine the association of intervention
with cost effectiveness within the threshold of $20,000 per QALY for rapid dissemination.
Methods used to allow for uncertainty
The inpatient cost data was characterized by extreme outliers which resulted in uncertainty concerning the
impact of inpatient and total costs. However, the examination of uncertainty was restricted to
bootstrapping.
Results
Estimated benefits used in the economic analysis
The incremental benefit in QALYs was calculated for both intervention and usual care groups. The
baseline calculations showed the QALYs estimates were found to be similar for both the groups,
intervention = 12.5 (95% CI, 11.8 to 13.2) and usual care group 12.6 (95% CI, 11.8 to 13.3) with an
incremental change of 0.335 (95% CI, -0.18 to 0.85). The outpatient costs were reduced by $594 and
incremental outpatient costs also showed negative mean cost per QALY −$1773(95%CI, −$2878 to
$2878) indicating savings of $1773 per QALY for the intervention group. The intervention group also
demonstrated an estimate of additional QALYs of 0.062 (95% CI, 0.043 to 0.082) to 0.125 (95% CI,
0.086 to 0.163). The probability estimates showed the intervention to have 99.7% probability of costing
less than $20,000 per QALY. The duration of benefits from the proposed analysis conferred to a time of 2
years and was also signified by the authors to be insufficient of being generalized to other populations and
health plans. The data was not extrapolated beyond the trial or observation period. The side effects were
not relevant and not recorded. The sensitivity for benefits concerning the intervention group included the
diabetes nurse service cost. The results showed cost saving per QALY of $3297.
Cost results
The study reported the adjusted total costs regarding intervention versus usual care groups. The individual
total adjusted costs for intervention and comparator were not reported separately. The costs of adverse
Secure Best Marks with AI Grader
Need help grading? Try our AI Grader for instant feedback on your assignments.
effects were not considered to be relevant during costing. The total outpatient incremental costs for the
intervention group was $594 (95% CI, −$3421 to $2053) less than usual care group, whereas the
outpatient costs showed savings of $1773 [95% CI, −$2878 to $2878) for the intervention group. Also,
the outpatient costs per depression free days showed a difference of -$5.26 (95% CI, −$29.76 to $19.17).
The sensitivity analysis for the outpatient costs post reimbursement of the money associated with diabetes
nurse visit showed the interventions to result in saving of $1116 (95% CI, −$3768 to $1536) for total
outpatient costs, and $9.88 (95% CI, −$34.97 to $14.16) for outpatient costs per depression free day.
Synthesis of costs and benefits
The authors combined the costs and benefits as the primary analyses which examined the incremental
effectiveness, incremental cost-effectiveness ratios, and incremental total outpatient costs utilized the
repeated observations of laboratory data. The incremental cost-effectiveness ratios, therefore, helped in
combining the values of cost and QALYs which also conferred to the comprehension of the impact of the
intervention on the life value of patients using lab measures. The bootstrapping procedure involving the
10,000 estimated of mean outpatient costs and adjusted QALYs followed the division of incremental
costs with incremental QALYs. The incremental cost of $1773 per patient (95% CI, -$2878 to
$2878)/QALY was obtained.
Author’s conclusion
The significant impact of sustained multi-condition collaborative care was concluded regarding costs
effectiveness, as the intervention groups exhibited cost savings and higher QALYs. Therefore, the adults
suffering from co-morbid depression and poorly controlled chronic conditions of either diabetes, CHD or
both the systematic intervention program could prove to be helpful. The nurse care assisted management
of conditions could, therefore, help in the improvement of depression scores as well as the three markers
of clinical condition at no to modest additional costs.
Section 4: Critical commentary
Choice of comparator:
The choice of a suitable comparator is necessary for a cost-effectiveness study so that the obtained results
are suitable for decision making. The authors used the standard of care given in GH care clinics as the
comparator, whose efficacy regarding treatment of the co-morbid depression in CHD and diabetes was
evaluated against the intervention. It also constitutes as the most commonly used comparator for the cost-
effective analysis studies (12). The authors gave justification for the use of a comparator concerning the
research question which the study aimed to answer. The GH healthcare system’s 14 primary clinics
served as the standard care settings for the comparison of the intervention and ongoing practices. The
choice of the comparator is valid as the comparator intervention routinely finds usage with a large
population of 650000 in clinical practice in Washington state, and the, therefore, is validated for the
respective clinical population. However, the choice of particularly GH was not clear as the authors did not
justify the choice, and the selection of health setting about the specific geographic area also limits the
possible generalizability of the results to standard care settings in other states. The comparator, therefore,
limits the study results to the Washington state itself. The choice of comparator seems to resonate with
the current practices in the author’s settings. However the suggested alternative intervention was
described sufficiently which could be transferred to other clinical settings as well(13).
Validity of estimates of effectiveness
The study adopted a randomized control trial design, which is characterized by certain shortcomings. The
RCT design itself informs about the impact of intervention on the enrolled population concerning a
targeted outcome. In doing so, the authors gain information about the working of the respective
intervention, which in the present case, is the involvement of nurse care managers under the GH systems
of health care. However, the relevance and knowledge regarding the capacity claim of the intervention,
and will it work in other scenarios as well remains elusive (14). Therefore, the interpretation of the
results and conclusion becomes highly contextual wherein the administered intervention only supports the
special circumstances and does not necessarily has the potential to succeed in other settings as well (15).
The study samples were representative of the study population, and the groups were adjusted at the
baseline characters to facilitate comparison in the analysis.
On the other hand, the study design did not completely conform to the internal validity. It was free of
selection bias due to randomization and performance bias as the intervention and usual care regimes
completely adhered to study protocol (16,17). The significant attrition bias was not present as the cost-
effectiveness analysis was performed for the participants who complete 2 years follow up (18). However,
as the blinding of physicians and nurse investigators was not practiced therefore the study could have
suffered from detection bias (19). Also, the cost-effectiveness results completed only for those patients
who completed the complete 2 years follow up of the study. The effectiveness of the analysis was
adequate, and the study calculations were also powered to detect clinically significant results.
Validity of estimate of health benefit
The authors used the summary benefit measure of QALYs, which is a highly appropriate measure of
health outcome as it tends to incorporate the impact of both quantitative and qualitative aspects of life
(20). The estimation of the benefit measure depended on the depression-free days and the clinical
parameters of lab assessment. The utilities were measured on a cardinal scale where 0 indicated no quality
and 1 indicated complete quality. The incremental QALYs were therefore calculated by multiplying the
lower and upper bound increase in QALYs about full remission of depression. The clinical measures, on
the other hand, helped in the derivation of QALYs as the patient level data was multiplied with regression
coefficient. The use of such methods allowed the comparison of effectiveness and cost.
Further, the utility values were obtained from the published literature. The incremental outpatient
costs/QALY was calculated which sufficiently demonstrated the cost and efficiency benefits. However,
due to insufficiency, the inpatient data could not be utilized.
Validity of estimate of costs
While cost analysis continues to assume the harmonized position, still the variation in their usage
continues, and differences in economic perspectives result in such variations (21,22). As per the economic
Paraphrase This Document
Need a fresh take? Get an instant paraphrase of this document with our AI Paraphraser
perspective adopted in the study, all the necessary costs need to be calculated. The authors adopted the
perspective of the healthcare system which includes the payer perspective along with the indirect cost
involved in using the community preferences for selected utilities (23). All the necessary costs regarding
the GH system appear to have been calculated, including the inpatient and outpatient costs as well. All the
necessary inclusion to allow the author to make an informed decision were included without any
omissions. Concerning the costs of resource use and prices, the prices were obtained from the
computerized accounts of GH, and the prices for intervention costs were taken from the author’s setting.
The costs were not subjected to any price adjustments, or discounting procedures. The statistical analysis
for evaluation of the data was performed and involved bootstrapping of 10,000 replicate estimates to
assert the probability of association between effectiveness and cost outcomes. This approach for analysis
and presentation of uncertainty has been trusted as useful for cost-effectiveness study, wherein the
stochastic data is analyzed and expressed as confidence intervals(24). Concerning the reporting of cost
data, except for resource dates, cost and quantities, the price year and discount rates were not mentioned
separately.
Other issues
The authors in the comment section have effectively compared their results with the finding from other
relevant studies. Although, the comparison studies not necessarily focused on the co-morbid depression
conditions, however, the individual condition of diabetes, CHD, and depression were addressed. The
results obtained were found to be in harmony with the previous findings, wherein although the sustained
improvement in the intervention group may reduce post study completion however overall rates of
sustained improvement in conditions were found to be better in intervention groups. Also, the issue of
generalizability was addressed by the authors as well, wherein the patient populations and the nature of
clinical settings were emphasized to be the possibly characterized with variation. The impact of variation
was addressed through sensitivity analysis which was undertaken for both the outpatient incremental cost
analysis and the outpatient cost/QALY as well. The authors did not present the results selectively, and
even though the complete statistical tests were not shown, the total inpatient and outpatient costs for
unadjusted patient parameters were also shown. The scope was reflected in the conclusion as the studied
conferred to only one geographical region and single health plan, and further the limitations regarding
generalizability of the results were also highlighted.
Section 5: Future research
The analyzed cost-effectiveness study finds the greatest strength in its unique proposition of defining
intervention which aims at helping the patients to undergo holistic treatments. The authors also
highlighted the limitations regarding interpretation of data. Therefore, by expanding the boundaries of
research, beyond a single geographical area and healthcare plan, the study could be conducted across
multiple centers over the United States with the help of advanced hospital systems spread across different
states. Another significant preclusion to the given suggestion would be to conduct a study to identify the
healthcare use pattern of people from different states. The use of modeling techniques such as Markov
model could be utilized for activity recognition by utilizing the already existing data with the hospital
systems. The pervasive computing technique could help in recognition of concurrent activities of patients,
which can also help in the identification of the unknown patterns even in the absence of pre-defined
assumptions (25,26). Such a model could greatly help in identifying the prognostic factors which link the
co-morbid depression with diabetes and CHD and help in early identification as well. Even the mining of
the adverse drug reactions using the hidden Markov model could help avoid prescribing conflicting drugs
for the co-existing conditions (27). Concerning, the methods of study in the analyzed study, the inclusion
of productivity costs and indirect costs for expanding the research to societal perspective could allow the
researchers serve better to the patient perspective (28). It may also result in better engagement of the
target patient groups in the study and possibly result in higher rates of adherence as well. Adhering solely
to healthcare system results in a restricted perspective for payers which could lead to suboptimal
decisions concerning resource allocation (29). By the token of patient concern, the study sample needs to
include participants belonging to racially diverse backgrounds and socio-economic status, as its influence
has been observed on chronic medical conditions’ association with severe depressive symptoms (30,31).
For example, the chronic medical conditions find a positive relation with non-Hispanic whites and
African Americans, except Caribbean blacks (32). Therefore, a study design needs to consider the racial
basis of the association of depression and chronic illnesses as well.
References:
1. usereau D Drummond M etrou S Carswell C Moher D reenberg D Augustovski et alH , , P , , , G , . F, .
Consolidated ealth conomic valuation Reporting Standards C RS statement Cost ff ResourH E E ( HEE ) . E
Alloc. 2013;11(1):6.
2. Aniza ossein M tgonbayar R Munkhtuul mportance of economic evaluation in healthcareI, H , O , Y. I
decision making Community ealth. J H . 2008;14(1):1–11.
3. Shiell A awe old Comple interventions or comple systems mplications for health, H P, G L. x x ? I
economic evaluation M. B J. 2008;336(7656):1281–3.
4. Voinov Richie D ailey R Depression and Chronic Diseases t s ime for a SynergisticB, W , B K. : I I T
Mental ealth and rimary Care Approach rim Care Companion C S DisordH P . P N . 2013;15(2).
5. ang im S ae im S Shin S oon S et al Comorbidity of Depression with hysicalK HJ, K Y, B KY, K W, I , Y J , . P
Disorders Research and Clinical mplications Chonnam Med: I . J. 2015;51(1):8–18.
6. Atlantis ahey oster Collaborative care for comorbid depression and diabetes a systematicE, F P, F J. :
review and meta analysis M pen e- . B J O . 2014;4: 004706.
7. Schram M aan CA ouwer Depression and quality of life in patients with diabetes aT, B , P F. :
systematic review from the uropean depression in diabetes D D research consortium CurrE (E I ) .
Diabetes Rev. 2009;5(2):112–9.
8. Davidson Depression and Coronary eart Disease SR CardiolKW. H . I N . 2012;2012:1–18.
9. Carney RM reedland Depression in patients with coronary heart disease Am Med, F KE. . J .
S2008;121(11): 20–7.
10. reedland Carney RM Depression as a risk factor for adverse outcomes in coronary heartF KE, .
disease MC Med. B . 2013;11(131):1–9.
11. aton Russo in Schmittdiel Ciechanowski udman et al Cost effectiveness of aK W, J, L EHB, J, P, L E, . -
Multicondition Collaborative Care ntervention Arch en sychiatryI . G P . 2012;69(5):506–14.
Secure Best Marks with AI Grader
Need help grading? Try our AI Grader for instant feedback on your assignments.

12. iouani S arandos D orget ow o Select he est Comparator An nternational conomicZ , G , B I. H T T B ? I E
valuation uidelines Comparison Value eal AE G . H . 2016;19(7): 471–2.
13. net A Methods for health economic evaluations A guideline based on current practices inEU HT . -
uropeE . 2015.
14. Cartwright Munro he imitations of Randomized Controlled rials in redicting ff ectivenessN, E. T L T P E . J
val Clin ractE P . 2010;16(2):260–6.
15. Seckinelgin he olitics of lobal A DS nstitutionalization of Solidarity clusion of Conte t erlinH. T P G I : I , Ex x . B :
Springer; 2016.
16. Akobeng A Assessing the validity of clinical trials ediatr astroenterol utrK. . J P G N . 2008;47(3):277–
82.
17. hang eluso M ross C Viscoli CM ernan Adherence reporting in randomizedZ Z, P J, G P, , K WN.
controlled trials Clin rials. T . 2014;11(2):195–204.
18. erkman D Santaguida Viswanathan M Morton SC he mpirical vidence of ias in rialsB N , PL, , . T E E B T
Measuring reatment DifferencesT . 2014.
19. Van Spall oren A iss A owler RA ligibility criteria of randomized controlled trialsHG, T , K , F . E
published in high impact general medical journals a systematic sampling review AMA- : . J .
2007;11:1233–40.
20. hitehead S Ali S ealth outcomes in economic evaluation the A and utilities r Med ullW J, . H : Q LY . B B .
2010;96:5–21.
21. A V conomic Analysis methods nternet ealth services research and publicNIH. HT 101: . E [I ]. H
health cited Aug Available from. 2018 [ 2018 12]. :
https www nlm nih gov nichsr hta ta html:// . . . / / 101/ 10107.
22. Chalkidou Culyer A emzoff C erspective in conomic valuations of ealthcare nterventions inK, J, N . P E E H I
ow and Middle ncome Countries ne Size Does ot it All Report oL - -I : O N F . 2018. N .: 122.
23. arrison Mansley C Abbott A resnahan ay Smeeding ood Research racticesG LP, E , T , B BW, H JW, J. G P
for Measuring Drug Costs in Cost ff ectiveness Analyses A Societal erspective he S R Drug‐E : P : T I PO
Cost ask orce Report art Value ealT F —P II. H . 2009;13(1).
24. riggs A rien lackhouse S D Recent Advances in theB H, O’B B, B G. THINKING OUT I E THE BOX:
Analysis and resentation of ncertainty in Cost ff ectiveness Studies Annu Rev ublic ealP U -E . P H .
2002;23:377–401.
25. im elal S Cook D uman Activity Recognition and attern Discovery ervasive ComputK E, H , . H P . IEEE P .
2010;9(1):48.
26. otfi A angensiepen C Mahmoud SM Akhlaghinia M Smart homes for the elderly dementiaL , L , , J.
sufferers identification and prediction of abnormal behaviour Ambient ntell umaniz Comput: . J I H .
2012;3(3):205–18.
27. Sampathkumar Chen uo Mining Adverse Drug Reactions from online healthcare forumsH, XW, L B.
using idden Markov Model MC Med nform Decis MakH . B I . 2014;14:91.
28. ai ae e A Systematic Review of ealth conomic valuation Studies sing theT BWB, B YH, L Q. H E E U
atient s erspective Value ealP ’ P . H . 2016;19(6):903–8.
29. onsson en arguments for a societal perspective in the economic evaluation of medicalJ B. T
innovations ur eal con. E J H E . 2009;10(4):357–9.
30. sborn C atel A iu rott uchowski MS argreaves M et al Diabetes and Co morbidO Y, P K , L J, T HW, B , H K, . -
Depression among Racially Diverse ow income Adults Ann ehav Med, L - . B . 2010;41(3):300–9.
31. Assari S ankarani MM Chronic Medical Conditions and egative Affect Racial Variation in Reciprocal, L . N ;
Associations ver ime ront sychiatryO T . F P . 2016;7:140.
32. ankarani MM Assari S Association between number of comorbid medical conditions andL , .
depression among individuals with diabetes race and ethnic variations Diabetes Metab Disord; . J .
2015;14(56):1–8.
1 out of 18
Related Documents


Your All-in-One AI-Powered Toolkit for Academic Success.
+13062052269
info@desklib.com
Available 24*7 on WhatsApp / Email
![[object Object]](/_next/static/media/star-bottom.7253800d.svg)
Unlock your academic potential
© 2024 | Zucol Services PVT LTD | All rights reserved.