Lab Report: Investigating the Evolution of Multicellularity
VerifiedAdded on  2023/05/29
|18
|2641
|371
Report
AI Summary
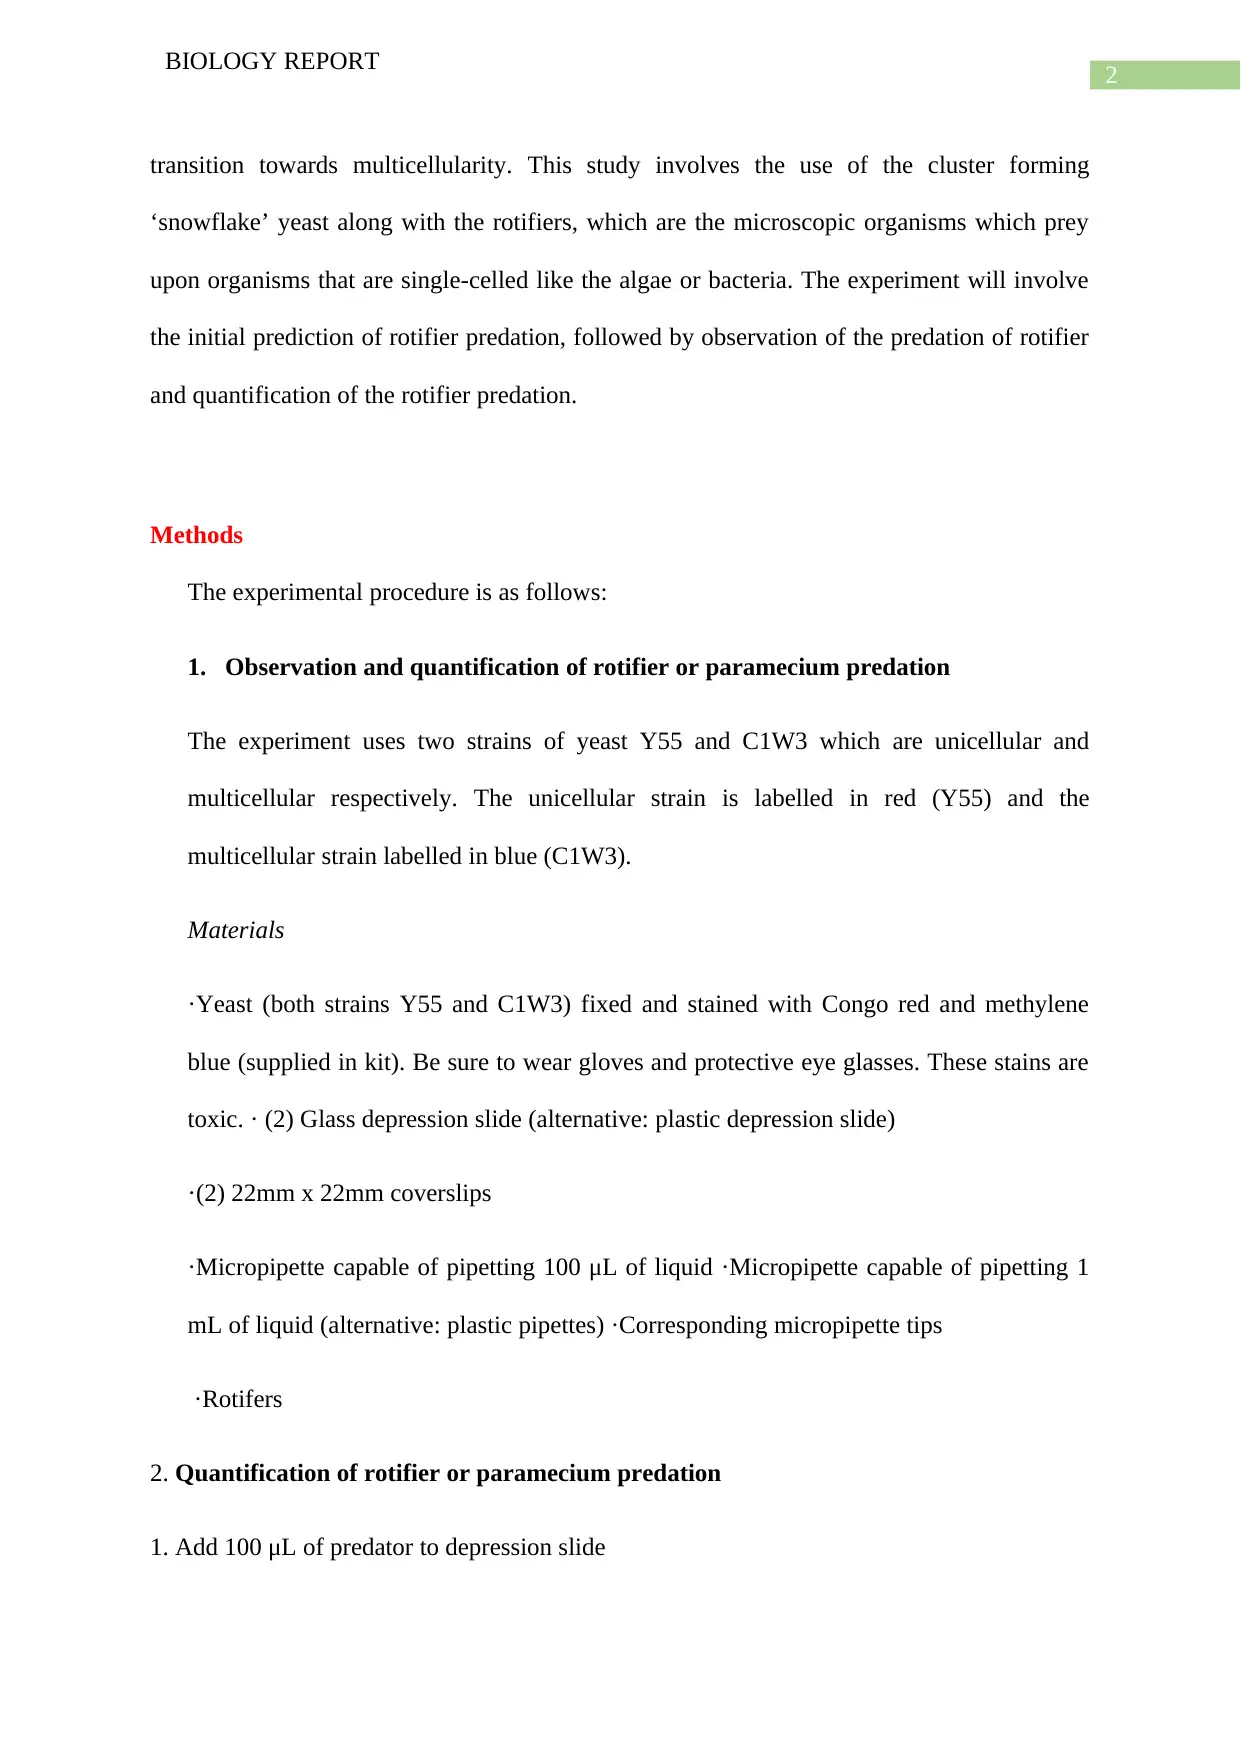
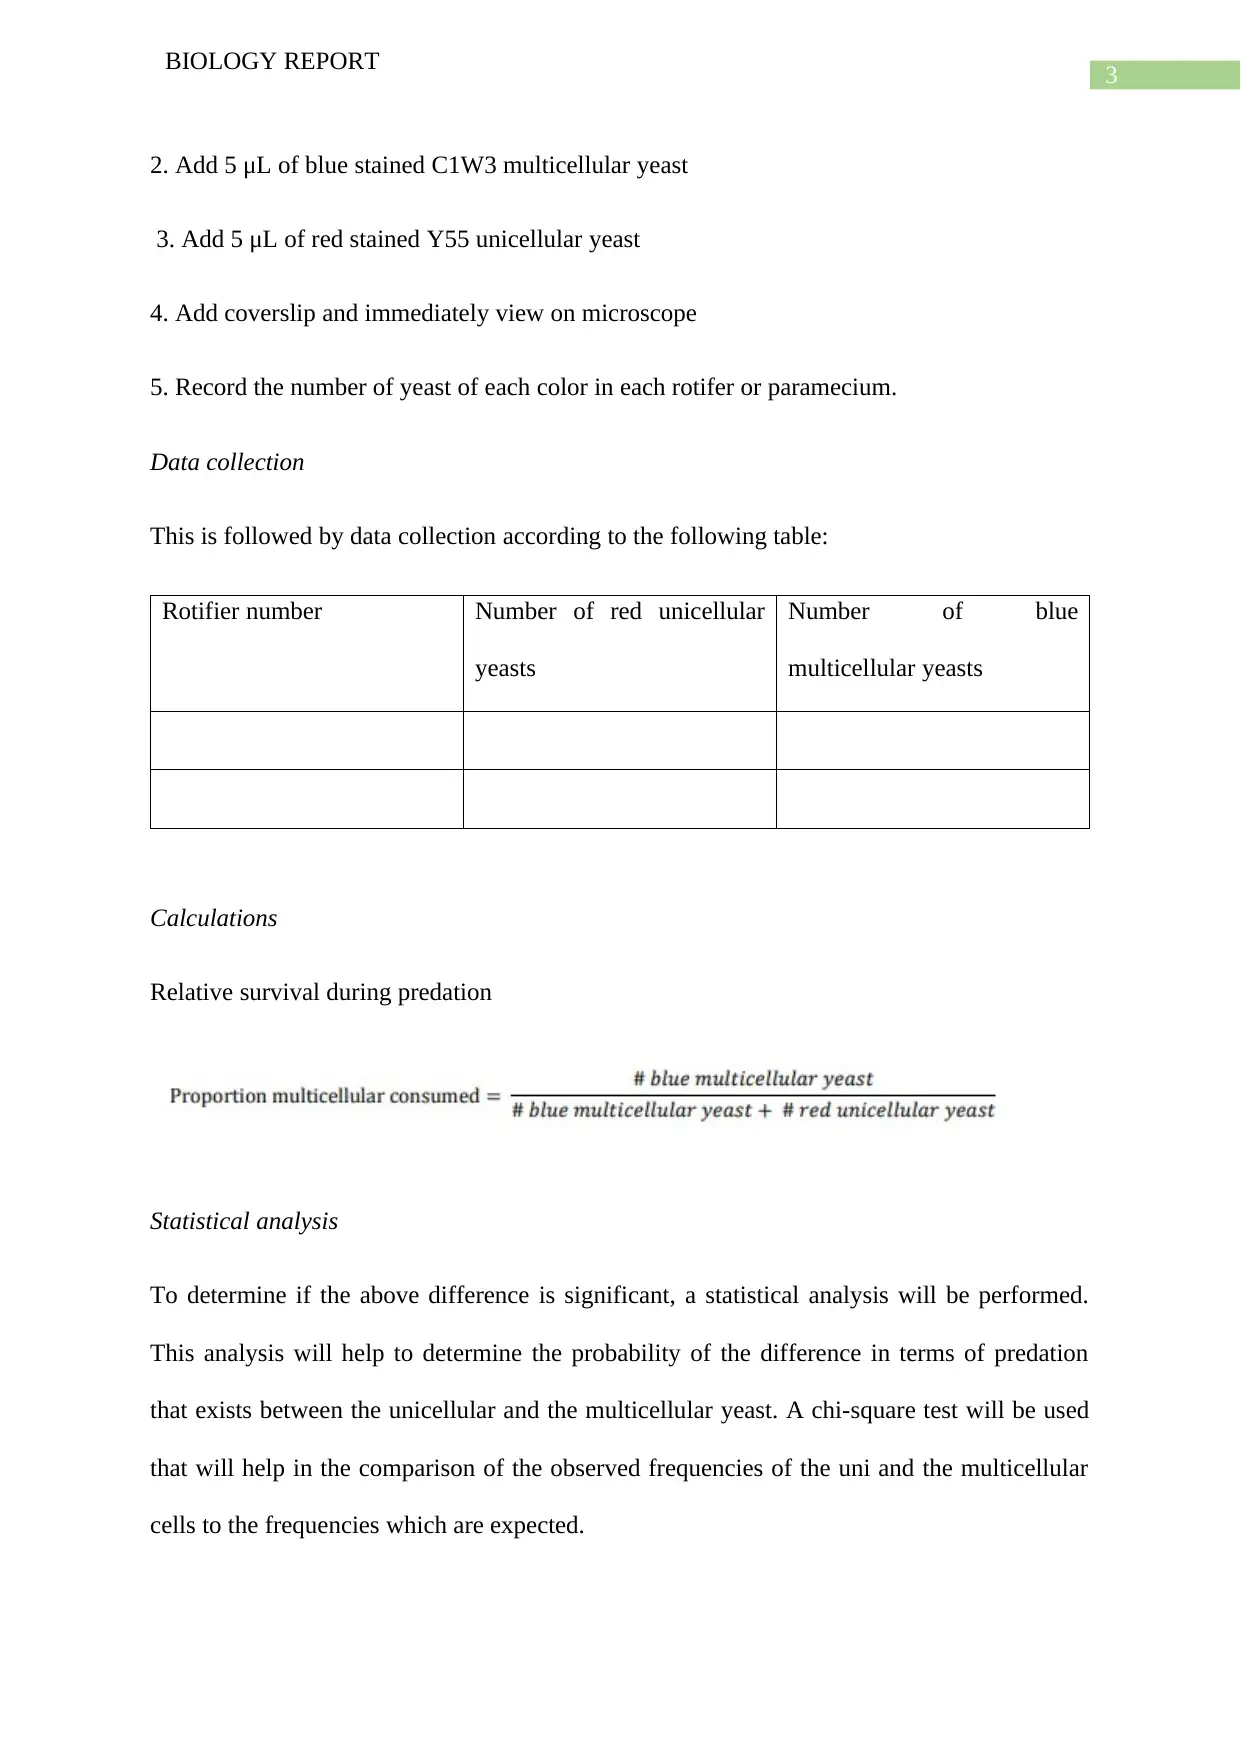
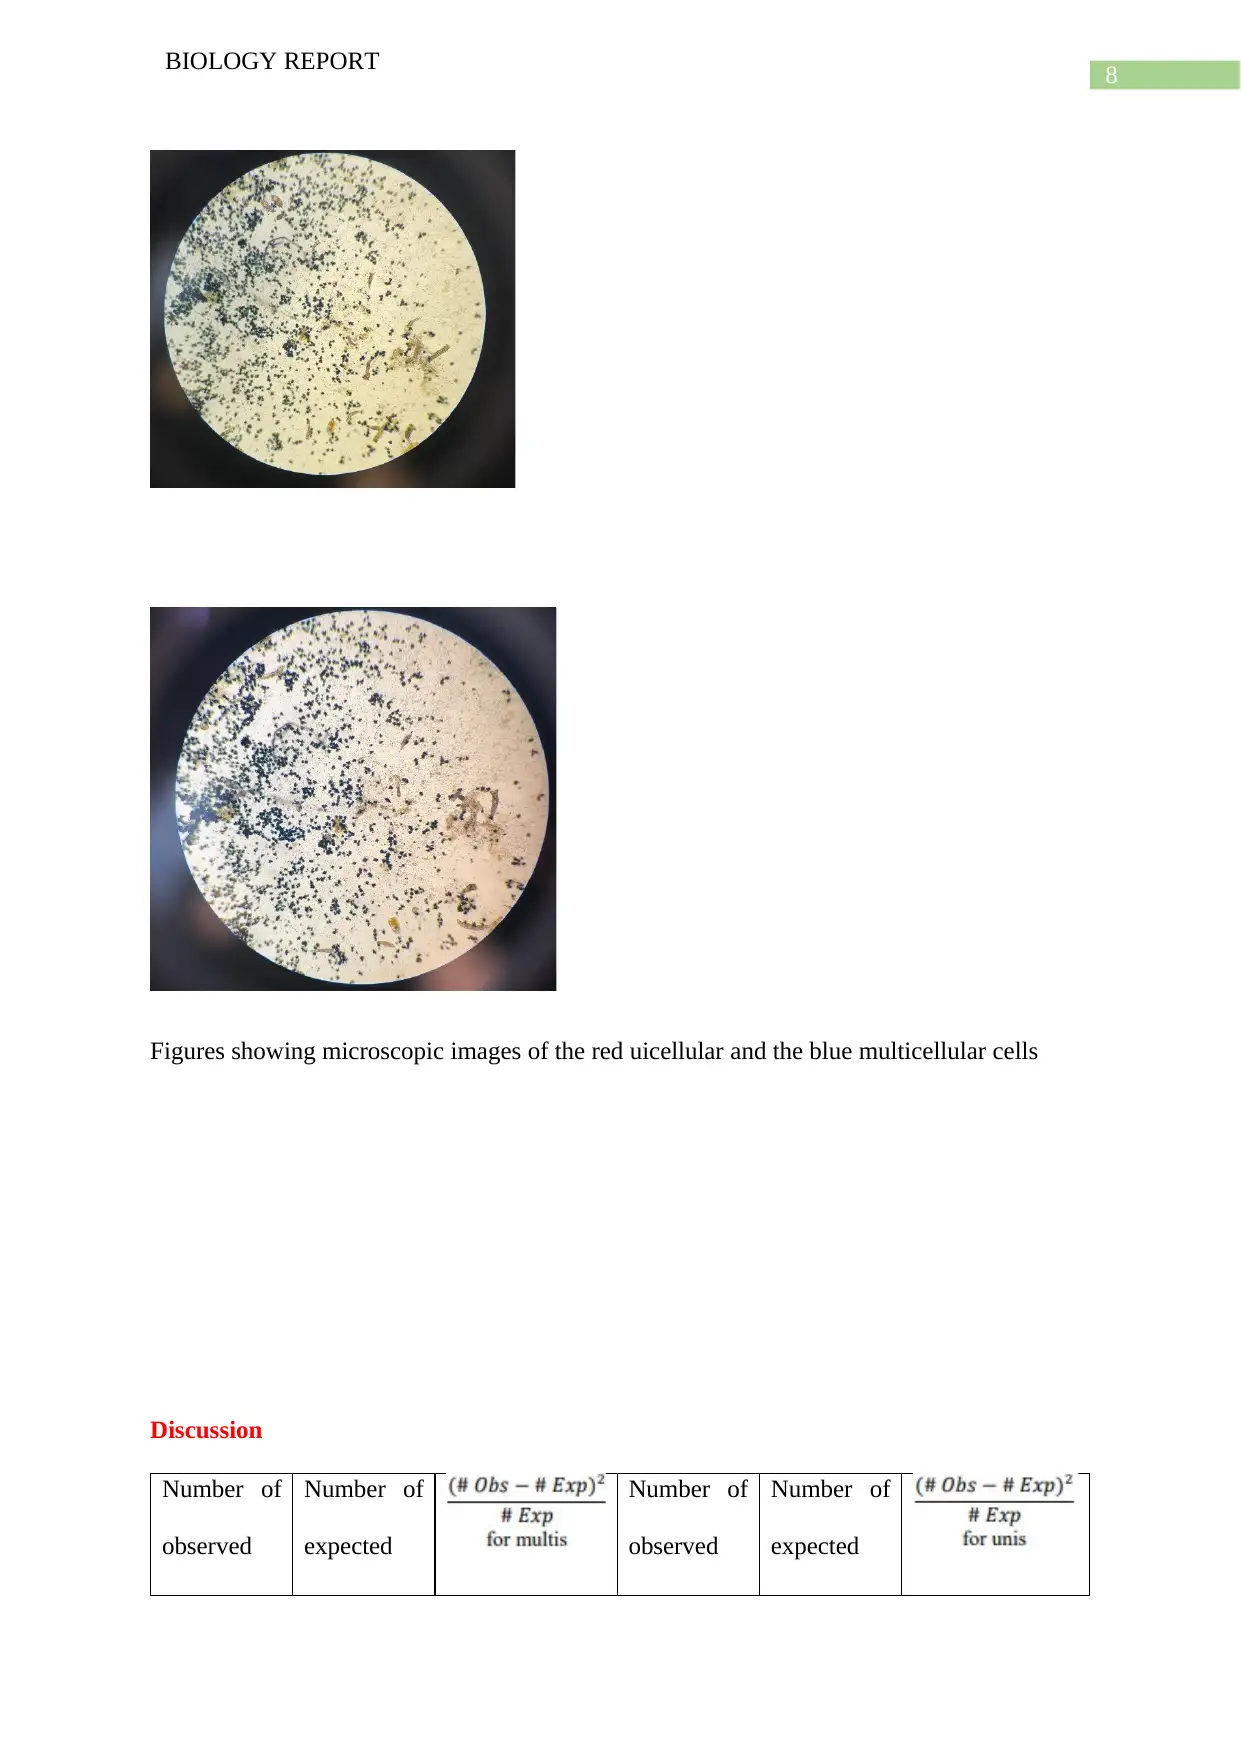
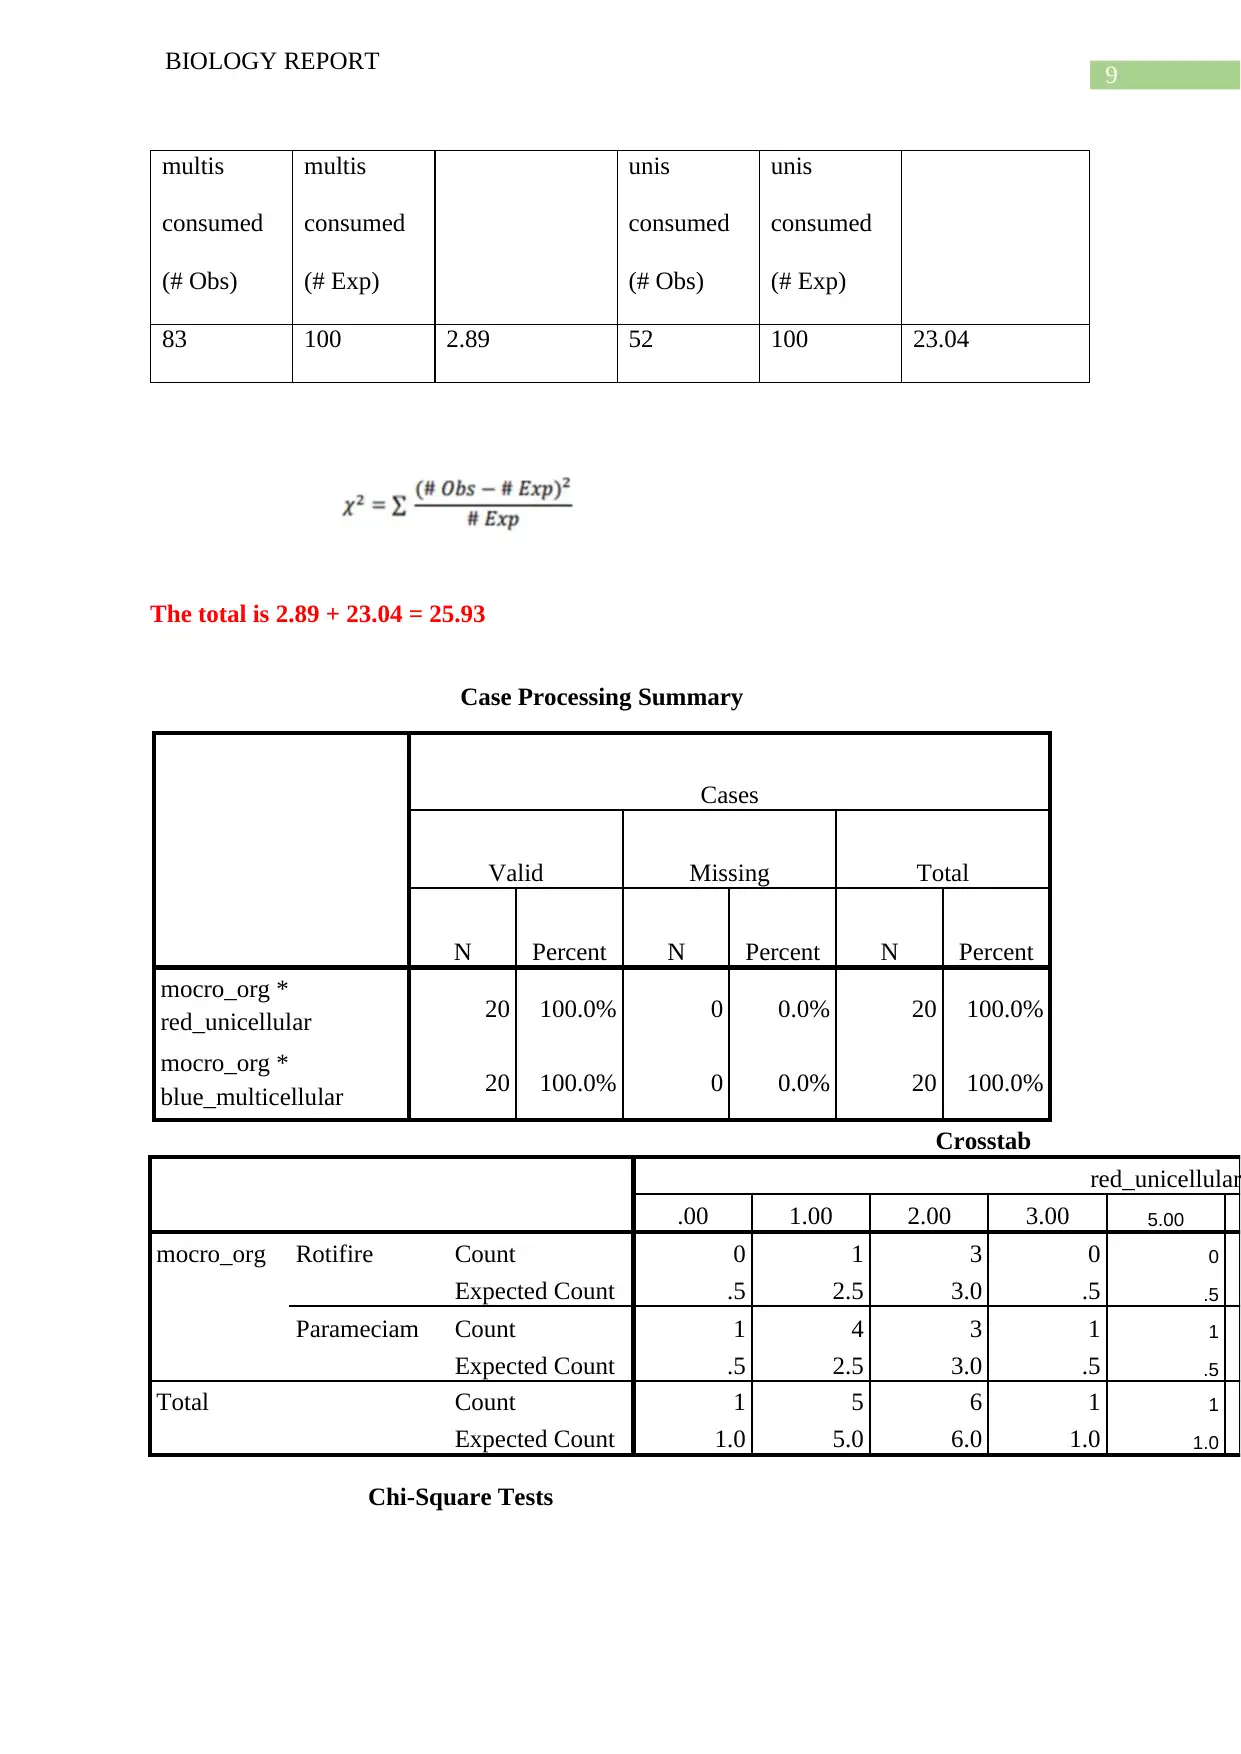
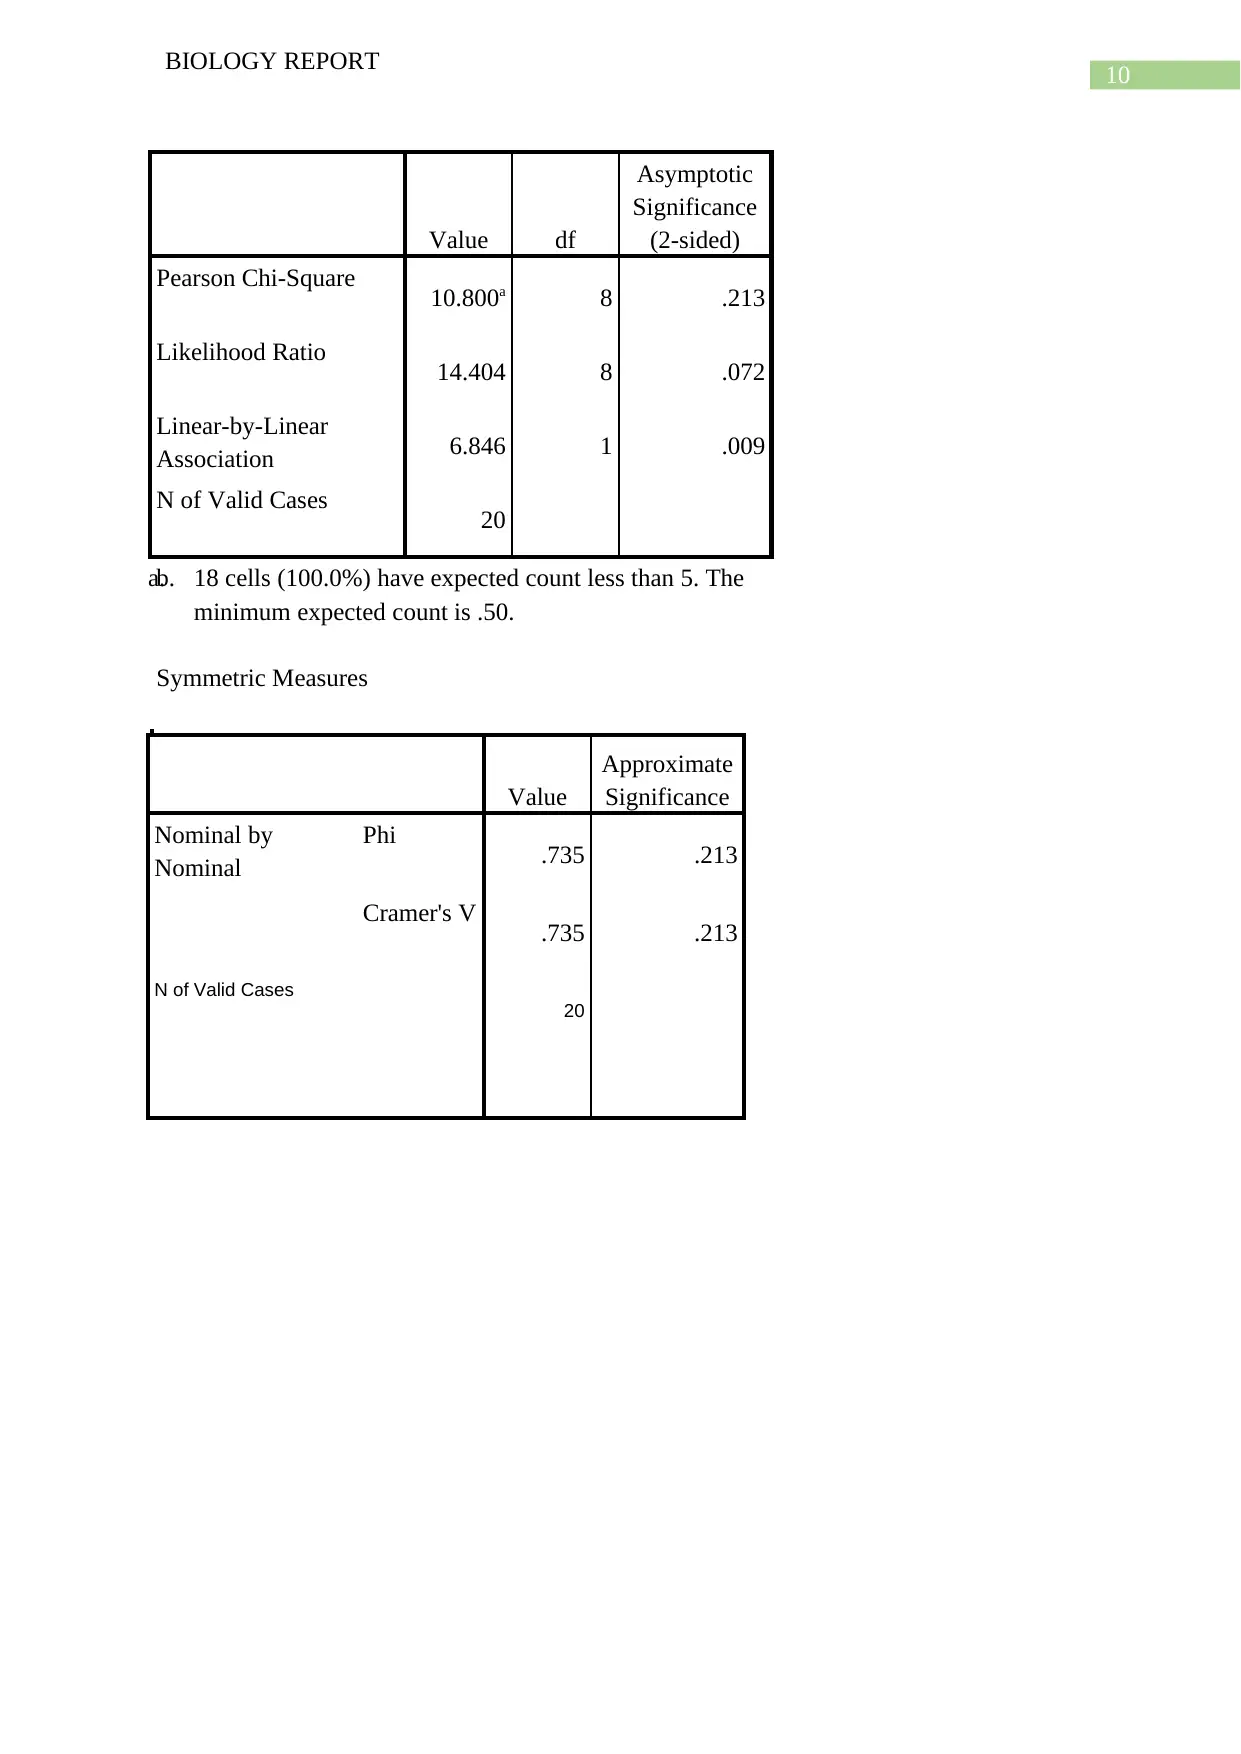
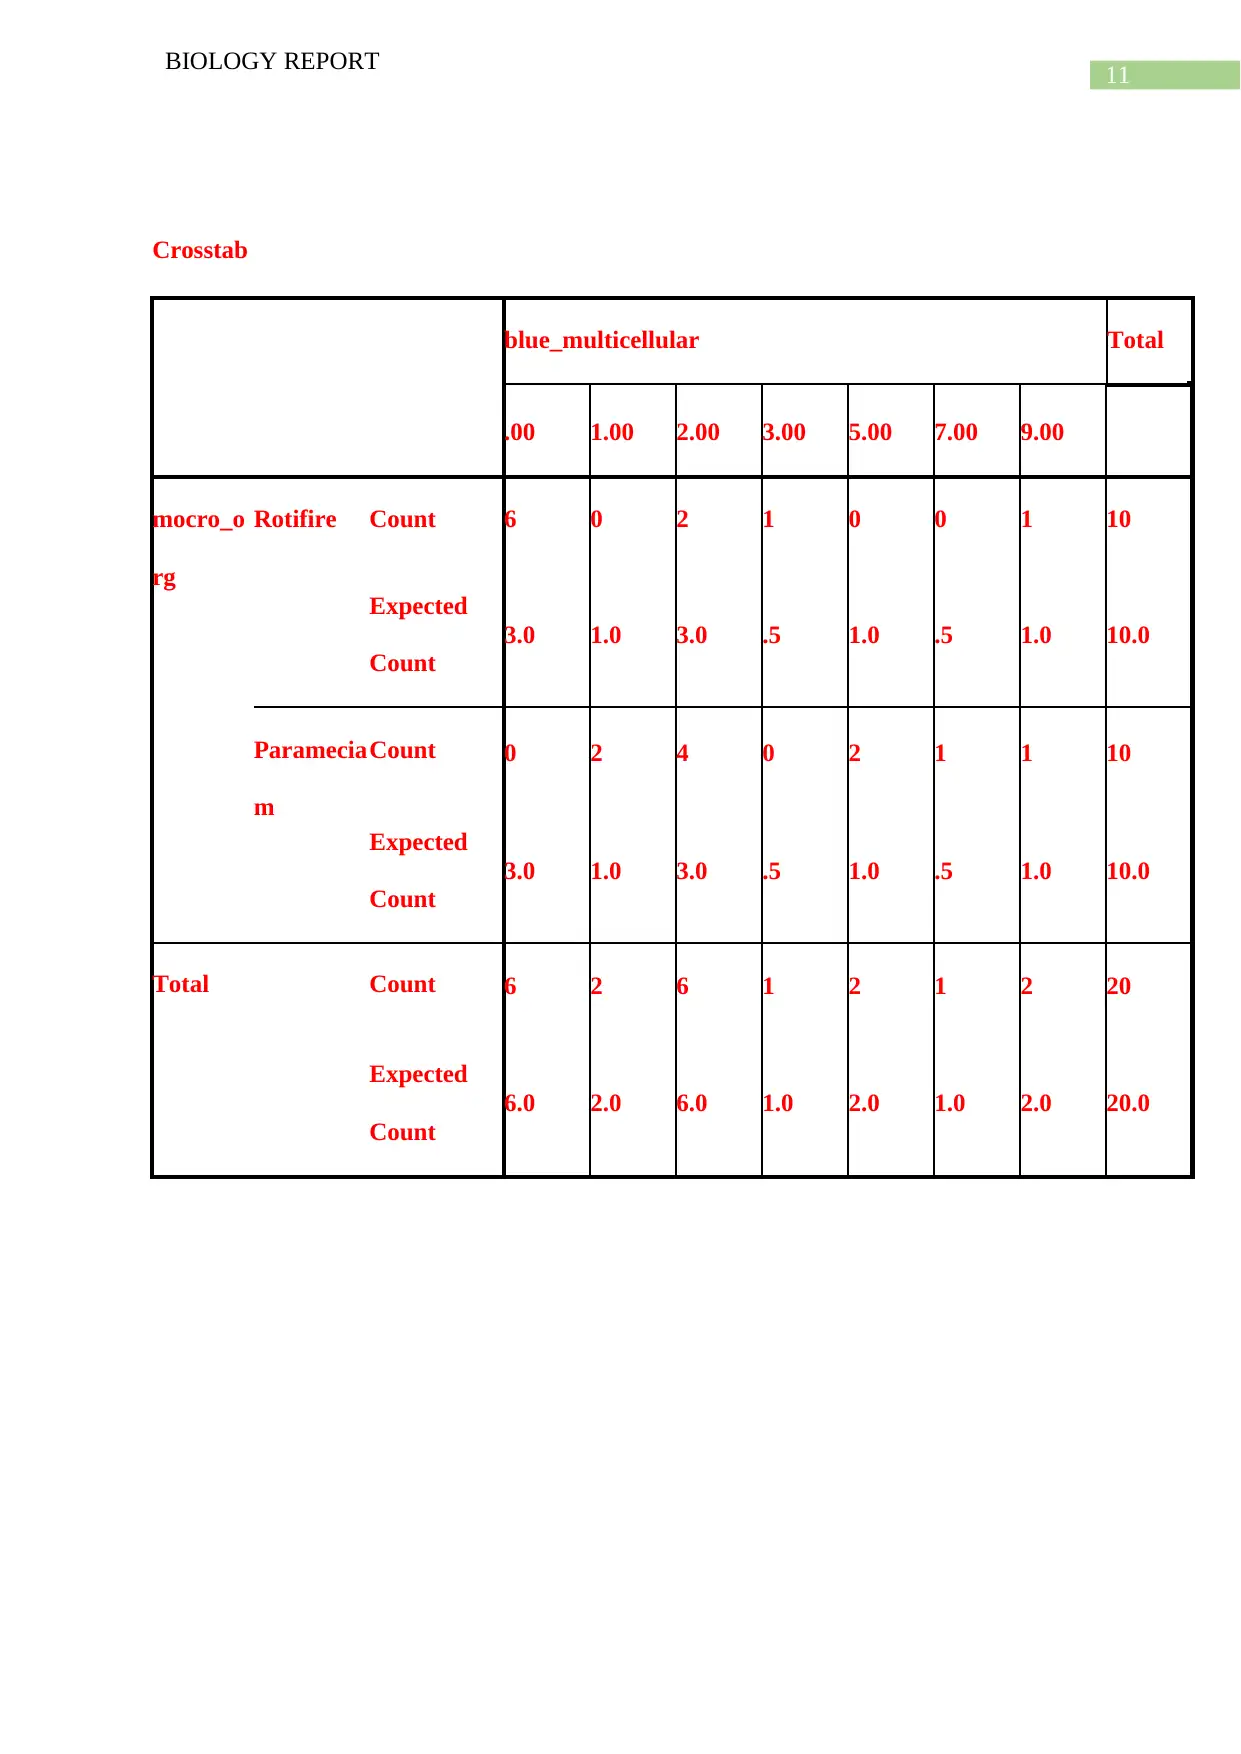
This biology report details an experiment designed to explore the evolution of multicellularity, focusing on the hypothesis that small-mouthed predators can select for multicellularity. The experiment involves observing rotifers preying on unicellular and multicellular yeast strains, quantifying the consumed yeast, and conducting a statistical analysis using a chi-square test. The results indicate a statistically significant difference in predation between the unicellular and multicellular yeast. The report discusses the implications of multicellularity, including its benefits and costs, and differentiates between multicellular organisms and multicelled clusters. It concludes by emphasizing the experiment's value in illustrating macroevolutionary changes through microevolutionary processes and offering insights into the evolutionary origins of multicellularity. Desklib provides access to this report and other study resources.

Running head: BIOLOGY REPORT
BIOLOGY REPORT
Name of the Student:
Name of the University:
Author Note:
BIOLOGY REPORT
Name of the Student:
Name of the University:
Author Note:
Paraphrase This Document
Need a fresh take? Get an instant paraphrase of this document with our AI Paraphraser

1
BIOLOGY REPORT
Abstract
For the evolution of the large and complex organisms on the earth, the concept of the
origin of multicellularity was transformative. However the topic of multicellularity remains
quite challenging till today in terms of education, therefore based on this a simple laboratory
experiment have been designed. This will be useful for the students to understand the
underlying hypothesis that put forwards that the small-mouthed predators are capable of
selection for multicellularity. By observing the rotifiers and the yeast provided (both
unicellular and multicellular strains) under the microscope separately, the hypothesis will be
tested. An examination will be conducted by feeding the yeast to the rotifiers followed by the
quantification of the unicellular and multicellular yeast consumed, followed by a statistical
analysis of the found results.
Introduction
From the unicellular ancestors, the multicellular organisms have evolved
independently throughout the history of life. However this multicellularity rose about 200
million ago therefore the steps of evolution are not exactly understood. Although studies
reveal that the transition in the multicellularity was a result of the shift in the nature of the
biological organization (Pentz et al. 2015). It is thought that the first step of this transition
was a result of the evolution of the clusters of the simple multicellular organisms. The
existing natural selection is able to distinguish between the whole multicellular clusters and
not only between the cells present within them (Ratcliff et al. 2014). The evolution of the
elevated complexity of multicellularity is often due to the adaptation in the cluster level. This
paper aims to highlight an experiment conducted in order to elucidate the first step of the

2
BIOLOGY REPORT
transition towards multicellularity. This study involves the use of the cluster forming
‘snowflake’ yeast along with the rotifiers, which are the microscopic organisms which prey
upon organisms that are single-celled like the algae or bacteria. The experiment will involve
the initial prediction of rotifier predation, followed by observation of the predation of rotifier
and quantification of the rotifier predation.
Methods
The experimental procedure is as follows:
1. Observation and quantification of rotifier or paramecium predation
The experiment uses two strains of yeast Y55 and C1W3 which are unicellular and
multicellular respectively. The unicellular strain is labelled in red (Y55) and the
multicellular strain labelled in blue (C1W3).
Materials
·Yeast (both strains Y55 and C1W3) fixed and stained with Congo red and methylene
blue (supplied in kit). Be sure to wear gloves and protective eye glasses. These stains are
toxic. · (2) Glass depression slide (alternative: plastic depression slide)
·(2) 22mm x 22mm coverslips
·Micropipette capable of pipetting 100 μL of liquid ·Micropipette capable of pipetting 1
mL of liquid (alternative: plastic pipettes) ·Corresponding micropipette tips
·Rotifers
2. Quantification of rotifier or paramecium predation
1. Add 100 μL of predator to depression slide
⊘ This is a preview!⊘
Do you want full access?
Subscribe today to unlock all pages.

Trusted by 1+ million students worldwide

3
BIOLOGY REPORT
2. Add 5 μL of blue stained C1W3 multicellular yeast
3. Add 5 μL of red stained Y55 unicellular yeast
4. Add coverslip and immediately view on microscope
5. Record the number of yeast of each color in each rotifer or paramecium.
Data collection
This is followed by data collection according to the following table:
Rotifier number Number of red unicellular
yeasts
Number of blue
multicellular yeasts
Calculations
Relative survival during predation
Statistical analysis
To determine if the above difference is significant, a statistical analysis will be performed.
This analysis will help to determine the probability of the difference in terms of predation
that exists between the unicellular and the multicellular yeast. A chi-square test will be used
that will help in the comparison of the observed frequencies of the uni and the multicellular
cells to the frequencies which are expected.
Paraphrase This Document
Need a fresh take? Get an instant paraphrase of this document with our AI Paraphraser

4
BIOLOGY REPORT
The following table will be filled out in order to conduct the chi-square analysis:
Results
BIOLOGY REPORT
The following table will be filled out in order to conduct the chi-square analysis:
Results

5
BIOLOGY REPORT
Rotifier number Number of red unicellular
yeasts
Number of blue
multicellular yeasts
1 10 0
2 2 0
3 7 3
4 13 0
5 10 2
6 2 0
7 1 0
8 2 0
9 11 2
10 7 9
11 0 5
12 3 7
13 1 5
14 2 9
15 1 2
16 1 2
BIOLOGY REPORT
Rotifier number Number of red unicellular
yeasts
Number of blue
multicellular yeasts
1 10 0
2 2 0
3 7 3
4 13 0
5 10 2
6 2 0
7 1 0
8 2 0
9 11 2
10 7 9
11 0 5
12 3 7
13 1 5
14 2 9
15 1 2
16 1 2
⊘ This is a preview!⊘
Do you want full access?
Subscribe today to unlock all pages.

Trusted by 1+ million students worldwide

6
BIOLOGY REPORT
17 2 2
18 1 2
19 2 1
20 5 1
Observations:
Which is the predominant yeast in the stomach of each rotifier?
- The red yeast is predominant (Y55 strain)
How do the rotifers eat?
- The rotifiers eat through vacuum feeding or vacuum engulfing.
Can yeast consumption be observed?
-In particular the red yeast can be viewed to be consumed.
How long does it take to fill their stomach?
- It takes about 7 minutes (Ratcliff et al. 2014).
Paraphrase This Document
Need a fresh take? Get an instant paraphrase of this document with our AI Paraphraser

7
BIOLOGY REPORT
Figures showing microscopic images of the blue multicellular cells
BIOLOGY REPORT
Figures showing microscopic images of the blue multicellular cells

8
BIOLOGY REPORT
Figures showing microscopic images of the red uicellular and the blue multicellular cells
Discussion
Number of
observed
Number of
expected
Number of
observed
Number of
expected
BIOLOGY REPORT
Figures showing microscopic images of the red uicellular and the blue multicellular cells
Discussion
Number of
observed
Number of
expected
Number of
observed
Number of
expected
⊘ This is a preview!⊘
Do you want full access?
Subscribe today to unlock all pages.

Trusted by 1+ million students worldwide

9
BIOLOGY REPORT
multis
consumed
(# Obs)
multis
consumed
(# Exp)
unis
consumed
(# Obs)
unis
consumed
(# Exp)
83 100 2.89 52 100 23.04
The total is 2.89 + 23.04 = 25.93
Case Processing Summary
Cases
Valid Missing Total
N Percent N Percent N Percent
mocro_org *
red_unicellular 20 100.0% 0 0.0% 20 100.0%
mocro_org *
blue_multicellular 20 100.0% 0 0.0% 20 100.0%
Crosstab
red_unicellular
.00 1.00 2.00 3.00 5.00
mocro_org Rotifire Count 0 1 3 0 0
Expected Count .5 2.5 3.0 .5 .5
Parameciam Count 1 4 3 1 1
Expected Count .5 2.5 3.0 .5 .5
Total Count 1 5 6 1 1
Expected Count 1.0 5.0 6.0 1.0 1.0
Chi-Square Tests
Paraphrase This Document
Need a fresh take? Get an instant paraphrase of this document with our AI Paraphraser

10
BIOLOGY REPORT
Value df
Asymptotic
Significance
(2-sided)
Pearson Chi-Square 10.800a 8 .213
Likelihood Ratio 14.404 8 .072
Linear-by-Linear
Association 6.846 1 .009
N of Valid Cases 20
a.b. 18 cells (100.0%) have expected count less than 5. The
minimum expected count is .50.
Symmetric Measures
Value
Approximate
Significance
Nominal by
Nominal
Phi .735 .213
Cramer's V .735 .213
N of Valid Cases
20

11
BIOLOGY REPORT
Crosstab
blue_multicellular Total
.00 1.00 2.00 3.00 5.00 7.00 9.00
mocro_o
rg
Rotifire Count 6 0 2 1 0 0 1 10
Expected
Count
3.0 1.0 3.0 .5 1.0 .5 1.0 10.0
Paramecia
m
Count 0 2 4 0 2 1 1 10
Expected
Count
3.0 1.0 3.0 .5 1.0 .5 1.0 10.0
Total Count 6 2 6 1 2 1 2 20
Expected
Count
6.0 2.0 6.0 1.0 2.0 1.0 2.0 20.0
⊘ This is a preview!⊘
Do you want full access?
Subscribe today to unlock all pages.

Trusted by 1+ million students worldwide
1 out of 18
Your All-in-One AI-Powered Toolkit for Academic Success.
 +13062052269
info@desklib.com
Available 24*7 on WhatsApp / Email
Unlock your academic potential
Copyright © 2020–2026 A2Z Services. All Rights Reserved. Developed and managed by ZUCOL.