Report on Marketing Analysis Using Multidimensional Scaling Techniques

Verified

Added on  2023/06/06

|6
|1032
|453
Report
AI Summary
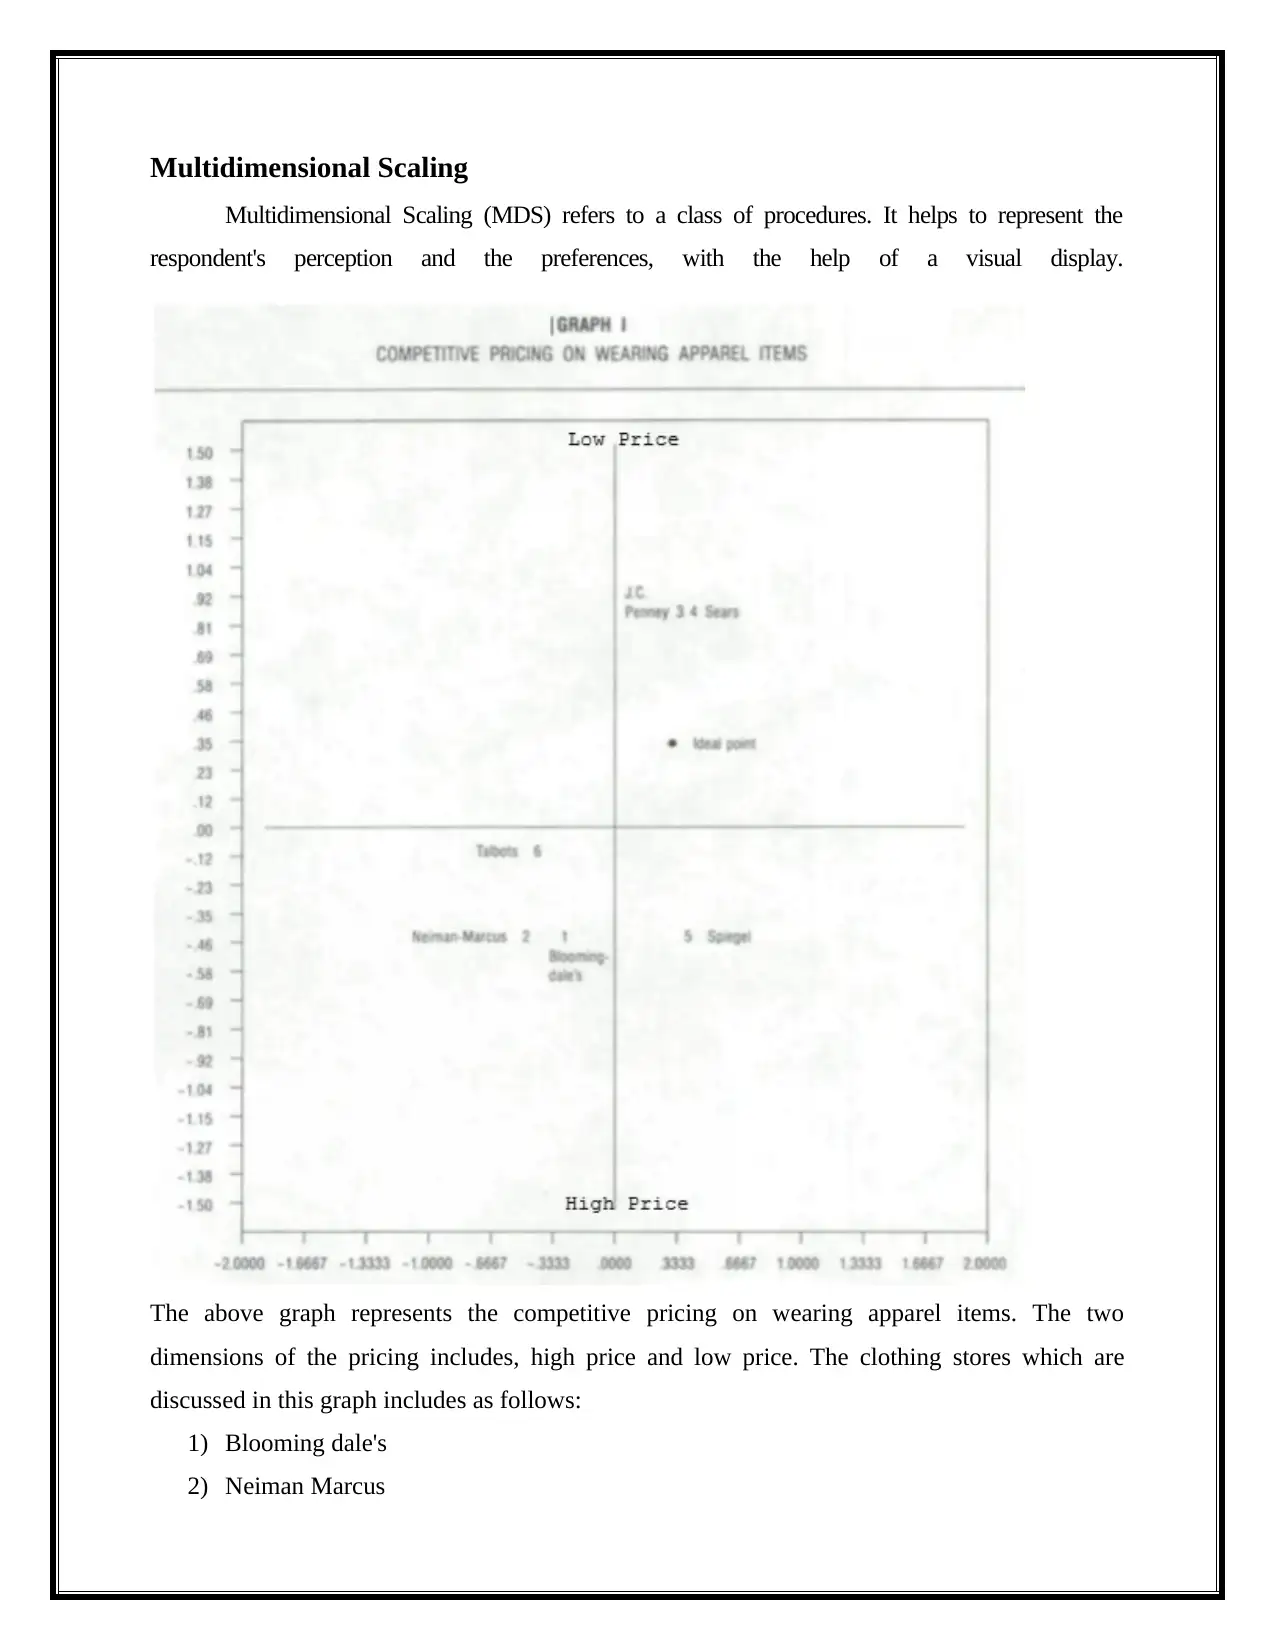
This report provides a detailed analysis of multidimensional scaling (MDS) and its application in marketing. It explains how MDS procedures help visualize consumer perceptions and preferences, using competitive pricing analysis of wearing apparel items as an example. The report discusses the objectives of MDS, including plotting data to create MDS maps and interpreting non-similar matrices on 2D scatter plots. It covers various MDS methods such as classical, metric, and non-metric MDS, and outlines the steps involved in conducting an MDS analysis, from problem formulation to assessing reliability and validity. The document also contrasts MDS with factor analysis, highlighting its ability to analyze any similarity or dissimilarity matrix. Concluding with a simple illustration demonstrating the logic of MDS assessing, emphasizing its use in clarifying separations in terms of hidden dimensions. Desklib provides solved assignments and past papers for students.
Document Page
Marketing Analysis
tabler-icon-diamond-filled.svg

Paraphrase This Document

Need a fresh take? Get an instant paraphrase of this document with our AI Paraphraser
Document Page
Multidimensional Scaling
Multidimensional Scaling (MDS) refers to a class of procedures. It helps to represent the
respondent's perception and the preferences, with the help of a visual display.
The above graph represents the competitive pricing on wearing apparel items. The two
dimensions of the pricing includes, high price and low price. The clothing stores which are
discussed in this graph includes as follows:
1) Blooming dale's
2) Neiman Marcus
Document Page
3) Talbots
4) Spiegel
5) JC Penney
6) Sears
The stores which are considered as high prices are,
1) Blooming dale's
2) Neiman Marcus
3) Talbots
4) Spiegel
The stores which are considered as low prices are,
1) JC Penney
2) Sears
The above mentioned stores are differentiated based on marketing analysis.
MDS analysis’ main objective is to plotting, so it is also denoted a MDS map. Further, MDS lets
to interpret the matrix which is not similar, on a 2D scatter plot. (Ncss-wpengine.netdna-
ssl.com, n.d.).
MDS is known to be a powerful tool, which supports the market researchers to determine the
brand or the position of the product, or helps to identify the market segments (Babinec, 2008). It
displays the perceived or the psychological relationship among the stimuli, in a geometric
relationships between the points in the multidimensional space. In the above example graph, it is
observed that the respondents considered JC Penney and Sears as low price. However, it
represents that the other stores are quite expensive. From the above graph it is easy to draw
conclusions, related to the difference of prices. Next, the MDS analyst identifies the underlying
factors which the respondents have represented.
MDS is considered as a family with various algorithms which are designed for arriving at an
optimal low-dimensional configuration (p = 2 or 3). The methods of MDS are listed below (Jung
D, 2013):
1) Classical MDS
2) Metric MDS
3) Non-metric MDS
Document Page
Objective of MDS
MDS works as follows:
a) The problem is formulated.
b) The input data is obtained.
c) The required MDS procedure is selected.
d) The required number of dimensions are decided.
e) The dimensions are labeled and configurations are interpreted.
f) Finally the reliability and validity is assessed.
MDS can be thought to be a contrasting option to factor any kind of analysis. All in all, the
objective of this analysis is to recognize the important basic measurements that enable the
specialist to clarify the watched similarities or the dissimilarities between the explored objects. In
factor analysis, the likenesses between the objects are communicated in the correlation matrix.
With MDS, you can investigate any sort of similarity or dissimilarity matrix, notwithstanding
correlation matrices.
The origin of MDS relies in psychometrics, where it mainly was proposed for helping to
understand the judgement of people for the set of objects’ similarity (Young, 2018).
MDS’ Logic
tabler-icon-diamond-filled.svg

Paraphrase This Document

Need a fresh take? Get an instant paraphrase of this document with our AI Paraphraser
Document Page
The accompanying straightforward illustration may exhibit the rationale of a MDS assessing.
Assume we take a matrix of separations between significant US urban communities from a
guide. We at that point investigate this matrix, determining that we need to replicate the
separations in light of two measurements. Because of the MDS investigation, we would in all
probability acquire a two-dimensional portrayal of the areas of the urban areas, that is, we would
essentially get a two-dimensional guide (Statsoft.com, 2018).
When all is said in done at that point, MDS endeavors to mastermind "objects" (significant urban
communities in this case) in a space with a specific number of measurements (two-dimensional
in this case) in order to imitate the watched separations. Therefore, we can "clarify" the
separations as far as hidden measurements; in our illustration, we could clarify the separations as
far as the two topographical measurements: north/south and east/west.
As in factor analysis, the genuine introduction of tomahawks in the last arrangement is
subjective. To come back to our case, we could pivot the guide in any capacity we need, the
separations between urban communities continue as before. Along these lines, the last
introduction of tomahawks in the plane or space is for the most part the aftereffect of an
emotional choice by the analyst, who will pick an introduction that can be most effectively
clarified. To come back to our illustration, we could have picked an introduction of tomahawks
other than north/south and east/west; in any case, that introduction is most advantageous in light
of the fact that it "bodes well" (i.e., it is effortlessly interpretable).
Document Page
References
Babinec, T. (2008). Data Use: Multidimensional scaling for market research. [online]
Quirks.com. Available at: https://www.quirks.com/articles/data-use-multidimensional-scaling-
for-market-research [Accessed 7 Sep. 2018].
Hout, M., Papesh, M. and Goldinger, S. (2012). Multidimensional scaling. Wiley
Interdisciplinary Reviews: Cognitive Science, 4(1), pp.93-103.
Jung D, S. (2013). Lecture 8: Multidimensional scaling. Advanced Applied Multivariate
Analysis. [online] Available at:
https://www.stat.pitt.edu/sungkyu/course/2221Fall13/lec8_mds_combined.pdf [Accessed 7 Sep.
2018].
Ncss-wpengine.netdna-ssl.com. (n.d.). Multidimensional Scaling. [online] Available at:
https://ncss-wpengine.netdna-ssl.com/wp-content/themes/ncss/pdf/Procedures/NCSS/
Multidimensional_Scaling.pdf [Accessed 7 Sep. 2018].
Statsoft.com. (2018). Multidimensional Scaling. [online] Available at:
http://www.statsoft.com/Textbook/Multidimensional-Scaling [Accessed 7 Sep. 2018].
Young, F. (2018). MULTIDIMENSIONAL SCALING. University of North Carolina.
chevron_up_icon
1 out of 6
circle_padding
hide_on_mobile
zoom_out_icon
[object Object]