logo

Case Study: Multiple Linear Regression for Insurance Rates

7 Pages769 Words83 Views
   

Added on  2023-06-11

About This Document

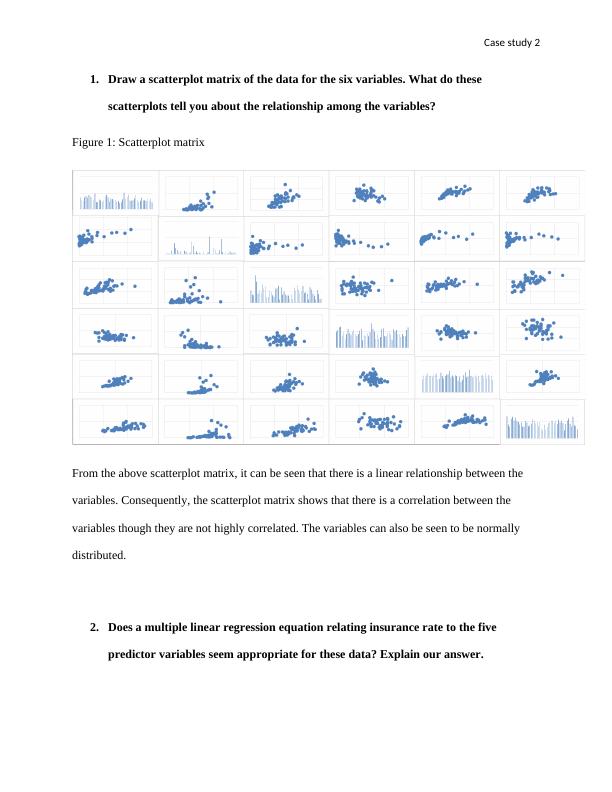
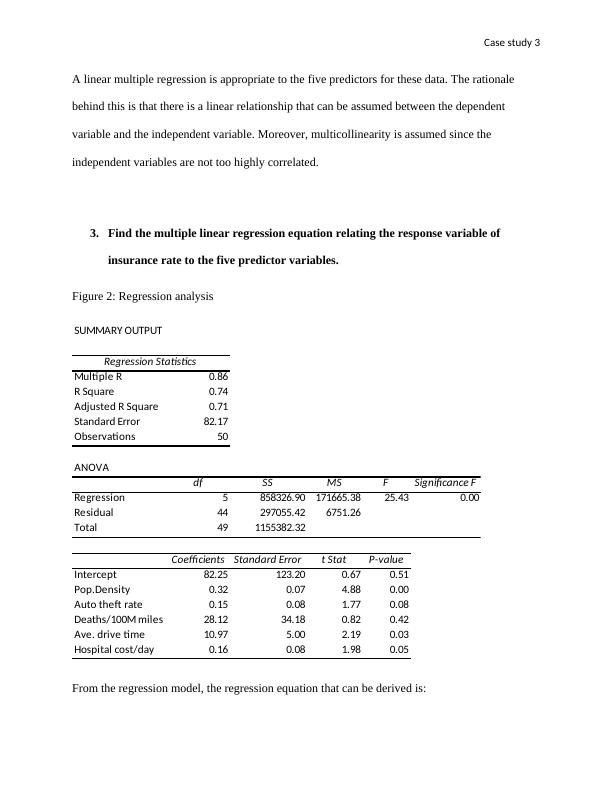
This case study explores the use of multiple linear regression to predict insurance rates based on five predictor variables. The study includes scatterplot matrix, regression equation, interpretation of coefficients, proportion of variation, residual plots, and assessment of predictor variables.

Case Study: Multiple Linear Regression for Insurance Rates

   Added on 2023-06-11

ShareRelated Documents
Running Header: Case Study 1
Case Study
Student’s name: Obaid Alshaali
Student’s ID:
Institution:
Case Study: Multiple Linear Regression for Insurance Rates_1
Case study 2
1. Draw a scatterplot matrix of the data for the six variables. What do these
scatterplots tell you about the relationship among the variables?
Figure 1: Scatterplot matrix
From the above scatterplot matrix, it can be seen that there is a linear relationship between the
variables. Consequently, the scatterplot matrix shows that there is a correlation between the
variables though they are not highly correlated. The variables can also be seen to be normally
distributed.
2. Does a multiple linear regression equation relating insurance rate to the five
predictor variables seem appropriate for these data? Explain our answer.
Case Study: Multiple Linear Regression for Insurance Rates_2
Case study 3
A linear multiple regression is appropriate to the five predictors for these data. The rationale
behind this is that there is a linear relationship that can be assumed between the dependent
variable and the independent variable. Moreover, multicollinearity is assumed since the
independent variables are not too highly correlated.
3. Find the multiple linear regression equation relating the response variable of
insurance rate to the five predictor variables.
Figure 2: Regression analysis
SUMMARY OUTPUT
Regression Statistics
Multiple R 0.86
R Square 0.74
Adjusted R Square 0.71
Standard Error 82.17
Observations 50
ANOVA
df SS MS F Significance F
Regression 5 858326.90 171665.38 25.43 0.00
Residual 44 297055.42 6751.26
Total 49 1155382.32
Coefficients Standard Error t Stat P-value
Intercept 82.25 123.20 0.67 0.51
Pop.Density 0.32 0.07 4.88 0.00
Auto theft rate 0.15 0.08 1.77 0.08
Deaths/100M miles 28.12 34.18 0.82 0.42
Ave. drive time 10.97 5.00 2.19 0.03
Hospital cost/day 0.16 0.08 1.98 0.05
From the regression model, the regression equation that can be derived is:
Case Study: Multiple Linear Regression for Insurance Rates_3

End of preview

Want to access all the pages? Upload your documents or become a member.