RMIT ECON1064 Assignment: Multipliers and Output/Input Analysis Report
VerifiedAdded on 2022/08/12
|8
|1536
|24
Homework Assignment
AI Summary
This assignment analyzes multipliers and output/input using a provided dataset, focusing on the Tasmanian aquaculture industry. It begins by calculating a technology matrix and type I multipliers for various industries. The analysis includes determining the economic impact of changes in final demand, identifying key industries, and applying Leontief input-output analysis to assess the effects of budget cuts. The assignment examines direct and indirect impacts, and identifies industries most affected by changes in external demand. The solution demonstrates the application of economic models to assess industry interdependencies and economic consequences. The analysis includes the calculation of the technology matrix, the inverse matrix and the type I multipliers for all the 32 industries.
Running head: MULTIPLIERS AND OUTPUT/INPUT ANALYSIS 1
Multipliers and Output/Input Analysis
Student’s Name
Institutional Affiliation
Multipliers and Output/Input Analysis
Student’s Name
Institutional Affiliation
Paraphrase This Document
Need a fresh take? Get an instant paraphrase of this document with our AI Paraphraser
MULTIPLIERS AND OUTPUT/INPUT ANALYSIS 2
Multipliers and Output/Input Analysis
Question c (i)
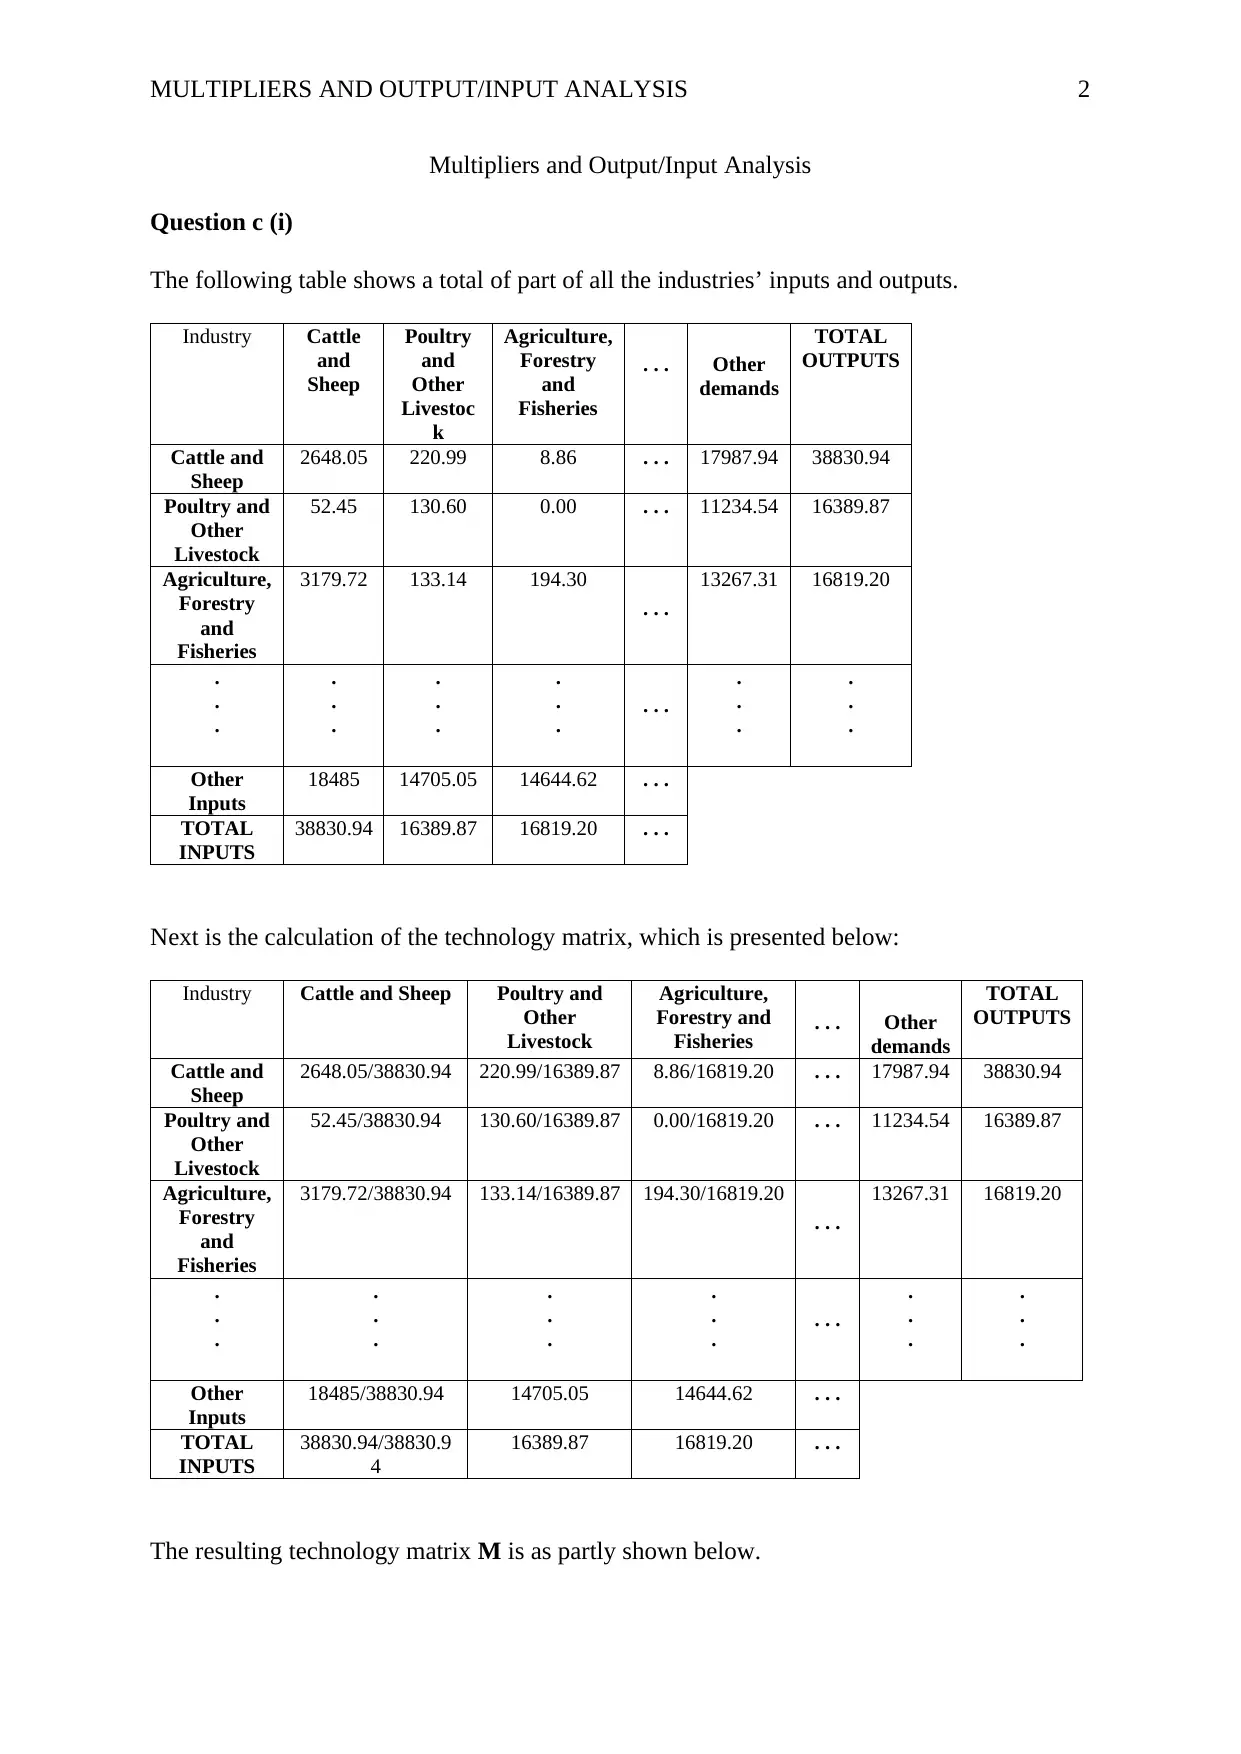
The following table shows a total of part of all the industries’ inputs and outputs.
Industry Cattle
and
Sheep
Poultry
and
Other
Livestoc
k
Agriculture,
Forestry
and
Fisheries
. . . Other
demands
TOTAL
OUTPUTS
Cattle and
Sheep
2648.05 220.99 8.86 . . . 17987.94 38830.94
Poultry and
Other
Livestock
52.45 130.60 0.00 . . . 11234.54 16389.87
Agriculture,
Forestry
and
Fisheries
3179.72 133.14 194.30
. . .
13267.31 16819.20
.
.
.
.
.
.
.
.
.
.
.
. . . .
.
.
.
.
.
.
Other
Inputs
18485 14705.05 14644.62 . . .
TOTAL
INPUTS
38830.94 16389.87 16819.20 . . .
Next is the calculation of the technology matrix, which is presented below:
Industry Cattle and Sheep Poultry and
Other
Livestock
Agriculture,
Forestry and
Fisheries . . . Other
demands
TOTAL
OUTPUTS
Cattle and
Sheep
2648.05/38830.94 220.99/16389.87 8.86/16819.20 . . . 17987.94 38830.94
Poultry and
Other
Livestock
52.45/38830.94 130.60/16389.87 0.00/16819.20 . . . 11234.54 16389.87
Agriculture,
Forestry
and
Fisheries
3179.72/38830.94 133.14/16389.87 194.30/16819.20
. . .
13267.31 16819.20
.
.
.
.
.
.
.
.
.
.
.
. . . .
.
.
.
.
.
.
Other
Inputs
18485/38830.94 14705.05 14644.62 . . .
TOTAL
INPUTS
38830.94/38830.9
4
16389.87 16819.20 . . .
The resulting technology matrix M is as partly shown below.
Multipliers and Output/Input Analysis
Question c (i)
The following table shows a total of part of all the industries’ inputs and outputs.
Industry Cattle
and
Sheep
Poultry
and
Other
Livestoc
k
Agriculture,
Forestry
and
Fisheries
. . . Other
demands
TOTAL
OUTPUTS
Cattle and
Sheep
2648.05 220.99 8.86 . . . 17987.94 38830.94
Poultry and
Other
Livestock
52.45 130.60 0.00 . . . 11234.54 16389.87
Agriculture,
Forestry
and
Fisheries
3179.72 133.14 194.30
. . .
13267.31 16819.20
.
.
.
.
.
.
.
.
.
.
.
. . . .
.
.
.
.
.
.
Other
Inputs
18485 14705.05 14644.62 . . .
TOTAL
INPUTS
38830.94 16389.87 16819.20 . . .
Next is the calculation of the technology matrix, which is presented below:
Industry Cattle and Sheep Poultry and
Other
Livestock
Agriculture,
Forestry and
Fisheries . . . Other
demands
TOTAL
OUTPUTS
Cattle and
Sheep
2648.05/38830.94 220.99/16389.87 8.86/16819.20 . . . 17987.94 38830.94
Poultry and
Other
Livestock
52.45/38830.94 130.60/16389.87 0.00/16819.20 . . . 11234.54 16389.87
Agriculture,
Forestry
and
Fisheries
3179.72/38830.94 133.14/16389.87 194.30/16819.20
. . .
13267.31 16819.20
.
.
.
.
.
.
.
.
.
.
.
. . . .
.
.
.
.
.
.
Other
Inputs
18485/38830.94 14705.05 14644.62 . . .
TOTAL
INPUTS
38830.94/38830.9
4
16389.87 16819.20 . . .
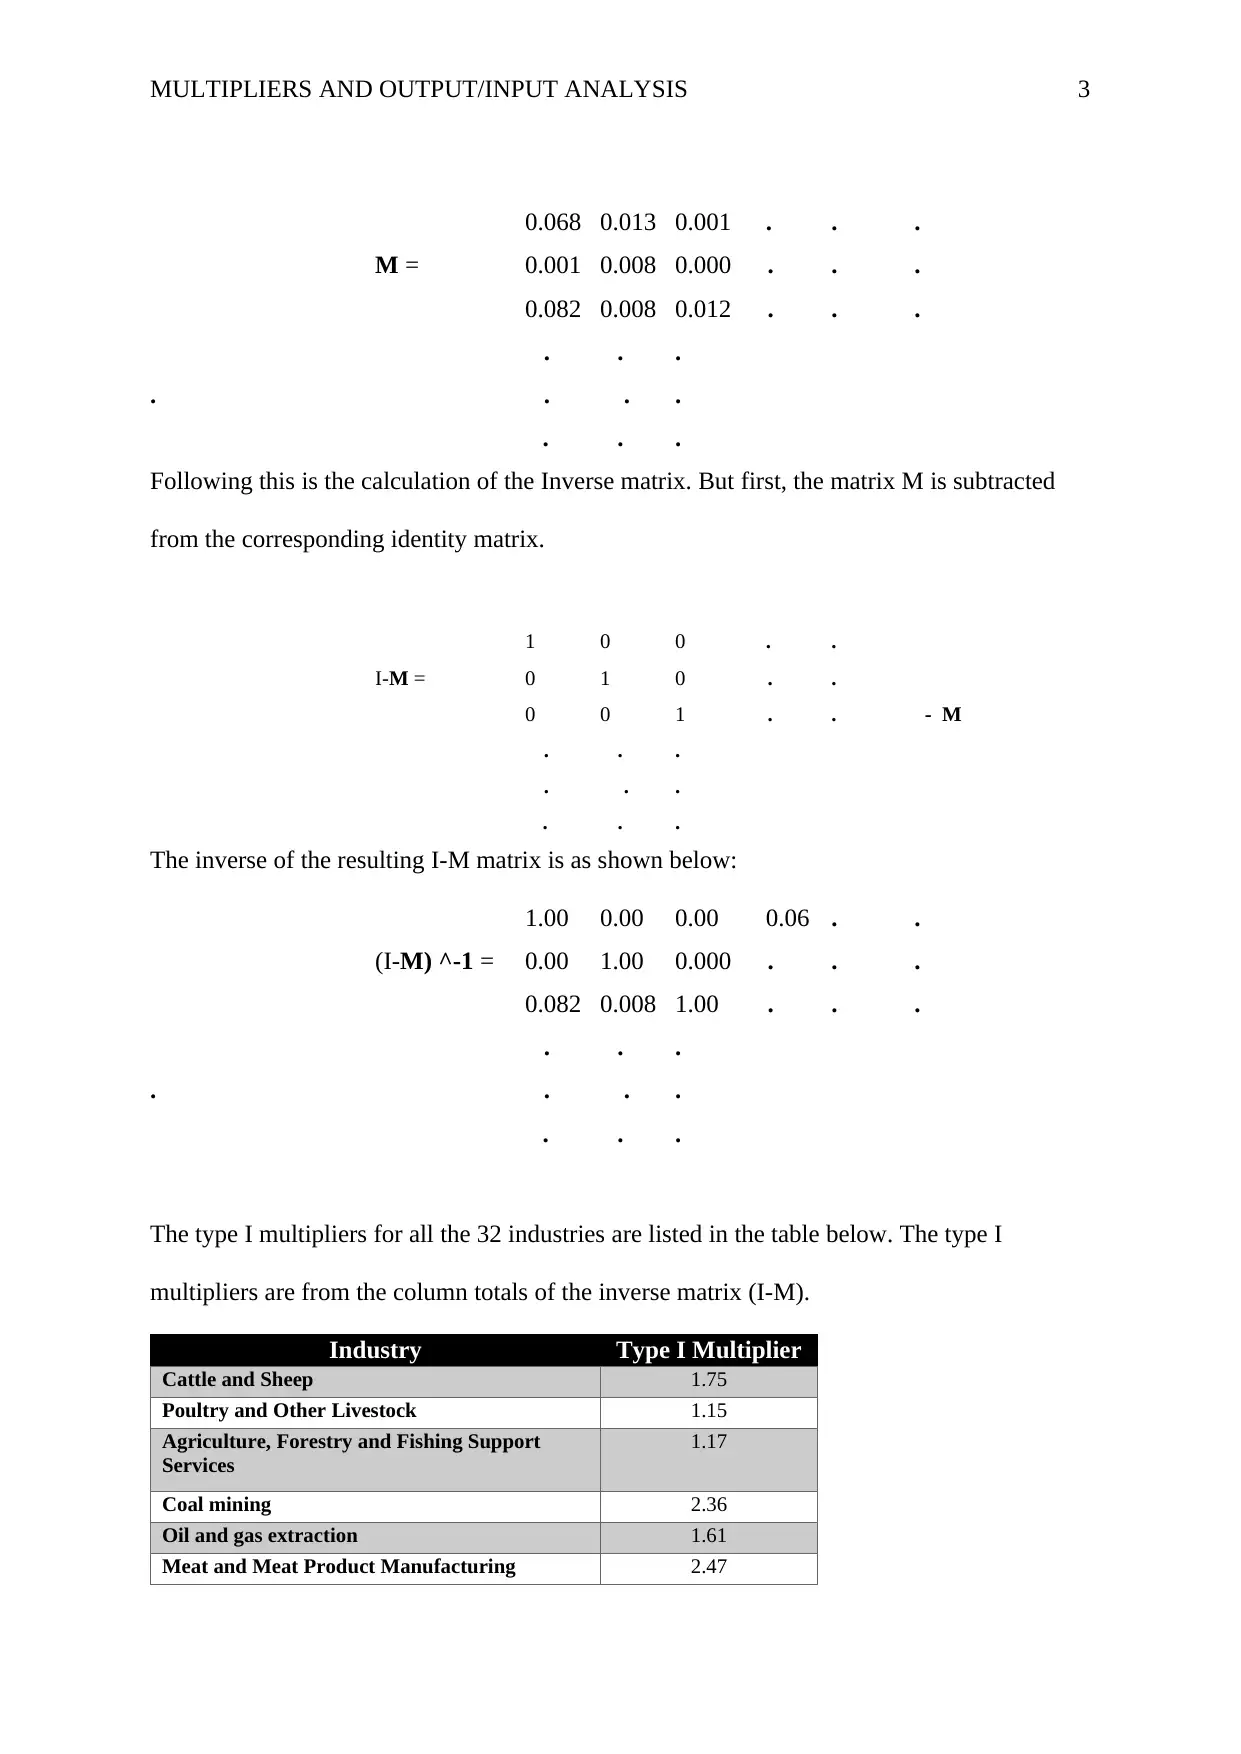
The resulting technology matrix M is as partly shown below.
MULTIPLIERS AND OUTPUT/INPUT ANALYSIS 3
0.068 0.013 0.001 . . .
M = 0.001 0.008 0.000 . . .
0.082 0.008 0.012 . . .
. . .
. . . .
. . .
Following this is the calculation of the Inverse matrix. But first, the matrix M is subtracted
from the corresponding identity matrix.
1 0 0 . .
I-M = 0 1 0 . .
0 0 1 . . - M
. . .
. . .
. . .
The inverse of the resulting I-M matrix is as shown below:
1.00 0.00 0.00 0.06 . .
(I-M) ^-1 = 0.00 1.00 0.000 . . .
0.082 0.008 1.00 . . .
. . .
. . . .
. . .
The type I multipliers for all the 32 industries are listed in the table below. The type I
multipliers are from the column totals of the inverse matrix (I-M).
Industry Type I Multiplier
Cattle and Sheep 1.75
Poultry and Other Livestock 1.15
Agriculture, Forestry and Fishing Support
Services
1.17
Coal mining 2.36
Oil and gas extraction 1.61
Meat and Meat Product Manufacturing 2.47
⊘ This is a preview!⊘
Do you want full access?
Subscribe today to unlock all pages.
Trusted by 1+ million students worldwide
MULTIPLIERS AND OUTPUT/INPUT ANALYSIS 4
Grain Mill and Cereal Product Manufacturing 1.38
Beer Manufacturing 1.23
Clothing Manufacturing 1.03
Petroleum and Coal Product Manufacturing 1.45
Veterinary Pharmaceutical and Medicinal
Product Manufacturing
1.02
Basic Chemical Manufacturing 1.25
Specialized and other Machinery and
Equipment Manufacturing
1.22
Electricity Generation 1.59
Water Supply, Sewerage and Drainage Services 1.49
Heavy and Civil Engineering Construction 2.56
Construction Services 1.86
Retail Trade 2.23
Accommodation 1.44
Food and Beverage Services 2.25
Rail Transport 1.54
Transport Support services and storage 1.58
Publishing (except Internet and Music
Publishing)
1.12
Telecommunication Services 1.88
Finance 1.21
Auxiliary Finance and Insurance Services 1.36
Rental and Hiring Services (except Real Estate) 1.18
Professional, Scientific and Technical Services 1.51
Employment, Travel Agency and Other
Administrative Services
1.30
Public Administration and Regulatory Services 1.37
Automotive Repair and Maintenance 1.21
Other Repair and Maintenance 1.16
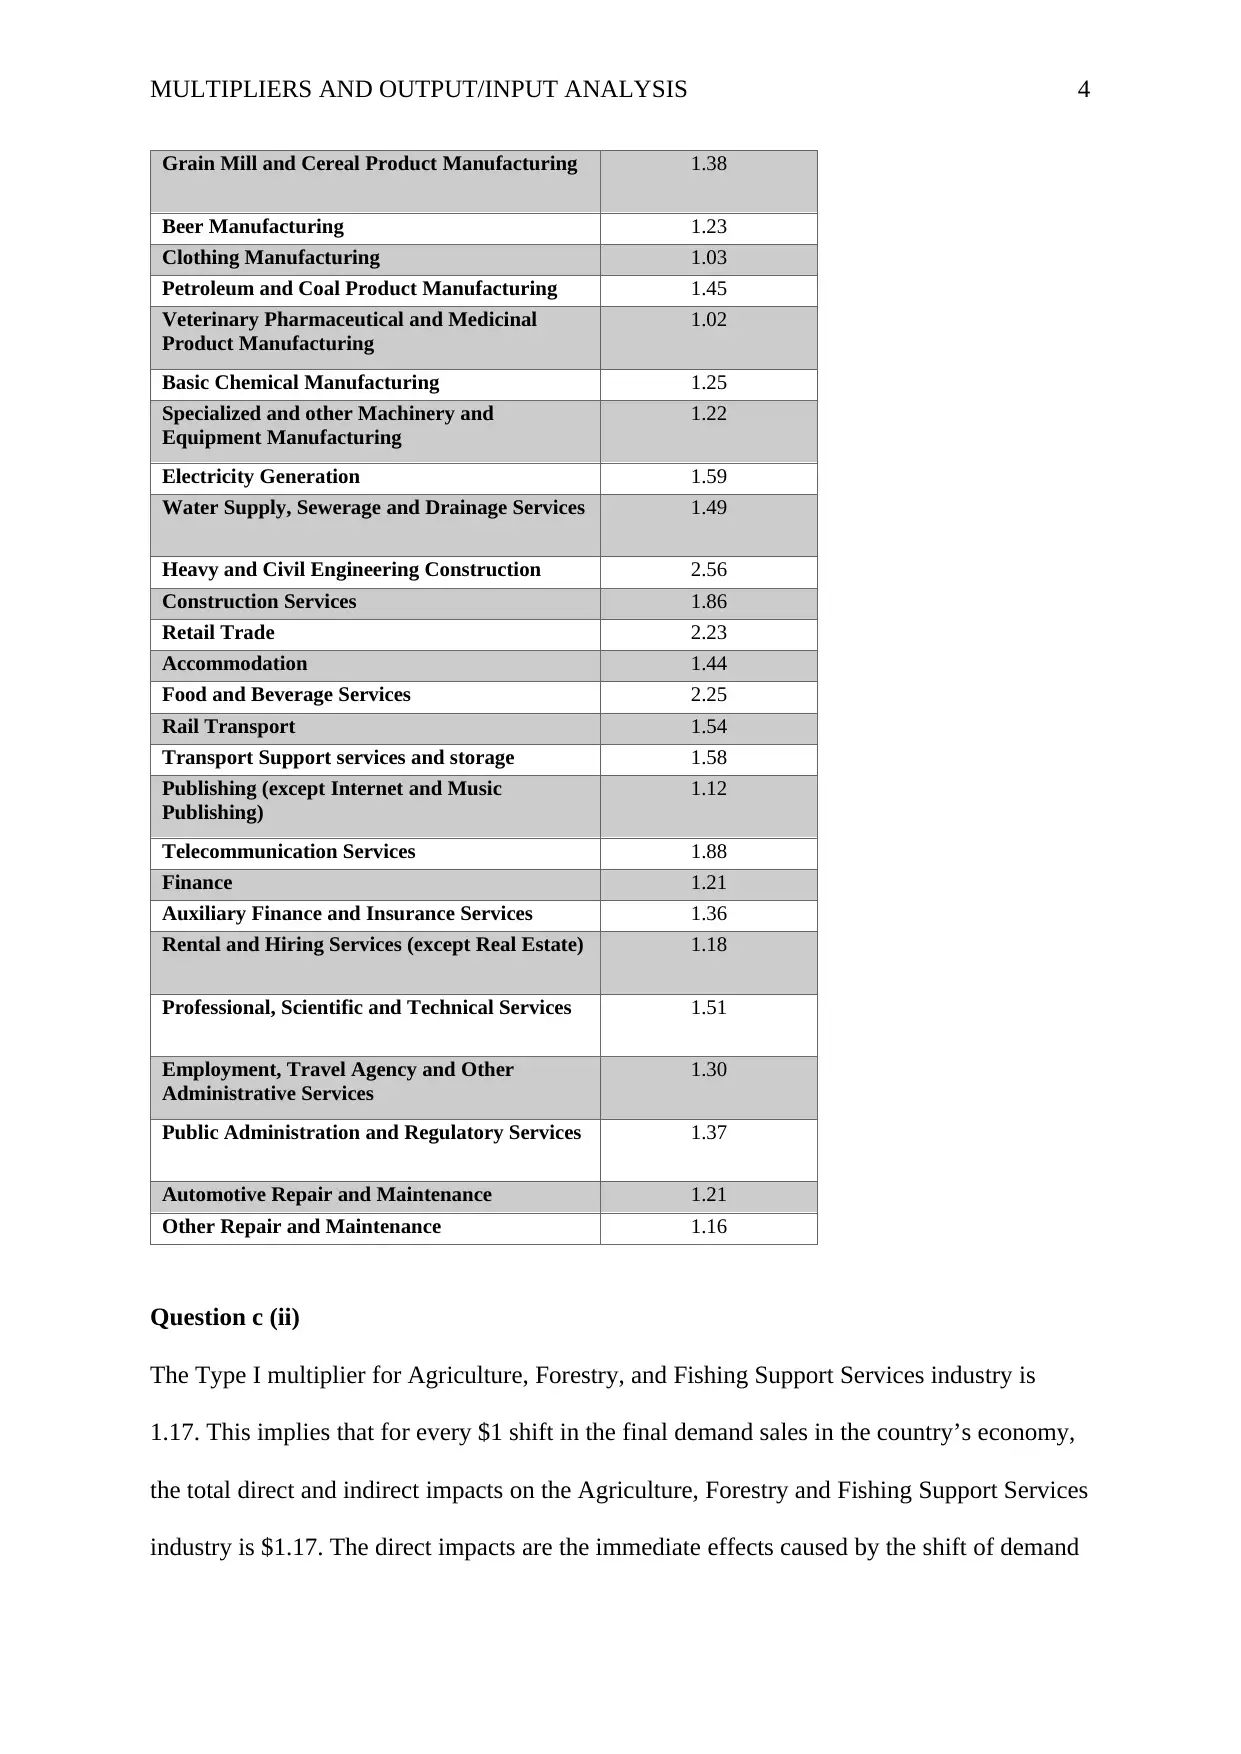
Question c (ii)
The Type I multiplier for Agriculture, Forestry, and Fishing Support Services industry is
1.17. This implies that for every $1 shift in the final demand sales in the country’s economy,
the total direct and indirect impacts on the Agriculture, Forestry and Fishing Support Services
industry is $1.17. The direct impacts are the immediate effects caused by the shift of demand
Grain Mill and Cereal Product Manufacturing 1.38
Beer Manufacturing 1.23
Clothing Manufacturing 1.03
Petroleum and Coal Product Manufacturing 1.45
Veterinary Pharmaceutical and Medicinal
Product Manufacturing
1.02
Basic Chemical Manufacturing 1.25
Specialized and other Machinery and
Equipment Manufacturing
1.22
Electricity Generation 1.59
Water Supply, Sewerage and Drainage Services 1.49
Heavy and Civil Engineering Construction 2.56
Construction Services 1.86
Retail Trade 2.23
Accommodation 1.44
Food and Beverage Services 2.25
Rail Transport 1.54
Transport Support services and storage 1.58
Publishing (except Internet and Music
Publishing)
1.12
Telecommunication Services 1.88
Finance 1.21
Auxiliary Finance and Insurance Services 1.36
Rental and Hiring Services (except Real Estate) 1.18
Professional, Scientific and Technical Services 1.51
Employment, Travel Agency and Other
Administrative Services
1.30
Public Administration and Regulatory Services 1.37
Automotive Repair and Maintenance 1.21
Other Repair and Maintenance 1.16
Question c (ii)
The Type I multiplier for Agriculture, Forestry, and Fishing Support Services industry is
1.17. This implies that for every $1 shift in the final demand sales in the country’s economy,
the total direct and indirect impacts on the Agriculture, Forestry and Fishing Support Services
industry is $1.17. The direct impacts are the immediate effects caused by the shift of demand
Paraphrase This Document
Need a fresh take? Get an instant paraphrase of this document with our AI Paraphraser
MULTIPLIERS AND OUTPUT/INPUT ANALYSIS 5
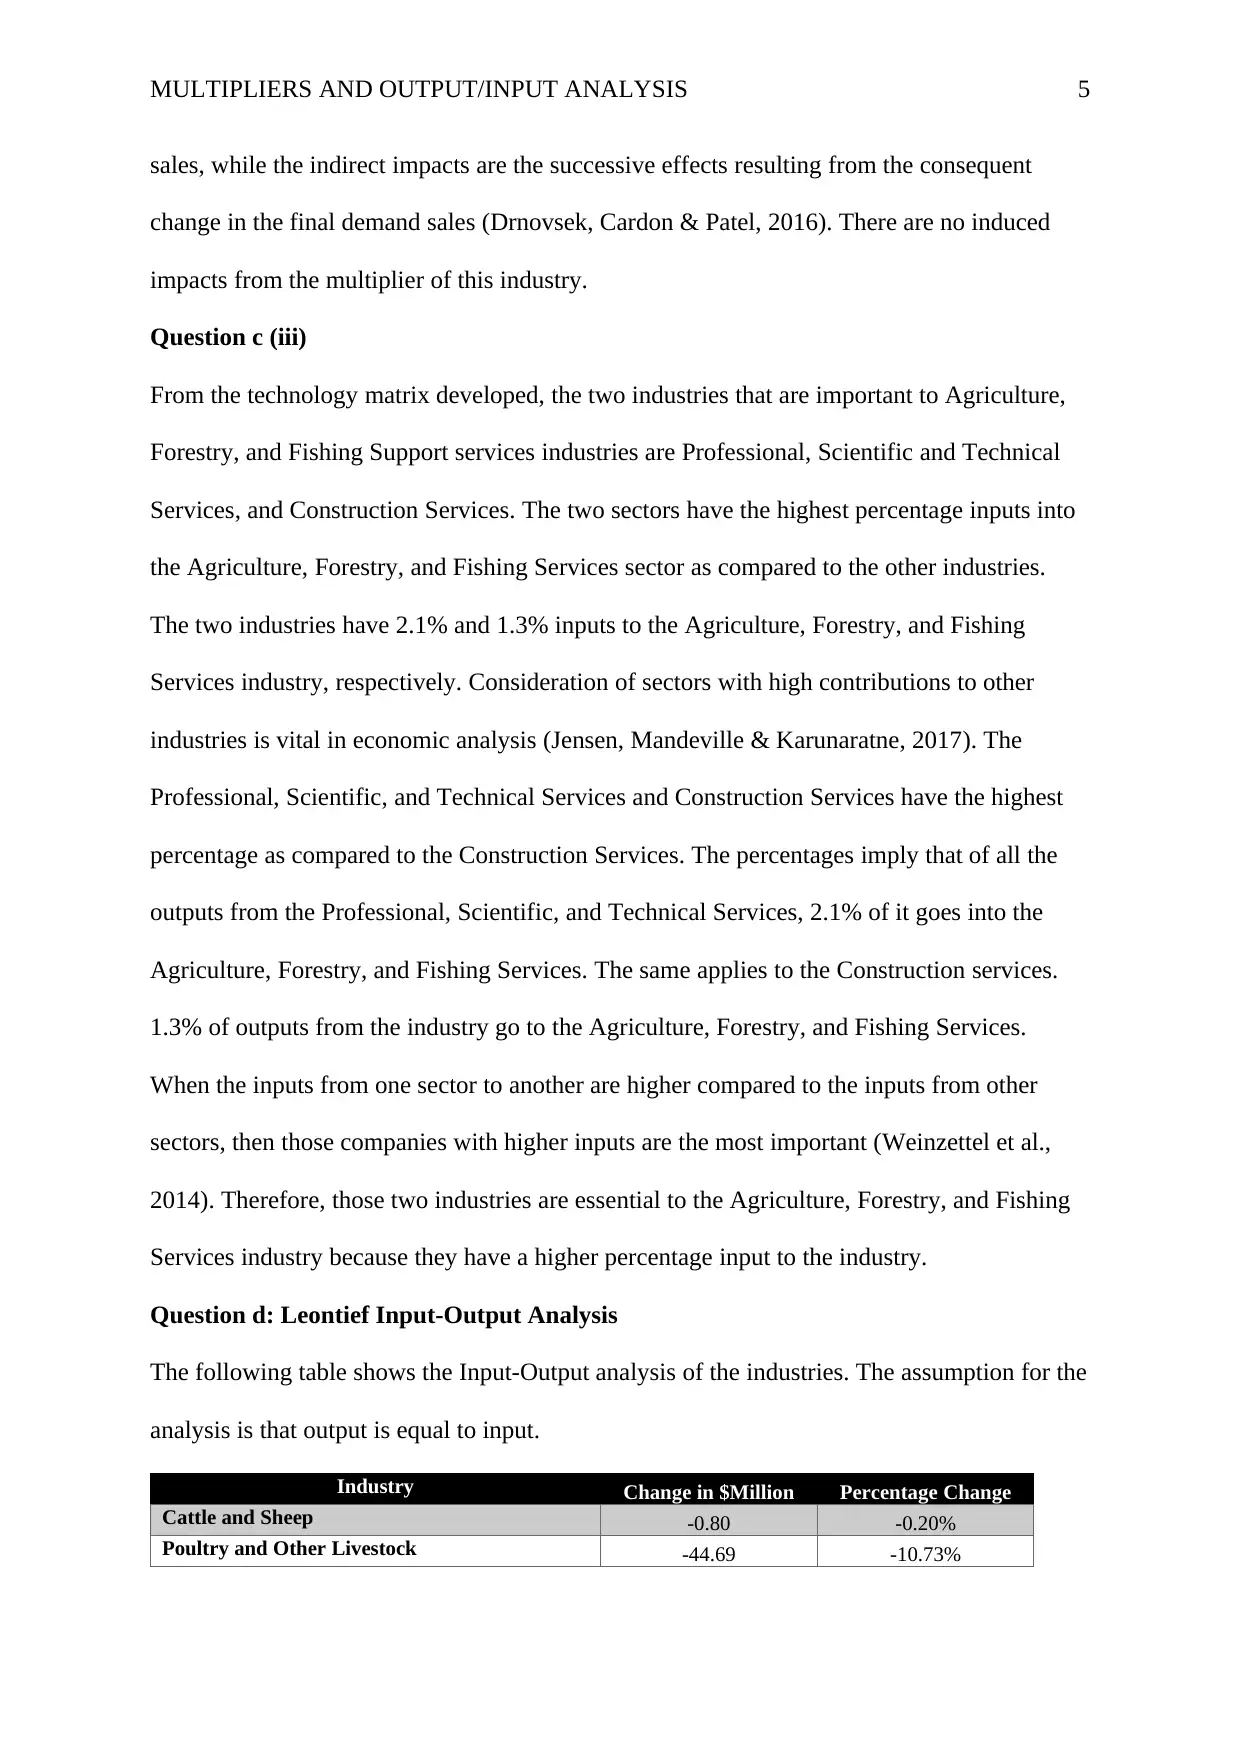
sales, while the indirect impacts are the successive effects resulting from the consequent
change in the final demand sales (Drnovsek, Cardon & Patel, 2016). There are no induced
impacts from the multiplier of this industry.
Question c (iii)
From the technology matrix developed, the two industries that are important to Agriculture,
Forestry, and Fishing Support services industries are Professional, Scientific and Technical
Services, and Construction Services. The two sectors have the highest percentage inputs into
the Agriculture, Forestry, and Fishing Services sector as compared to the other industries.
The two industries have 2.1% and 1.3% inputs to the Agriculture, Forestry, and Fishing
Services industry, respectively. Consideration of sectors with high contributions to other
industries is vital in economic analysis (Jensen, Mandeville & Karunaratne, 2017). The
Professional, Scientific, and Technical Services and Construction Services have the highest
percentage as compared to the Construction Services. The percentages imply that of all the
outputs from the Professional, Scientific, and Technical Services, 2.1% of it goes into the
Agriculture, Forestry, and Fishing Services. The same applies to the Construction services.
1.3% of outputs from the industry go to the Agriculture, Forestry, and Fishing Services.
When the inputs from one sector to another are higher compared to the inputs from other
sectors, then those companies with higher inputs are the most important (Weinzettel et al.,
2014). Therefore, those two industries are essential to the Agriculture, Forestry, and Fishing
Services industry because they have a higher percentage input to the industry.
Question d: Leontief Input-Output Analysis
The following table shows the Input-Output analysis of the industries. The assumption for the
analysis is that output is equal to input.
Industry Change in $Million Percentage Change
Cattle and Sheep -0.80 -0.20%
Poultry and Other Livestock -44.69 -10.73%
MULTIPLIERS AND OUTPUT/INPUT ANALYSIS 6
Agriculture, Forestry and Fishing Support
Services -0.47 -0.09%
Coal mining 0.00 0.00%
Oil and gas extraction -0.10 -0.02%
Meat and Meat Product Manufacturing -0.12 -0.04%
Grain Mill and Cereal Product Manufacturing
-0.03 -0.08%
Beer Manufacturing 0.00 -0.01%
Clothing Manufacturing -0.01 -0.02%
Petroleum and Coal Product Manufacturing -0.43 -0.13%
Veterinary Pharmaceutical and Medicinal
Product Manufacturing -0.21 -1.36%
Basic Chemical Manufacturing -0.28 -0.13%
Specialized and other Machinery and
Equipment Manufacturing -0.05 -0.04%
Electricity Generation -0.08 -0.01%
Water Supply, Sewerage and Drainage Services
-0.47 -0.05%
Heavy and Civil Engineering Construction -0.03 0.00%
Construction Services -1.21 -0.02%
Retail Trade -0.02 0.00%
Accommodation -0.02 -0.01%
Food and Beverage Services -0.05 -0.01%
Rail Transport -0.02 -0.02%
Transport Support services and storage -0.10 0.00%
Publishing (except Internet and Music
Publishing) -0.01 0.00%
Telecommunication Services -0.07 0.00%
Finance -0.56 -0.03%
Auxiliary Finance and Insurance Services -0.32 -0.01%
Rental and Hiring Services (except Real Estate)
-0.26 -0.02%
Professional, Scientific and Technical Services
-0.83 -0.01%
Employment, Travel Agency and Other
Administrative Services -0.23 0.00%
Public Administration and Regulatory Services
-0.03 0.00%
Automotive Repair and Maintenance -0.03 -0.01%
Other Repair and Maintenance -83.18 -0.01%
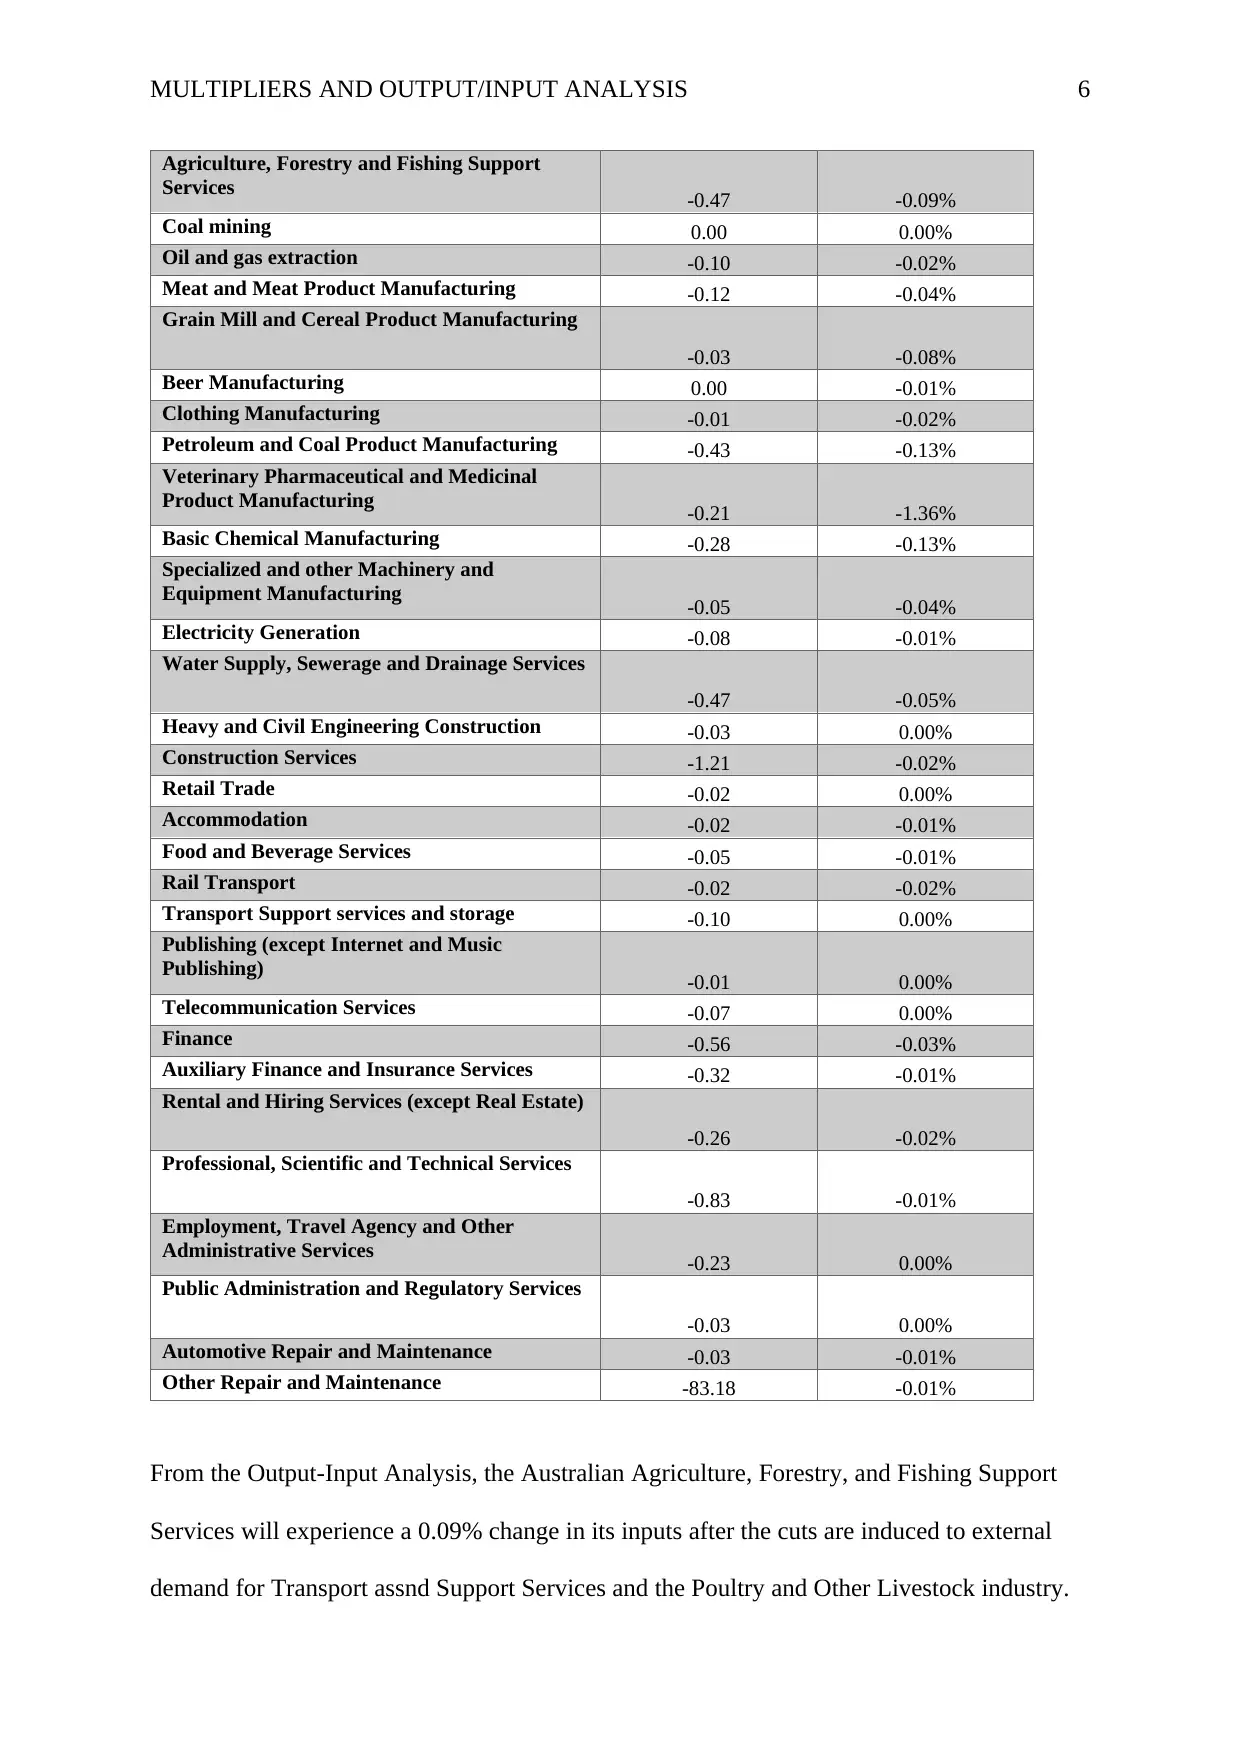
From the Output-Input Analysis, the Australian Agriculture, Forestry, and Fishing Support
Services will experience a 0.09% change in its inputs after the cuts are induced to external
demand for Transport assnd Support Services and the Poultry and Other Livestock industry.
Agriculture, Forestry and Fishing Support
Services -0.47 -0.09%
Coal mining 0.00 0.00%
Oil and gas extraction -0.10 -0.02%
Meat and Meat Product Manufacturing -0.12 -0.04%
Grain Mill and Cereal Product Manufacturing
-0.03 -0.08%
Beer Manufacturing 0.00 -0.01%
Clothing Manufacturing -0.01 -0.02%
Petroleum and Coal Product Manufacturing -0.43 -0.13%
Veterinary Pharmaceutical and Medicinal
Product Manufacturing -0.21 -1.36%
Basic Chemical Manufacturing -0.28 -0.13%
Specialized and other Machinery and
Equipment Manufacturing -0.05 -0.04%
Electricity Generation -0.08 -0.01%
Water Supply, Sewerage and Drainage Services
-0.47 -0.05%
Heavy and Civil Engineering Construction -0.03 0.00%
Construction Services -1.21 -0.02%
Retail Trade -0.02 0.00%
Accommodation -0.02 -0.01%
Food and Beverage Services -0.05 -0.01%
Rail Transport -0.02 -0.02%
Transport Support services and storage -0.10 0.00%
Publishing (except Internet and Music
Publishing) -0.01 0.00%
Telecommunication Services -0.07 0.00%
Finance -0.56 -0.03%
Auxiliary Finance and Insurance Services -0.32 -0.01%
Rental and Hiring Services (except Real Estate)
-0.26 -0.02%
Professional, Scientific and Technical Services
-0.83 -0.01%
Employment, Travel Agency and Other
Administrative Services -0.23 0.00%
Public Administration and Regulatory Services
-0.03 0.00%
Automotive Repair and Maintenance -0.03 -0.01%
Other Repair and Maintenance -83.18 -0.01%
From the Output-Input Analysis, the Australian Agriculture, Forestry, and Fishing Support
Services will experience a 0.09% change in its inputs after the cuts are induced to external
demand for Transport assnd Support Services and the Poultry and Other Livestock industry.
⊘ This is a preview!⊘
Do you want full access?
Subscribe today to unlock all pages.
Trusted by 1+ million students worldwide
MULTIPLIERS AND OUTPUT/INPUT ANALYSIS 7
The industry that will be affected most with the external demand budget cuts on the two
sectors is the Veterinary Pharmaceutical and Medicinal Product Manufacturing. The industry
will experience a 1.36% drop in its output. The Veterinary Pharmaceutical and Medicinal
Product Manufacturing would be affected mainly because most of the oil and gas extraction
services require transport and support services to affect their amenities. Two co-dependent
sectors would experience damage should one of them be altered (Heffernan, 2018). The
budget cut would, therefore, result in the percentage drop after the external demand cuts are
implemented.
Paraphrase This Document
Need a fresh take? Get an instant paraphrase of this document with our AI Paraphraser
MULTIPLIERS AND OUTPUT/INPUT ANALYSIS 8
References
Drnovsek, M., Cardon, M. S., & Patel, P. C. (2016). Direct and indirect effects of passion on
growing technology ventures. Strategic Entrepreneurship Journal, 10(2), 194-213.
Jensen, R. C., Mandeville, T. D., & Karunaratne, N. D. (2017). Regional economic planning:
Generation of regional input-output analysis. Routledge.
Weinzettel, J., Steen-Olsen, K., Hertwich, E. G., Borucke, M., & Galli, A. (2014). Ecological
footprint of nations: comparison of process analysis, and standard and hybrid multiregional
input-output analysis. Ecological Economics, 101, 115-126.
Heffernan, A. (2018). The influence of school context on school improvement policy
enactment: An Australian case study.
1 out of 8

Your All-in-One AI-Powered Toolkit for Academic Success.
+13062052269
info@desklib.com
Available 24*7 on WhatsApp / Email
![[object Object]](/_next/static/media/star-bottom.7253800d.svg)
Unlock your academic potential
Copyright © 2020–2026 A2Z Services. All Rights Reserved. Developed and managed by ZUCOL.