Statistical Analysis of Myopia and Sedentary Time in Relation to Age
VerifiedAdded on  2020/05/04
|16
|2630
|59
Report
AI Summary
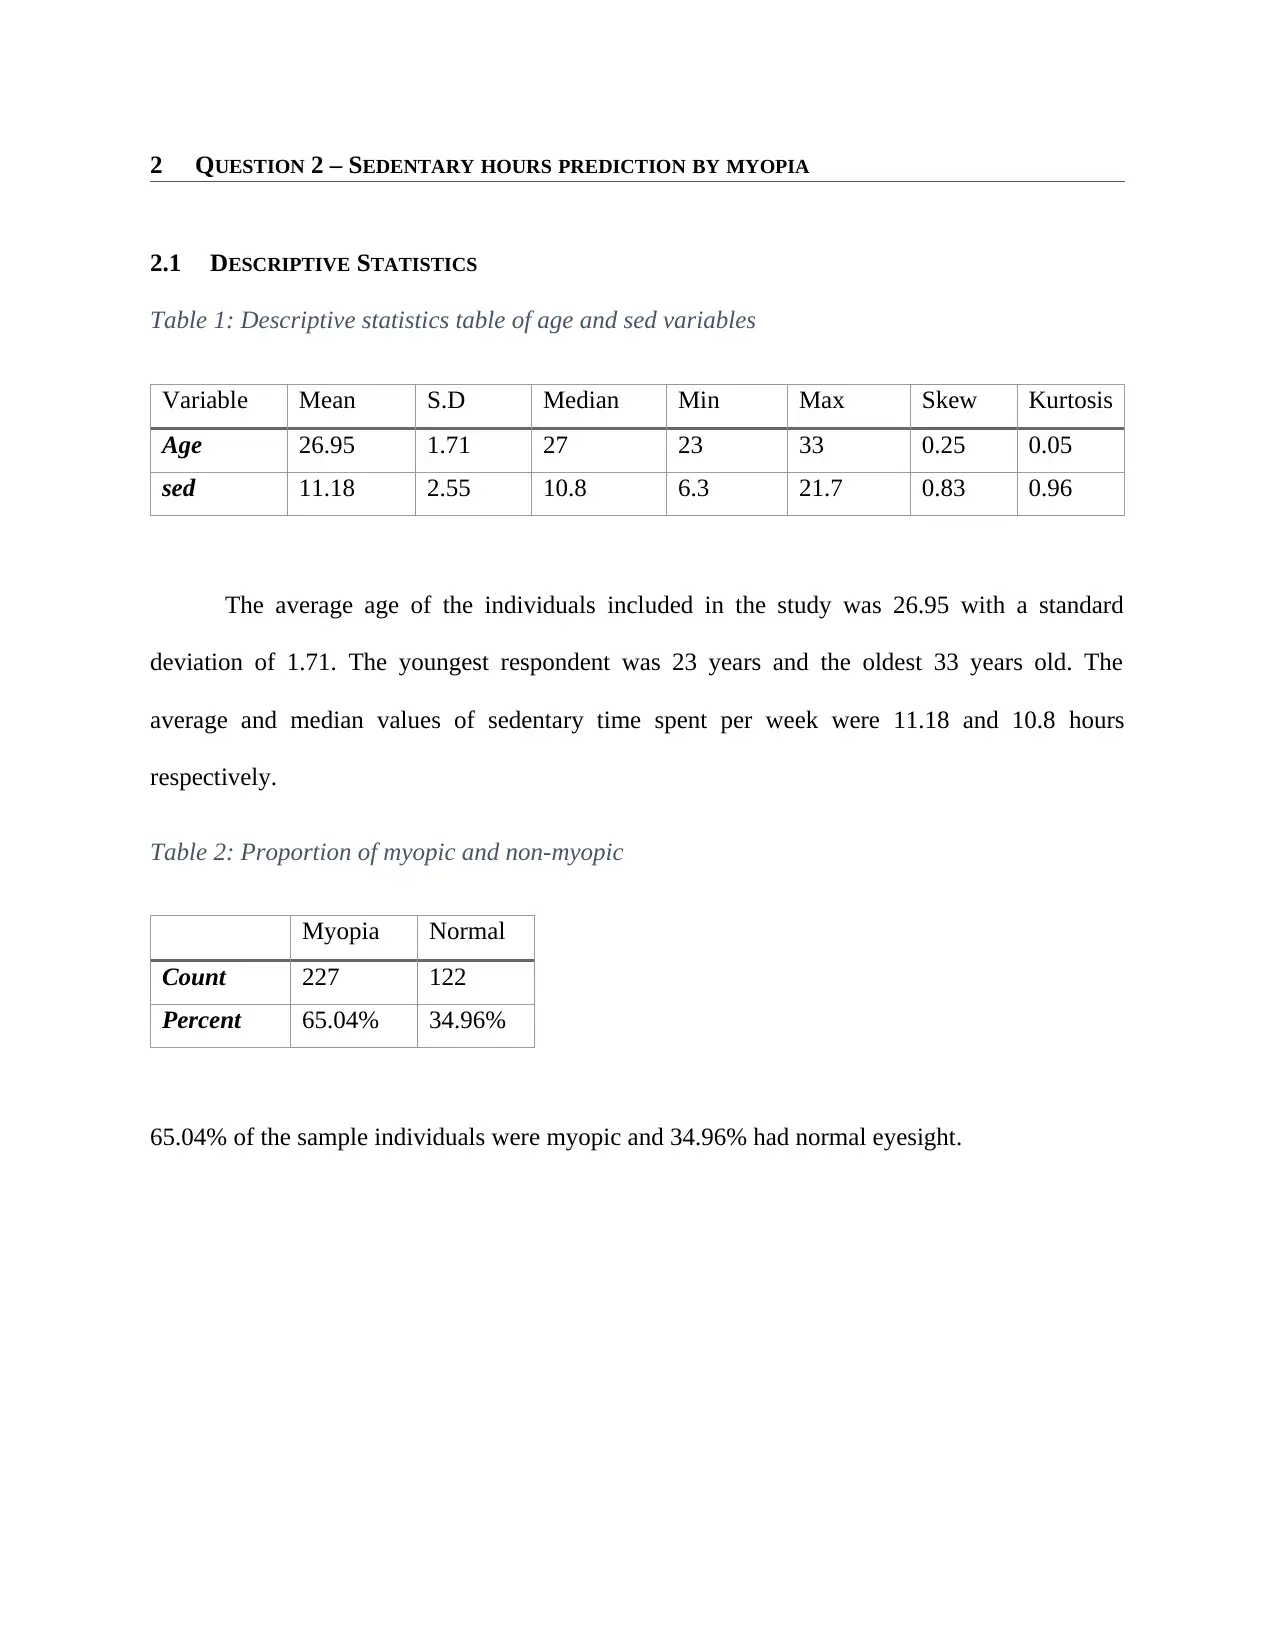
This report presents a statistical analysis investigating the relationship between myopia and sedentary hours per week, incorporating age as a potential confounder. The analysis includes descriptive statistics, such as mean, median, standard deviation, and proportions of myopic and non-myopic individuals. Histograms are used to visualize the distribution of age and sedentary hours for both groups. Two regression models were developed and evaluated, one with myopia as the sole predictor and the other adjusting for age. The results indicate a statistically significant relationship between myopia and sedentary time, although the model's explanatory power is limited. Adjusting for age improved the model slightly, but age was not a significant confounder. The report concludes that while myopia can predict sedentary time, additional predictors are needed to enhance the model's accuracy. The R code used for the analysis is included in the appendix, detailing the data description, graphical presentations, and model implementations.

Myopia and Physical Activity
Name
Course Number
Date
Faculty Name
Name
Course Number
Date
Faculty Name
Paraphrase This Document
Need a fresh take? Get an instant paraphrase of this document with our AI Paraphraser

Myopia
1 QUESTION 1 – APPRAISING MYOPIA AND LATER PHYSICAL ACTIVITY IN ADOLESCENCE
1.1 SAMPLE SIZE
The sample size determination has been comprehensively explained in the publication;
stating the criteria used in including the pregnant women. It has been clearly mentioned that
women who were expected to deliver between 1st April 1991 and 31 December 1992 in the
county of Avon. This time length explains how 7159 children were selected into the study. Based
on children consenting for participating and cases of incomplete data, it has been indicated that
the sample size reduced to 4880.
1.2 STATISTICAL ANALYSIS
Multivariable regression analysis was conducted to predict physical activity based on
whether a child was myopic or not. Two model were developed; one having minimal control of
confounding effect and the second with maximum control. Therefore, regression was used to
control for confounding factors in the analysis. After the data was downloaded from the
Actigraphs, only valid data was used for the analysis. Therefore, the researchers decided to drop
cases of incomplete and invalid data from the study. Cases of loss of following were not
addressed. However, the sample size was large enough to accommodate issues of loss of follow-
up, non-response, incomplete and missing data. The modelling process was conducted on basis
of the ‘best eye’ and ‘worst eye’ recorded for the purpose of result and significance comparison.
1.3 PARTICIPANT
It has documented with adequate reasons as to how the sample numbers transformed
from one stage to another, hence defining how the final size was achieved.

1.4 DESCRIPTIVE & OUTCOME DATA
Relevant descriptive statistics were provided to the participant. Median statistics for the
skewed continuous variables were reported and average variables for a variable with
approximate normal distributions. Other potential confounders and exposures such as age and
ethnicity were recorded, described and controlled for in the analysis. The number and percentage
of myopes were reported in each on the two groups: best and worst eye.
1.5 RESULTS
Minimal and maximal results of the model were reported in each myopic categories at
95% confidence level. Their results were used to determine the level of effects contributed by the
potential confounders. In the report, it was clearly defined which variables were controlled for in
the minimal and maximal models. Associations were developed between myopia and physical
activities for the 12-year-olds. It was also reported categorically on which groups performed
better based on the measured indicators of physical activity. 95% confidence level p-values of
the models’ coefficients were reported on the results indicating the levels of significance for each
predictor.
1.6 OTHER ANALYSIS
No reports of other analysis conducted on the dataset for the study were documented.
More data exploratory analysis methods could have been used to identify further distributions.
⊘ This is a preview!⊘
Do you want full access?
Subscribe today to unlock all pages.

Trusted by 1+ million students worldwide

2 QUESTION 2 – SEDENTARY HOURS PREDICTION BY MYOPIA
2.1 DESCRIPTIVE STATISTICS
Table 1: Descriptive statistics table of age and sed variables
Variable Mean S.D Median Min Max Skew Kurtosis
Age 26.95 1.71 27 23 33 0.25 0.05
sed 11.18 2.55 10.8 6.3 21.7 0.83 0.96
The average age of the individuals included in the study was 26.95 with a standard
deviation of 1.71. The youngest respondent was 23 years and the oldest 33 years old. The
average and median values of sedentary time spent per week were 11.18 and 10.8 hours
respectively.
Table 2: Proportion of myopic and non-myopic
Myopia Normal
Count 227 122
Percent 65.04% 34.96%
65.04% of the sample individuals were myopic and 34.96% had normal eyesight.
Paraphrase This Document
Need a fresh take? Get an instant paraphrase of this document with our AI Paraphraser

Figure 1: Myopia Pie Chart
Figure 2: Histogram of Age
Age variable is approximately normally distributed because the normal curve in figure 2 is not
skewed.
Figure 2: Histogram of Age
Age variable is approximately normally distributed because the normal curve in figure 2 is not
skewed.

Figure 3: Histogram of Sedentary Hours per Week
The Sedentary hours per week (sed) variable is skewed to the right, hence reporting the
median as the valid measure of central tendency.
Figure 4: Histogram of Age, by Myopia Status
According to figure 4 above, there is no significant difference between age distribution in
myopic and normal groups. Age variables for the two myopic groups are approximately normally
⊘ This is a preview!⊘
Do you want full access?
Subscribe today to unlock all pages.

Trusted by 1+ million students worldwide

distributed. The myopic and normal groups had average ages of 26.94 and 26.98 years
respectively.
Figure 5: Histogram of Sedentary Hours per Week, by Myopia
Both myopic status groups have skewed sed data. The normal group have a higher
median (11.1) of sedentary hours per week than the myopic group (10.7).
2.2 MODEL
2.2.1 Model 1
The first model used myopia as the only predictor variable for the sedentary hours spent per
week. The model’s coefficients are shown in the table below.
Estimate Standard Error t-value Pr(>|t|)
Intercept 10.9322 0.1677 65.179 <2e-16***
Myopianormal 0.7096 0.2837 2.502 0.0128*
‘***’ 0.0001 ‘*’ 0.05
sed=10.9322+0.7096 myopialnormal
Paraphrase This Document
Need a fresh take? Get an instant paraphrase of this document with our AI Paraphraser

The obtained Adjusted R Square value was 1.488%. generally, the model was
statistically significant at 95% confidence level with a p-value of 0.01282.
2.2.2 Model 2 – adjusting for age
sed=13.758+0.71439 myopialnormal −0.10489 age
Estimate Standard Error t-value Pr(>|t|)
Intercept 13.758 2.14297 6.42 4.5e-10 ***
Myopianormal 0.71439 0.28340 2.521 0.0122 *
Age -0.10489 0.07931 -1.323 0.1868
‘***’ 0.0001 ‘*’ 0.05
The second model that has been adjusted for age reported an Adjusted R-Square of 1.7%.
Comparing the first and the second regression analysis, adjusting for age confounder improved
the model by 0.3%. However, age is not a significant confounder in the model because the p-
value is greater than 0.05.
2.3 CONCLUSION
In conclusion, we can state that age is not a potential confounder in the prediction of
sedentary time per week by myopia. Myopia can be used to predict sedentary time although there
is minimal variability in the response explain by myopic status. There is a need for more
predictors to improve the model significantly.

REFERENCES
Deere, K., Williams, C., Leary, S., Mattocks, C., Ness, A., Blair, S., & Riddoch, C. (2009).
Myopia and later physical activity in adolescence: a prospective study. British Journal Of
Sports Medicine, 43(7), 542-544. http://dx.doi.org/10.1136/bjsm.2008.049288
APPENDIX
Output
Thu Oct 19 15:32:37 2017
setwd("E:/Data_6/Myopia in children")
load("Myopia.RData")
ls()
## [1] "shortsight"
View(shortsight)
library(psych)
library(ggplot2)
##
## Attaching package: 'ggplot2'
## The following objects are masked from 'package:psych':
##
## %+%, alpha
##### Data description #####
str(shortsight)
## 'data.frame': 349 obs. of 8 variables:
## $ myopia : Factor w/ 2 levels "myopia","normal": 2 1 1 1 1 2 1 1 1
1 ...
## $ sex : Factor w/ 2 levels "male","female": 1 2 1 2 1 2 2 1 2 1
...
## $ age : num 28 27 27 27 26 26 28 33 24 29 ...
## $ educ : Factor w/ 3 levels "less","completed secondary",..: 2 1
3 3 1 1 3 2 2 3 ...
## $ MVPA : num 4.6 0.4 3.2 3.5 11.4 5.7 1.8 6.7 1.5 2.4 ...
## $ logMVPA: num 0.66 -0.4 0.5 0.54 1.06 0.76 0.26 0.83 0.18
0.39 ...
⊘ This is a preview!⊘
Do you want full access?
Subscribe today to unlock all pages.

Trusted by 1+ million students worldwide

## $ sed : num 8.8 14.3 10.5 10.1 12.6 9.6 7 12.1 10.8 9.8 ...
## $ yourID : num 18761418 18761418 18761418 18761418 18761418 ...
attach(shortsight)
describe(sed)
## vars n mean sd median trimmed mad min max range skew
kurtosis
## X1 1 349 11.18 2.55 10.8 11 2.37 6.3 21.7 15.4 0.83
0.96
## se
## X1 0.14
describe(age)
## vars n mean sd median trimmed mad min max range skew
kurtosis
## X1 1 349 26.95 1.71 27 26.93 1.48 23 33 10 0.25
0.05
## se
## X1 0.09
table(myopia)
## myopia
## myopia normal
## 227 122
prop.table(table(myopia))
## myopia
## myopia normal
## 0.6504298 0.3495702
### Graphical presentation
pie(table(myopia), col = c("blue", "lightblue"), main = "Myopia Pie
Chart",
radius = 1)
Paraphrase This Document
Need a fresh take? Get an instant paraphrase of this document with our AI Paraphraser

hAge <- hist(age, col = "brown", main = "Histogram of Age", plot =
TRUE, breaks = "Sturges")
xf <- seq(min(age), max(age), length=length(age))
yf <- dnorm(xf, mean=mean(age), sd=sd(age))
yf <- yf*diff(hAge$mids[1:2]*length(age))
lines(xf, yf, col = "blue4", lwd = 2)
TRUE, breaks = "Sturges")
xf <- seq(min(age), max(age), length=length(age))
yf <- dnorm(xf, mean=mean(age), sd=sd(age))
yf <- yf*diff(hAge$mids[1:2]*length(age))
lines(xf, yf, col = "blue4", lwd = 2)

hsed <- hist(sed, col = "brown", main = "Histogram of Sedentary Hours
per Week", breaks =20)
xfi <- seq(min(sed), max(sed), length=length(sed))
yfi <- dnorm(xfi, mean=mean(sed), sd=sd(sed))
yfi <- yfi*diff(hsed$mids[1:2]*length(sed))
lines(xfi, yfi, col = "darkblue", lwd = 2)
per Week", breaks =20)
xfi <- seq(min(sed), max(sed), length=length(sed))
yfi <- dnorm(xfi, mean=mean(sed), sd=sd(sed))
yfi <- yfi*diff(hsed$mids[1:2]*length(sed))
lines(xfi, yfi, col = "darkblue", lwd = 2)
⊘ This is a preview!⊘
Do you want full access?
Subscribe today to unlock all pages.

Trusted by 1+ million students worldwide
1 out of 16
Related Documents
Your All-in-One AI-Powered Toolkit for Academic Success.
 +13062052269
info@desklib.com
Available 24*7 on WhatsApp / Email
Unlock your academic potential
Copyright © 2020–2026 A2Z Services. All Rights Reserved. Developed and managed by ZUCOL.


