N6208 Assignment: Chi-Square Analysis and Statistical Significance
VerifiedAdded on 2022/09/01
|6
|1069
|24
Homework Assignment
AI Summary
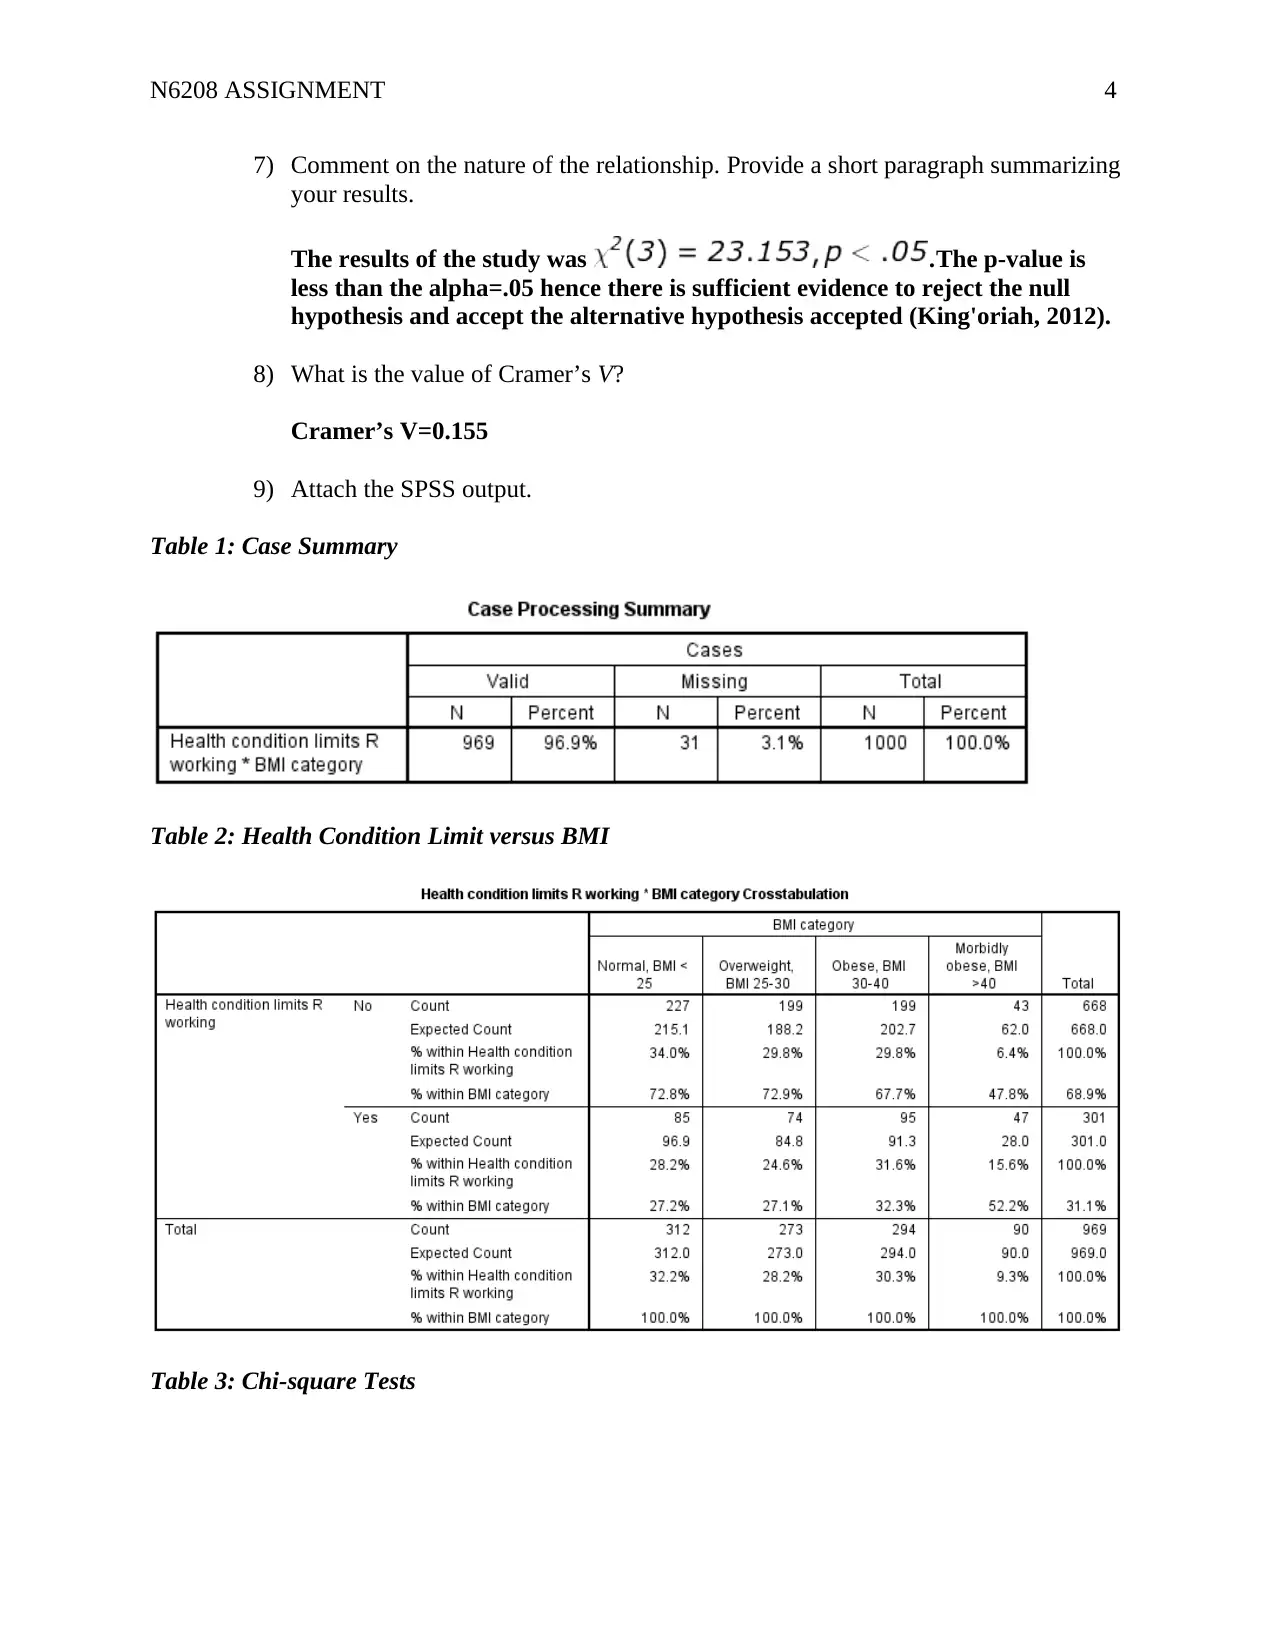
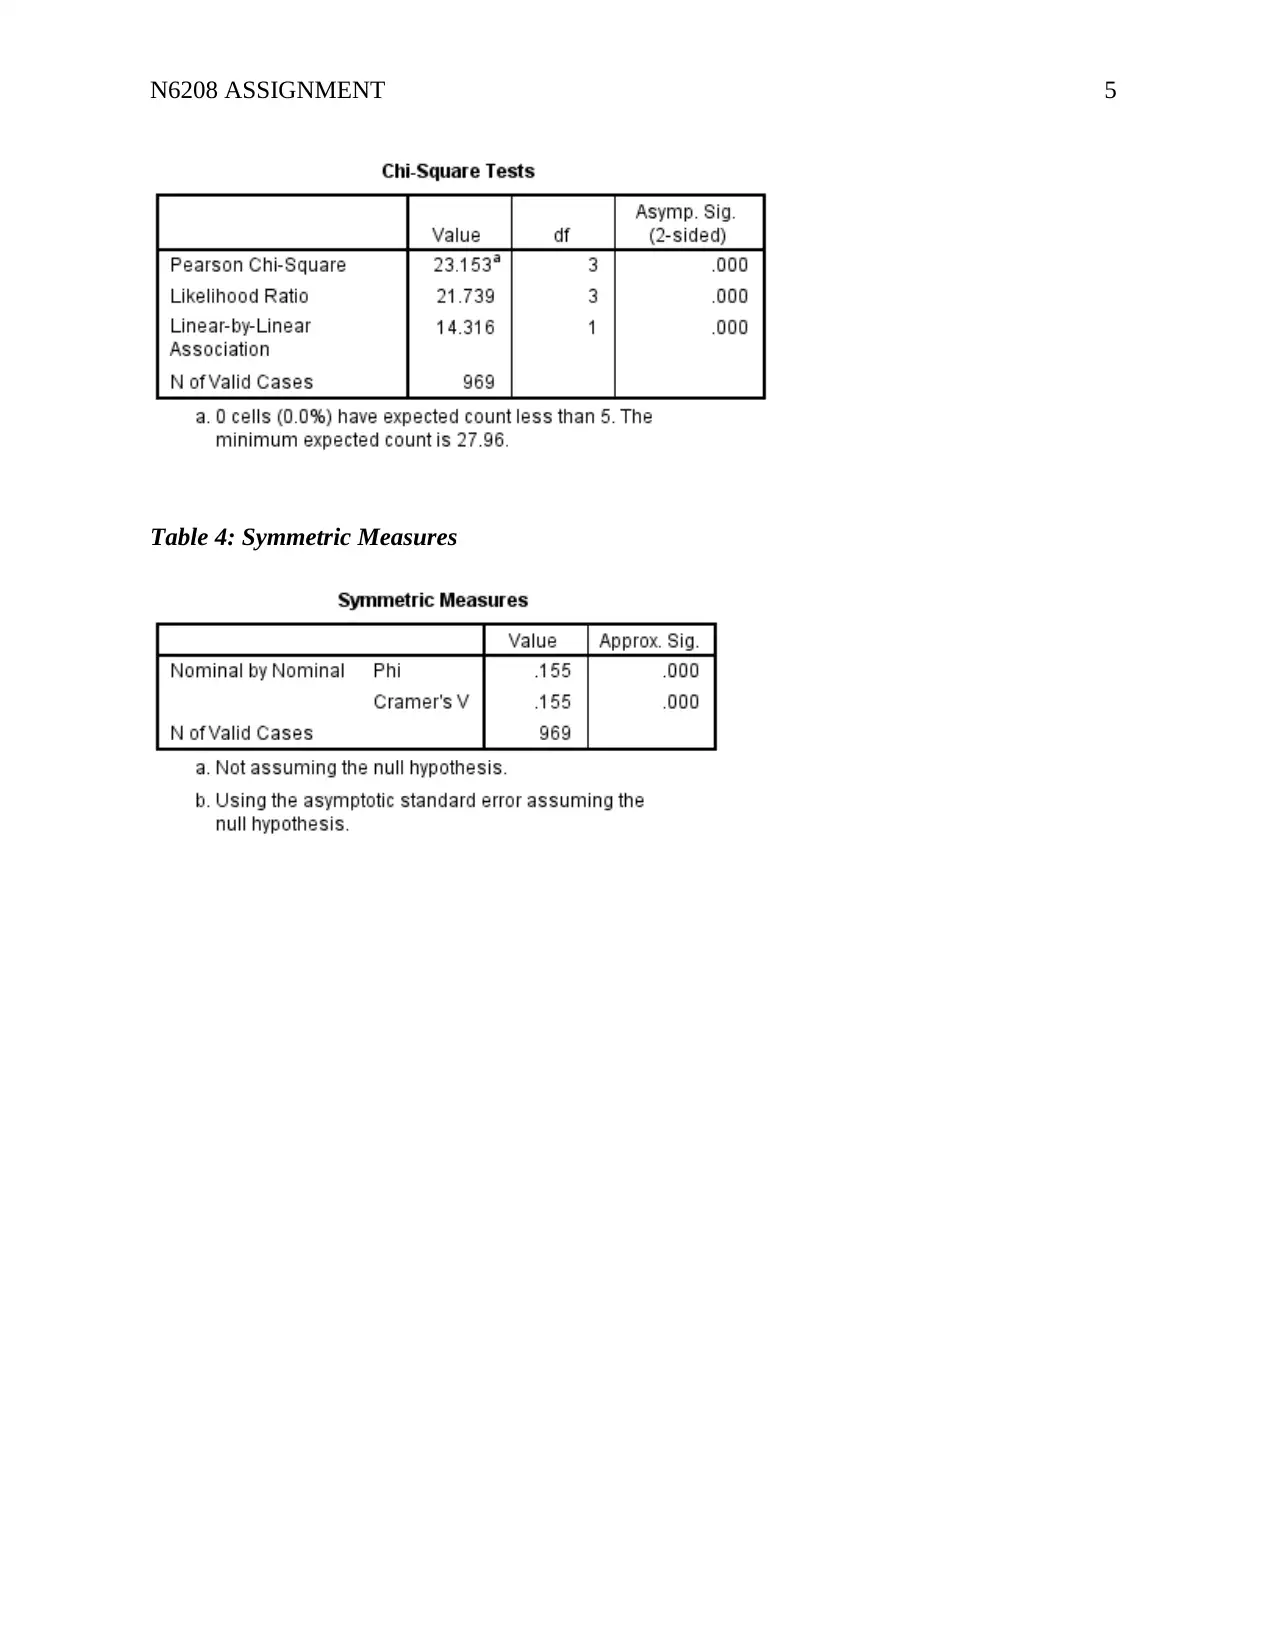
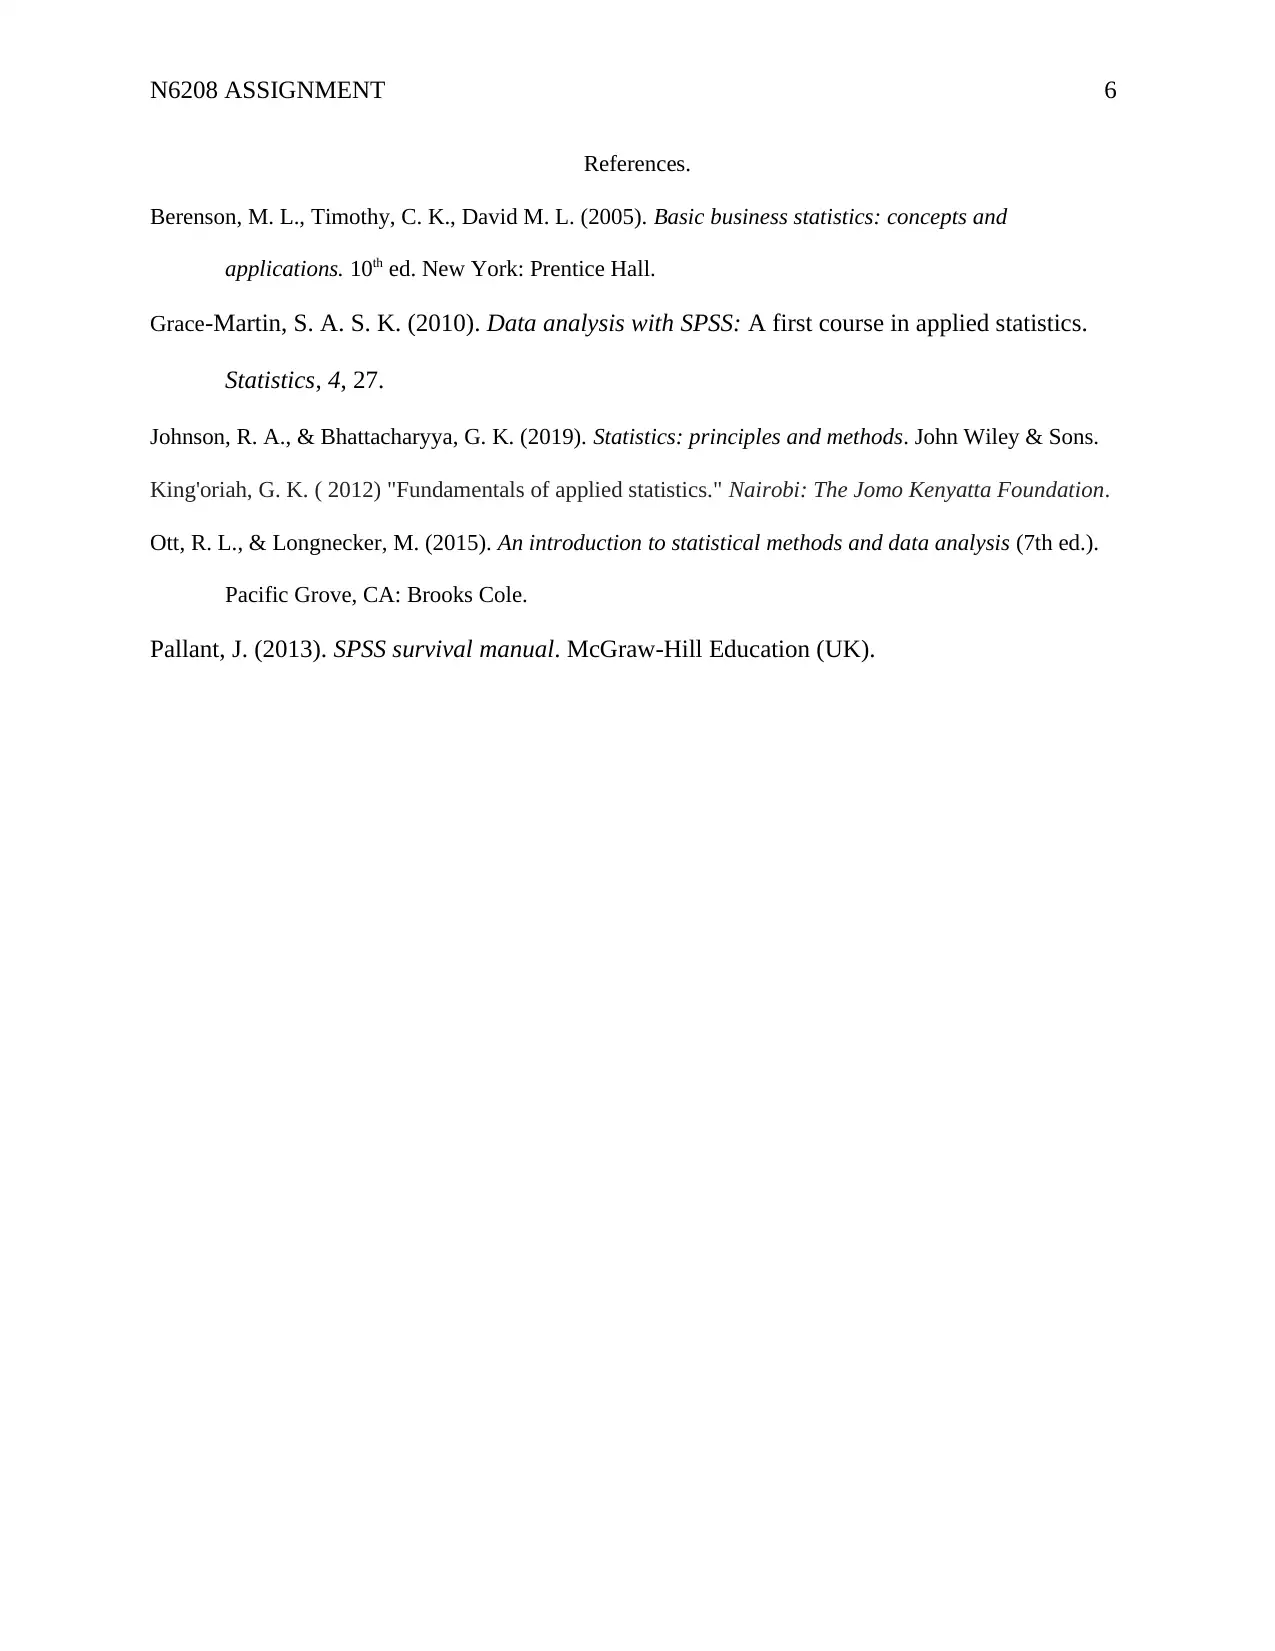
This homework assignment focuses on Chi-Square analysis, covering various aspects of the statistical test. The solution begins by determining the statistical significance of calculated Chi-square values in different scenarios, comparing computed values with tabulated values and degrees of freedom to assess significance at specified alpha levels. The assignment then identifies appropriate statistical tests for different situations, including Chi-square tests for independence and Analysis of Variance (ANOVA). A significant portion of the solution involves analyzing a dataset using SPSS, specifically focusing on the variables bmicat (BMI categories) and hlthlimit (health limitations). The analysis includes running a crosstab, calculating expected and observed frequencies, percentages, and the Chi-square statistic. The student answers questions about the output, including expected frequencies, percentages, the null hypothesis, the Chi-square value, degrees of freedom, and statistical significance. The student interprets the results, comments on the relationship between BMI and health limitations, and reports the value of Cramer's V. Finally, the SPSS output tables are attached, including case summaries, crosstabulations, Chi-square tests, and symmetric measures, providing a complete overview of the analysis and its findings. The solution concludes with a list of relevant references.
1 out of 6
Your All-in-One AI-Powered Toolkit for Academic Success.
+13062052269
info@desklib.com
Available 24*7 on WhatsApp / Email
![[object Object]](/_next/static/media/star-bottom.7253800d.svg)
Copyright © 2020–2026 A2Z Services. All Rights Reserved. Developed and managed by ZUCOL.