Epi I Homework 2: Measures of Occurrence
VerifiedAdded on 2019/11/12
|6
|1310
|184
Homework Assignment
AI Summary
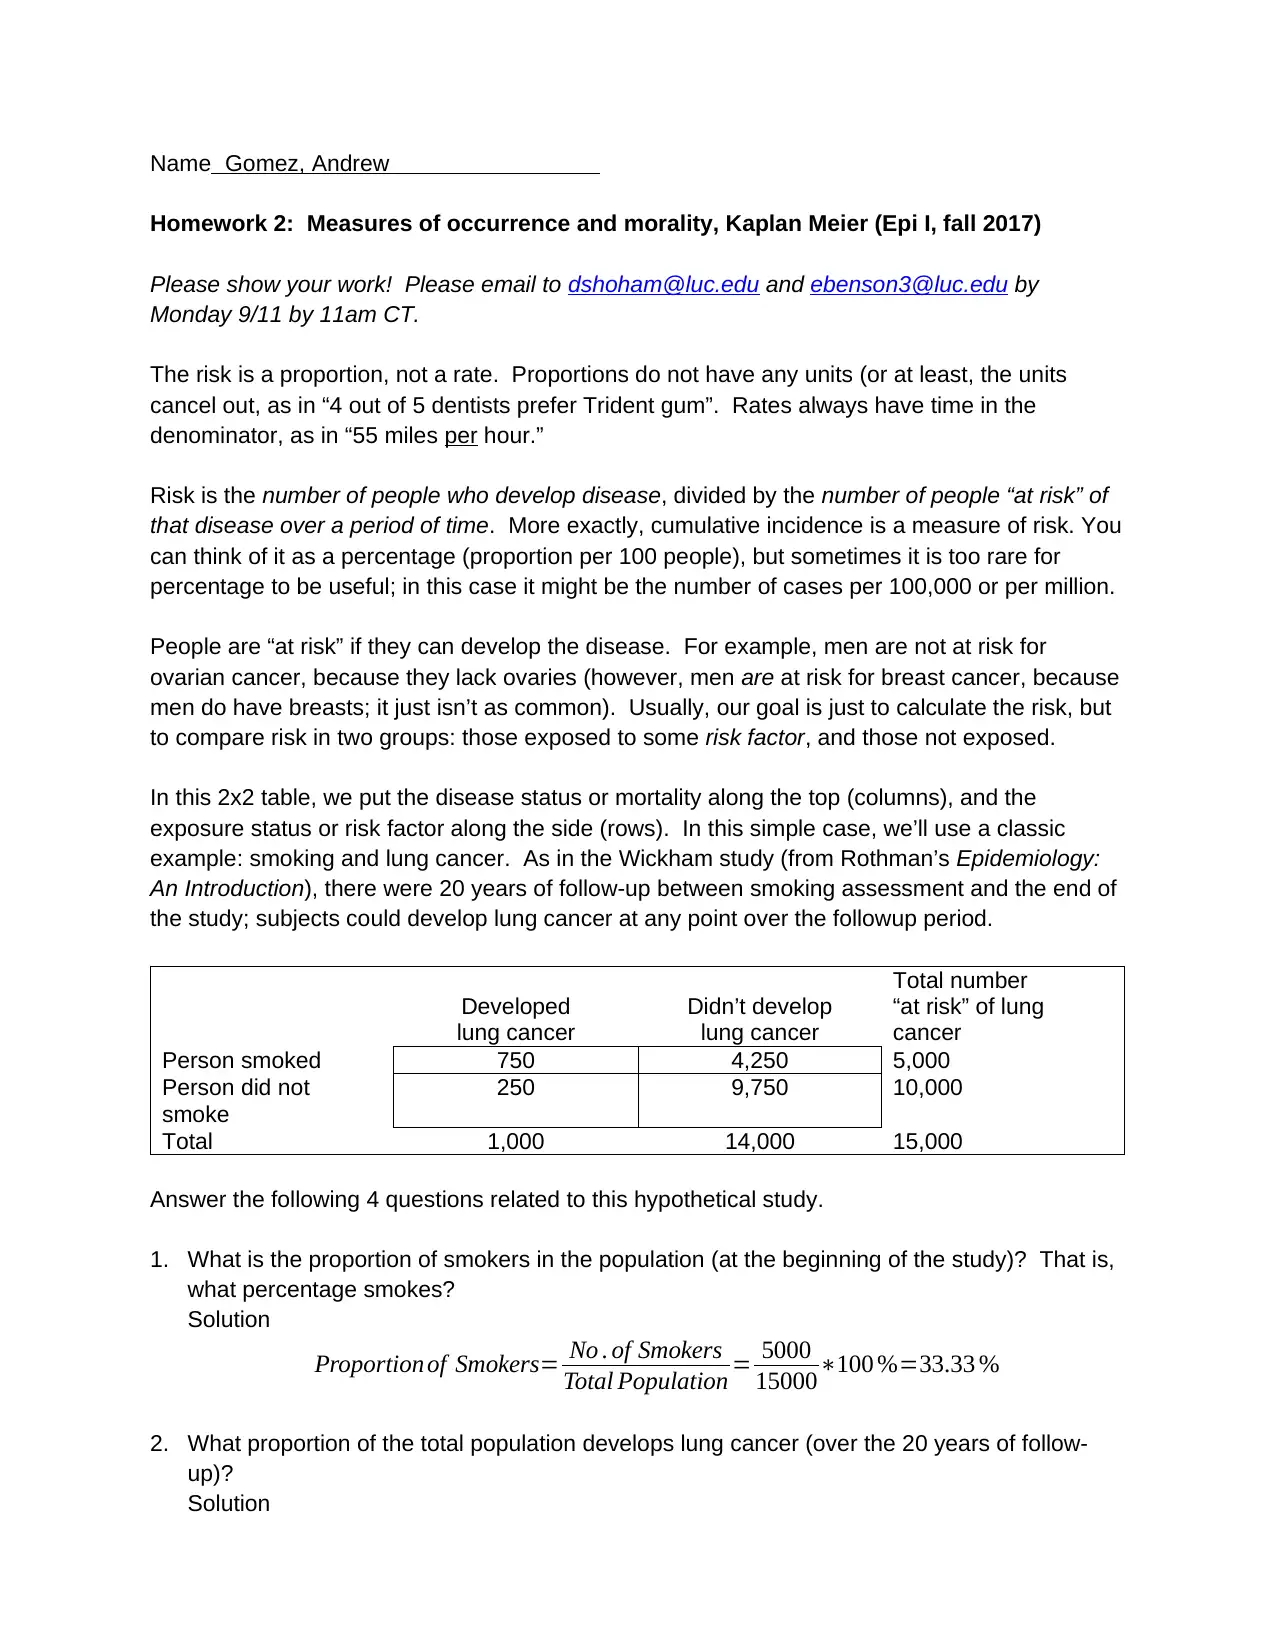
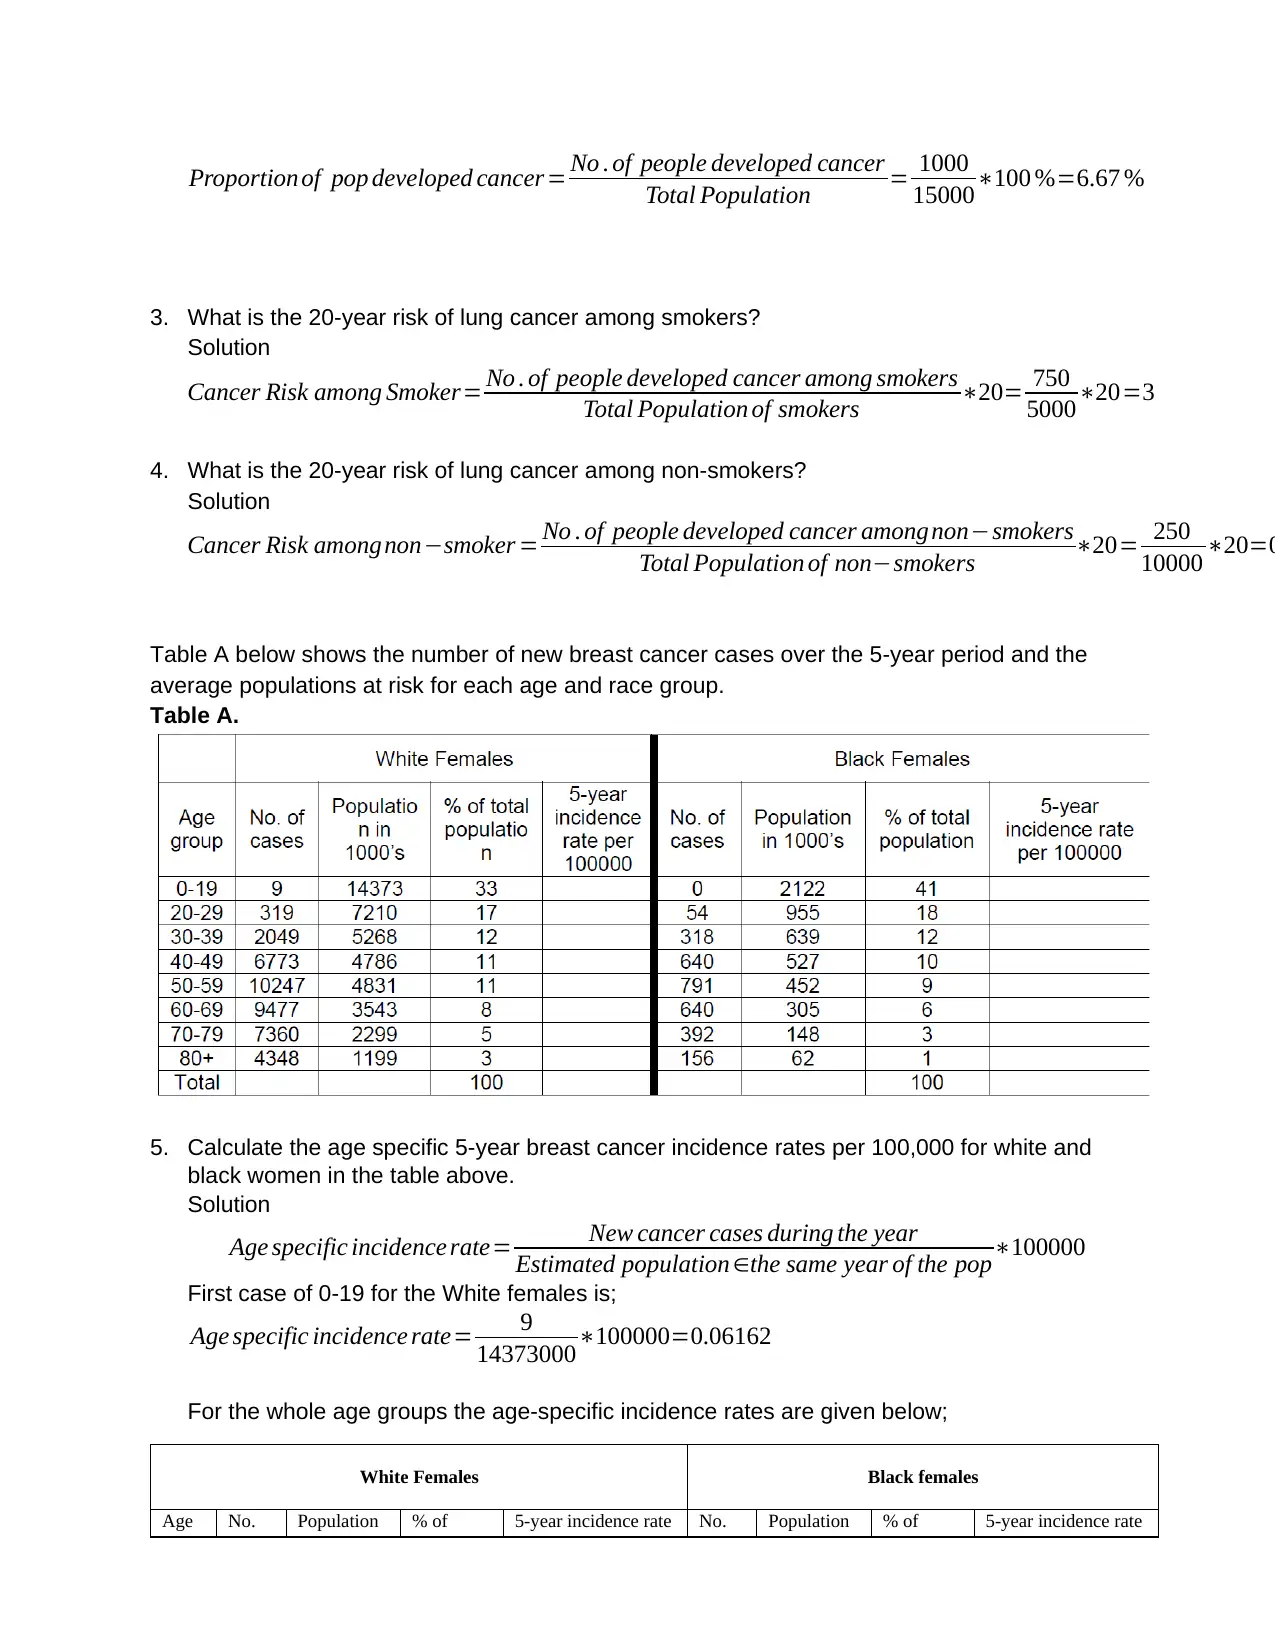
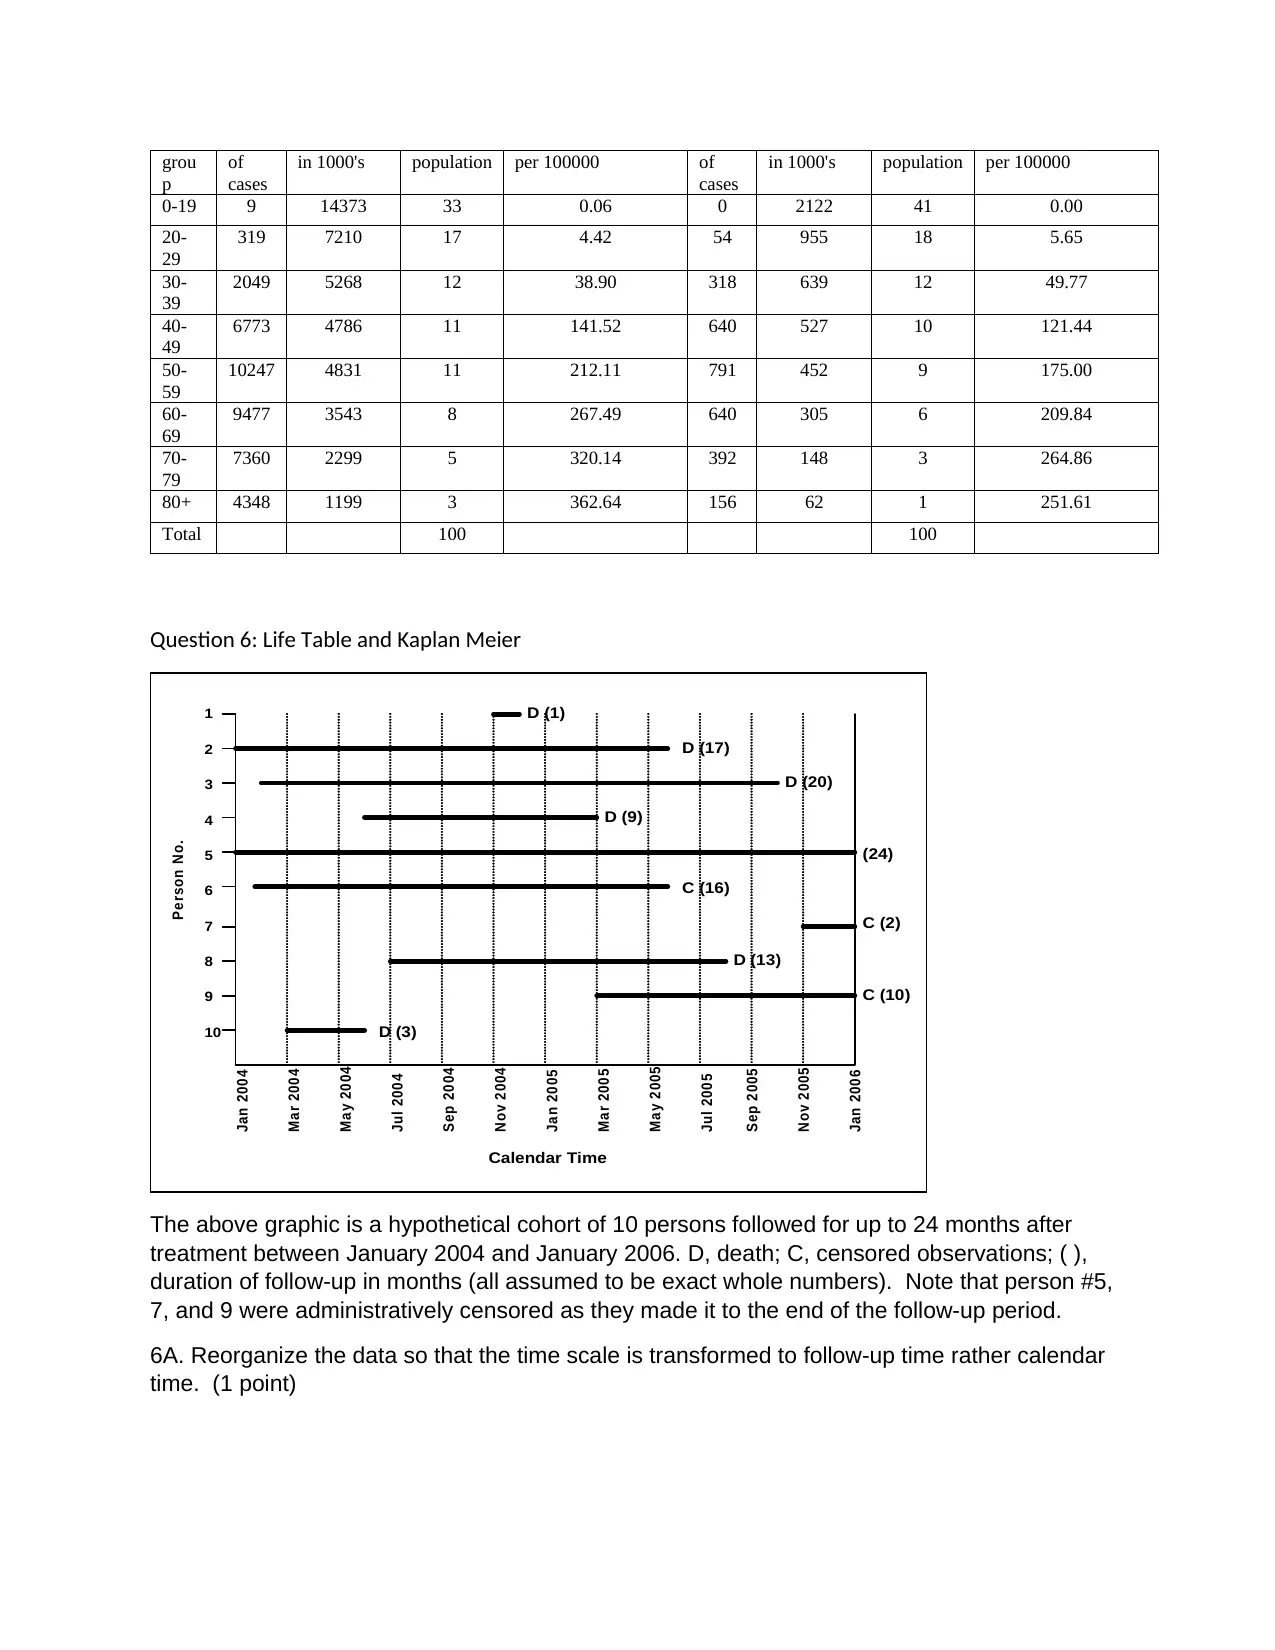
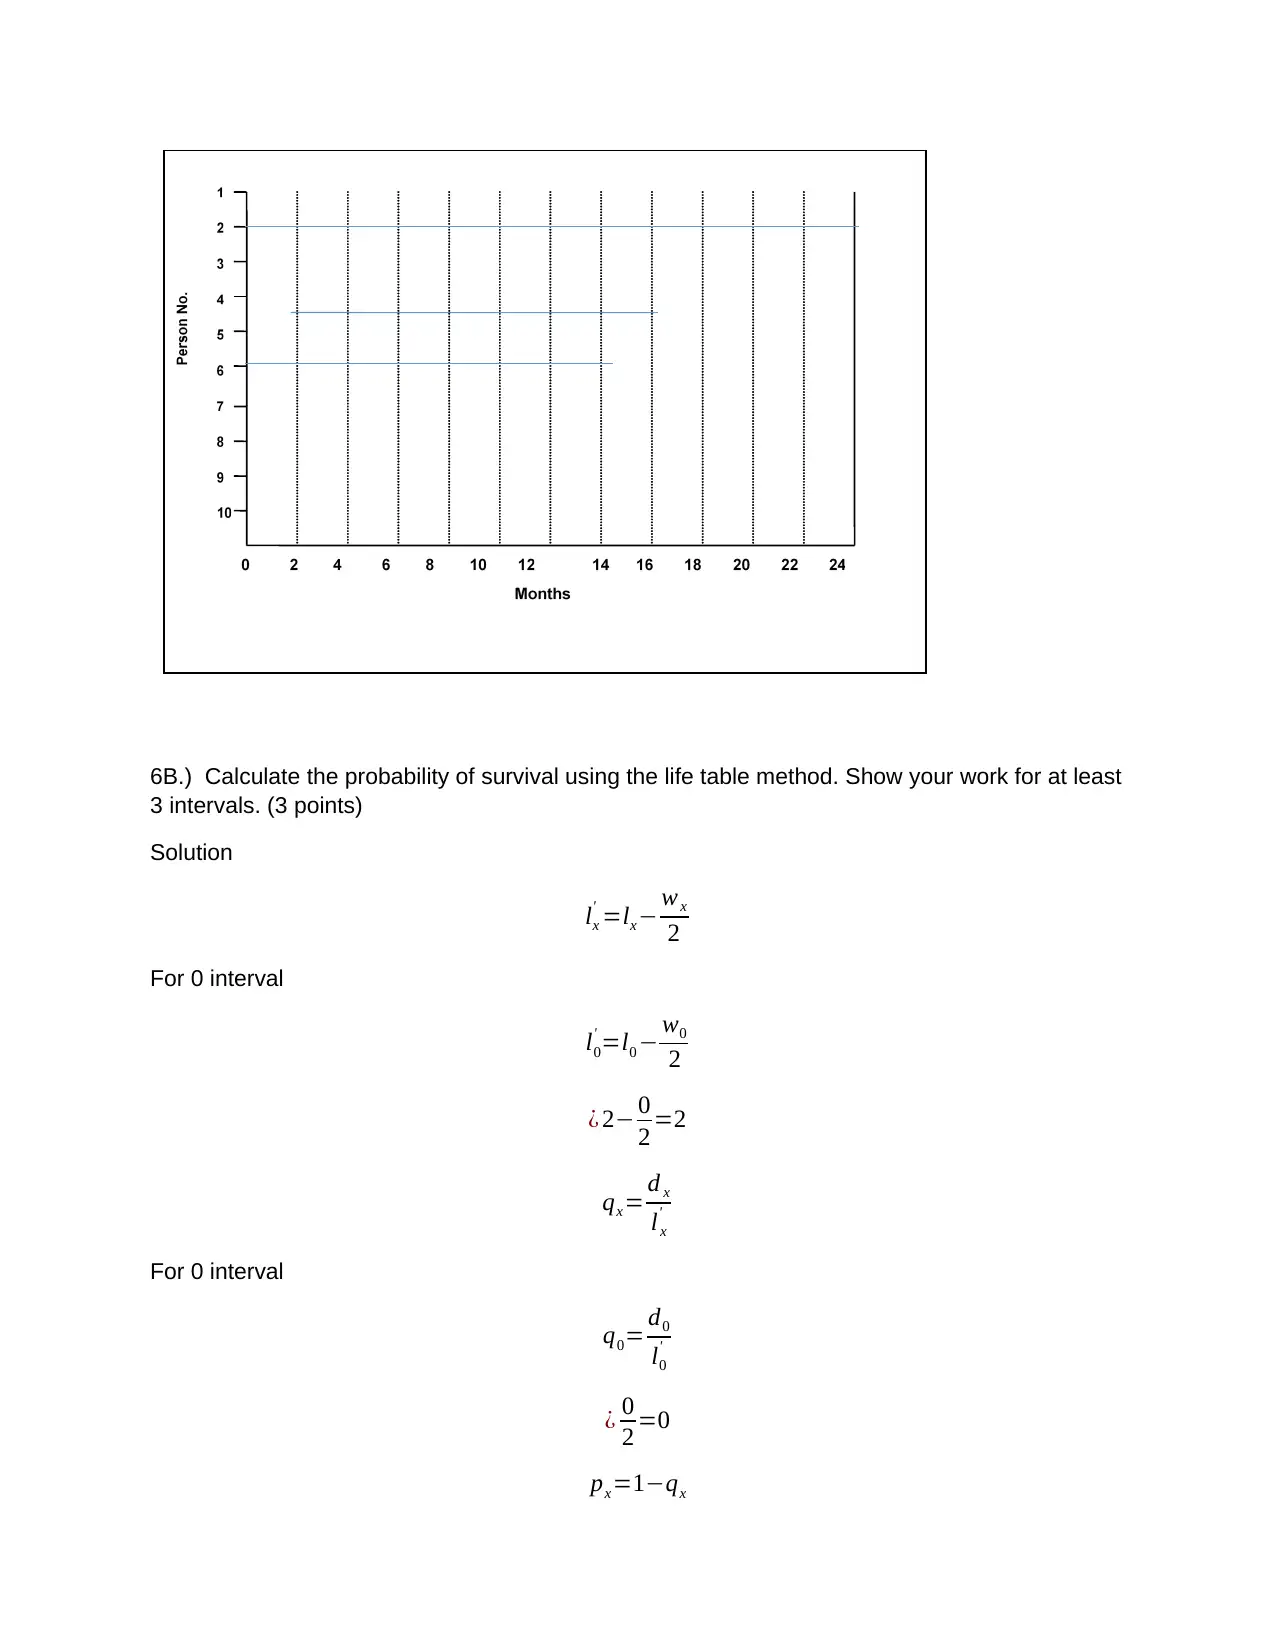
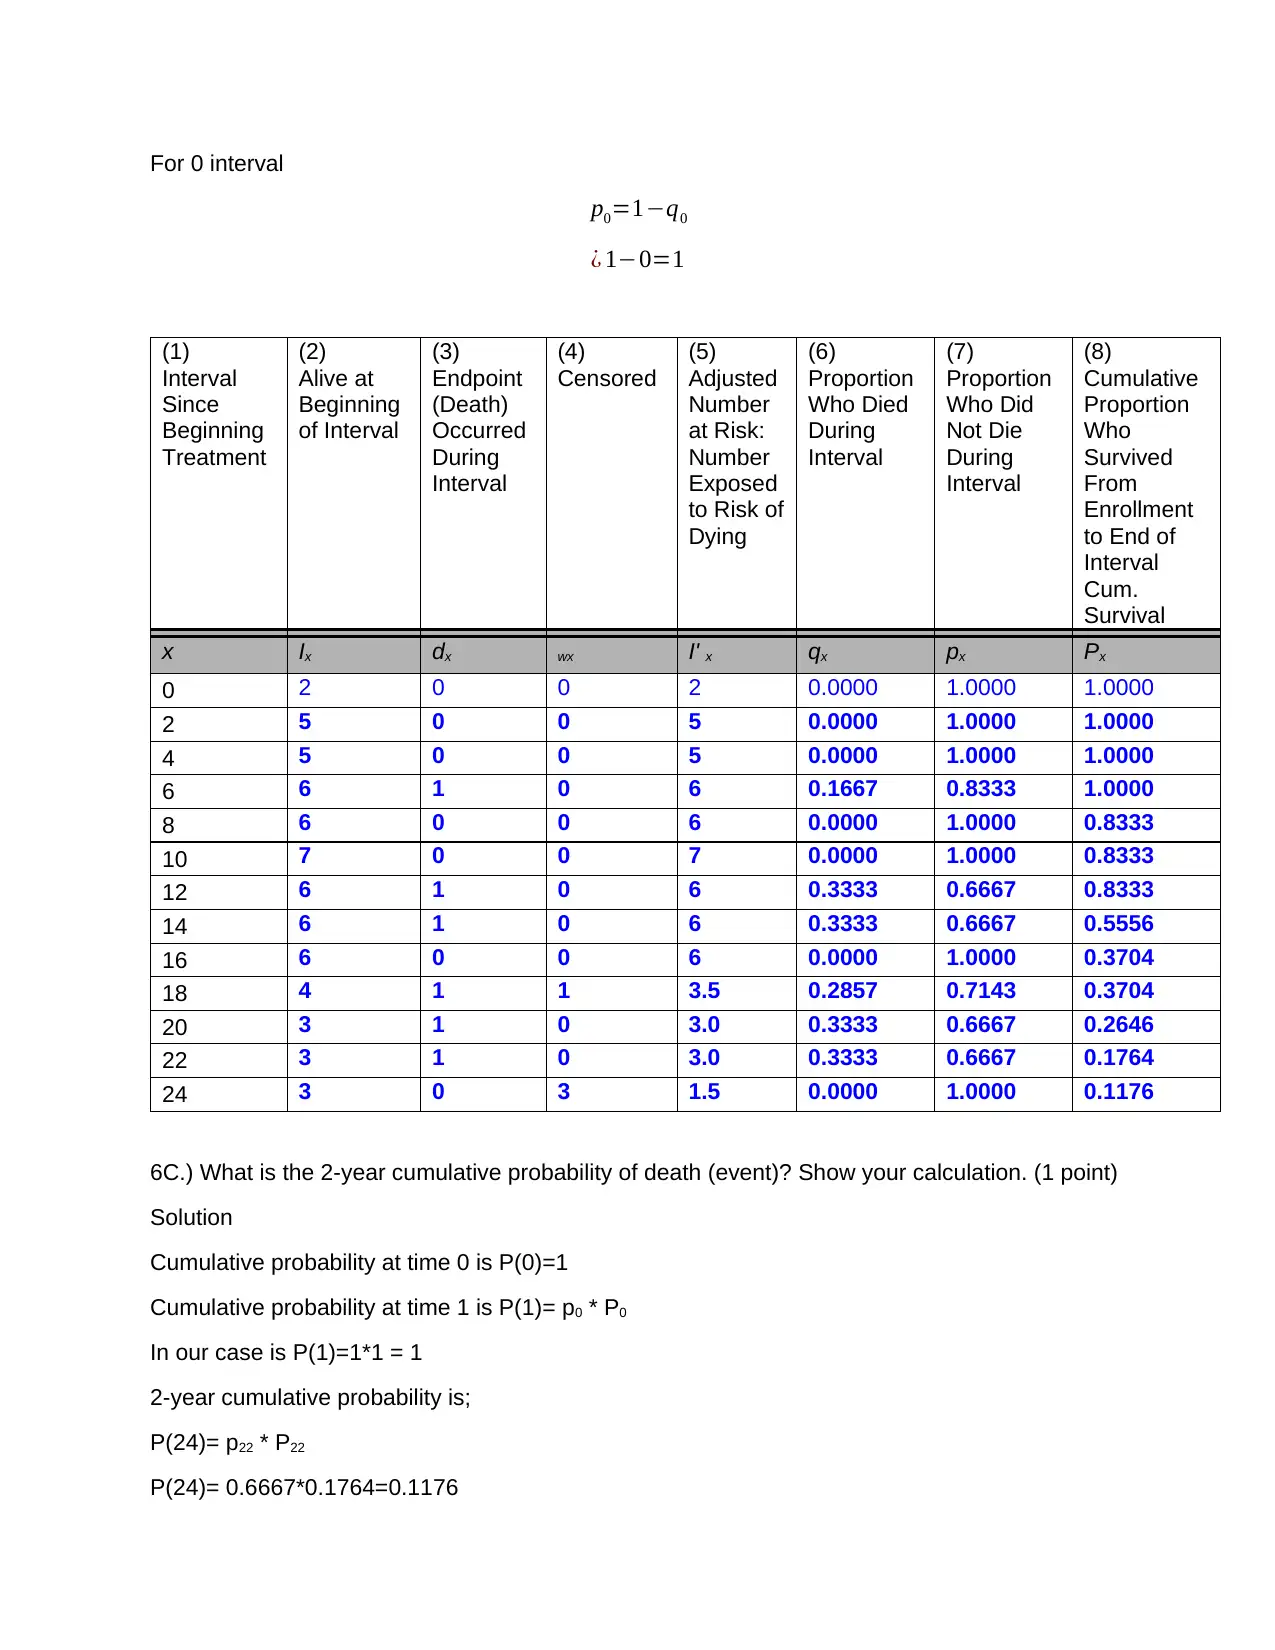
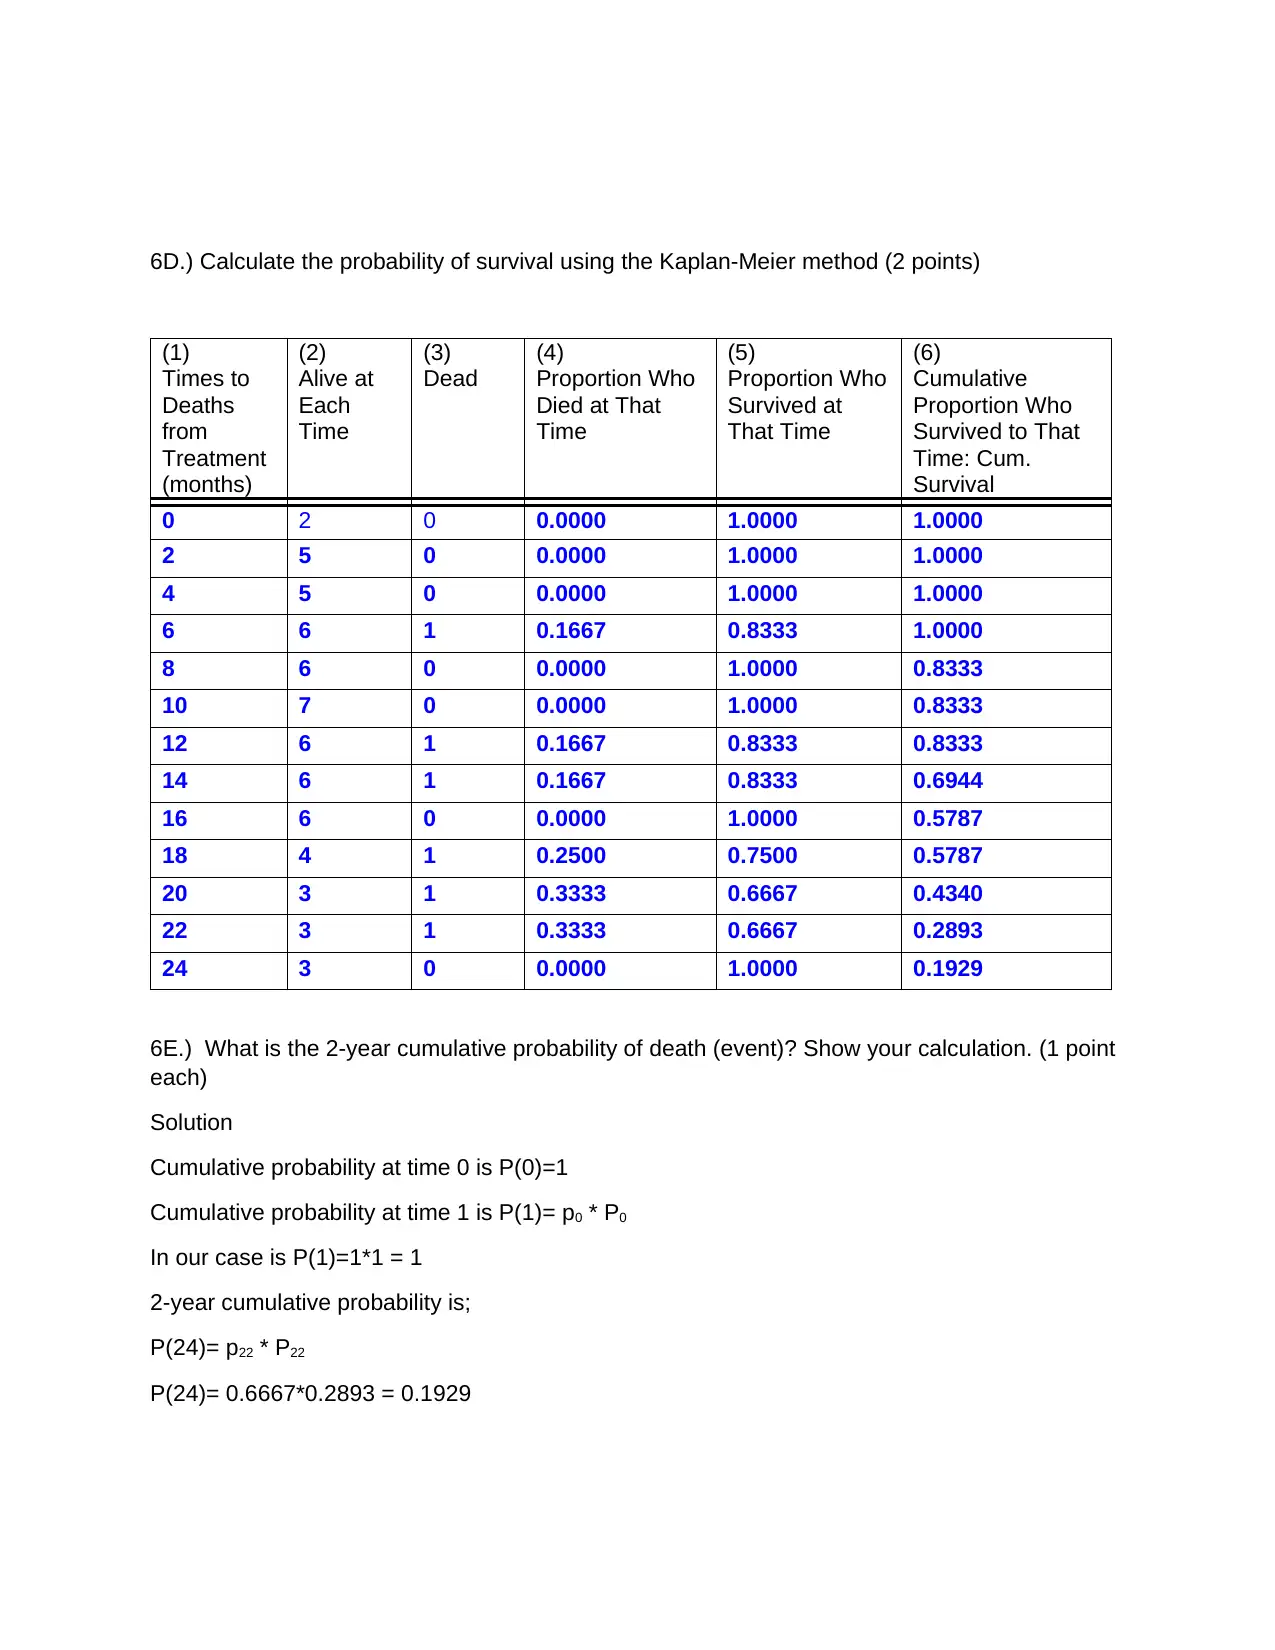
This homework assignment focuses on calculating measures of occurrence and mortality in epidemiology. It uses a hypothetical study on smoking and lung cancer to illustrate concepts like risk, cumulative incidence, and incidence rates. Students are asked to calculate proportions, risks, and age-specific incidence rates. The assignment also introduces life table and Kaplan-Meier methods for survival analysis, requiring students to calculate survival probabilities and cumulative probabilities of death using both methods. The provided solution includes detailed calculations and explanations for each question.
1 out of 6
Related Documents


Your All-in-One AI-Powered Toolkit for Academic Success.
+13062052269
info@desklib.com
Available 24*7 on WhatsApp / Email
![[object Object]](/_next/static/media/star-bottom.7253800d.svg)
Copyright © 2020–2026 A2Z Services. All Rights Reserved. Developed and managed by ZUCOL.