Statistical Analysis of Factors Influencing Teen Alcohol Consumption

Verified

Added on Ā 2023/01/23

|12
|2379
|74
Report
AI Summary
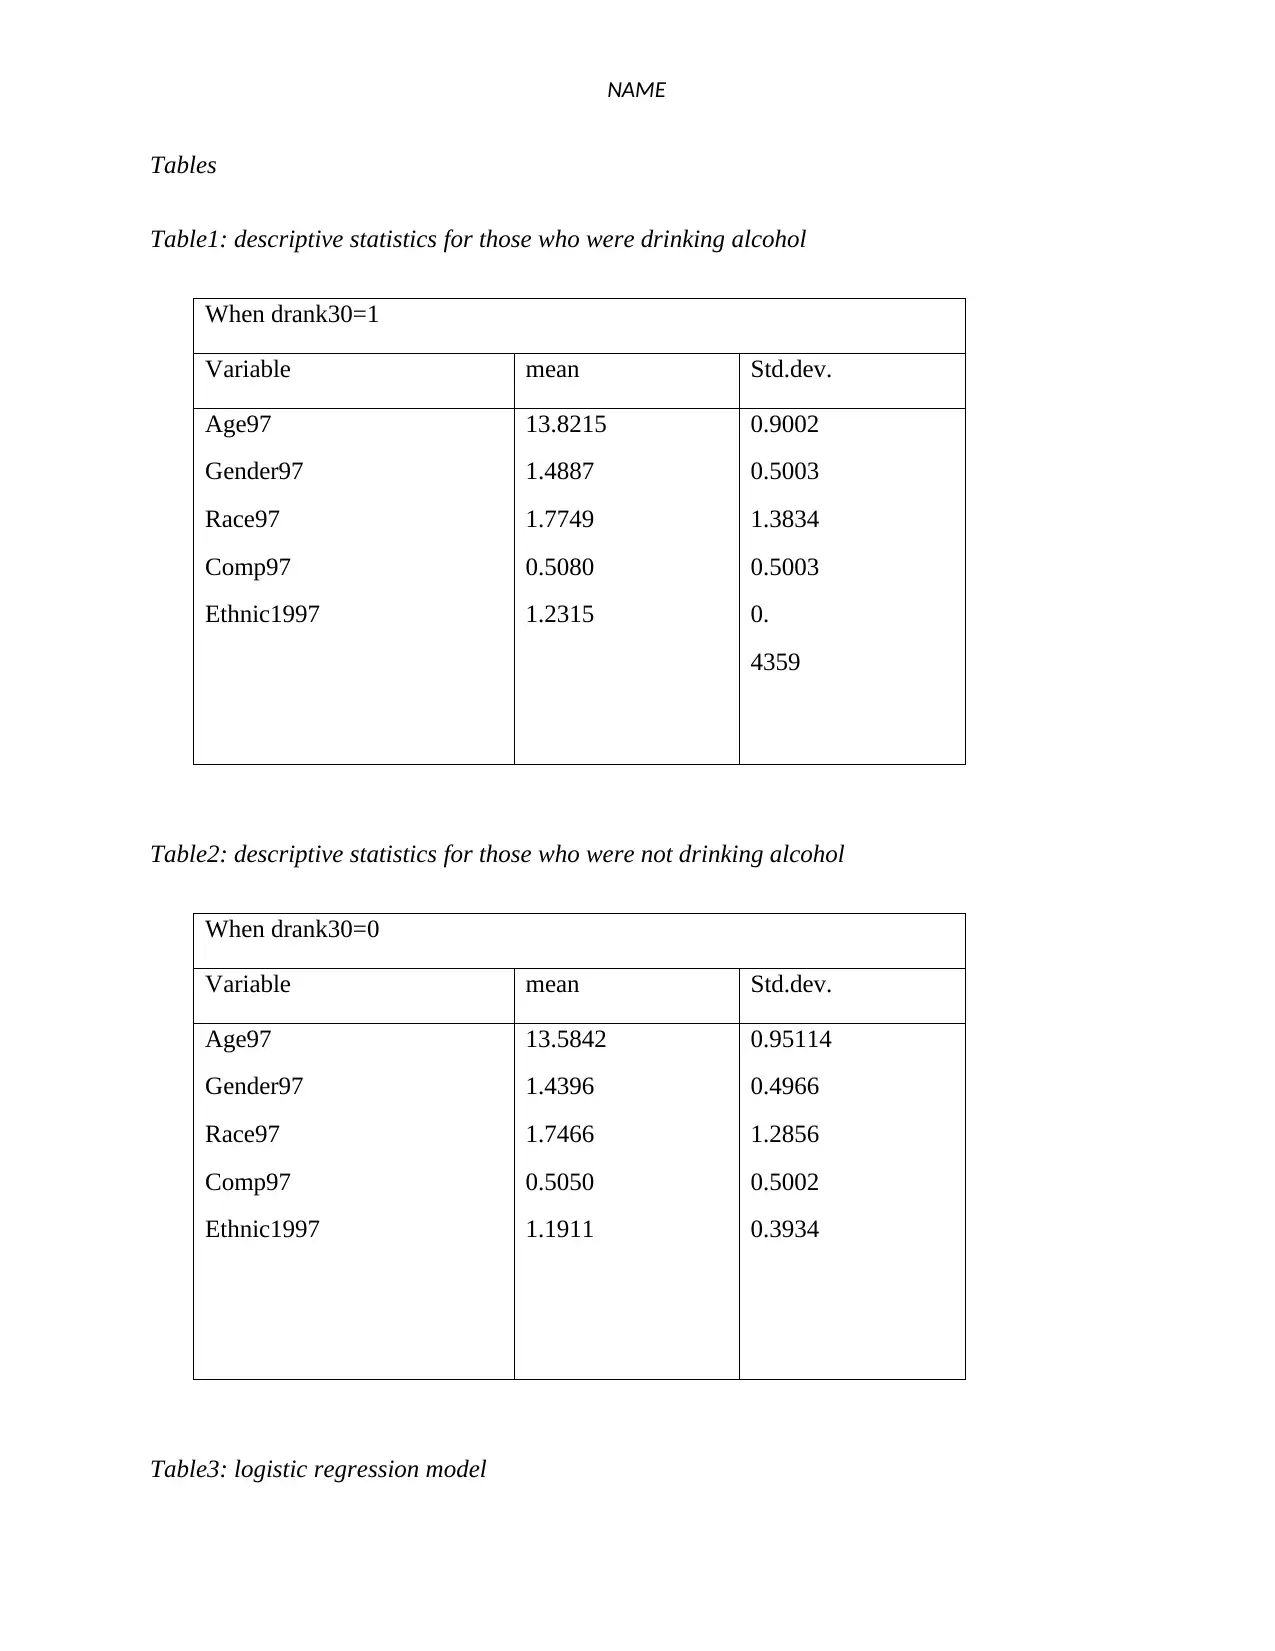
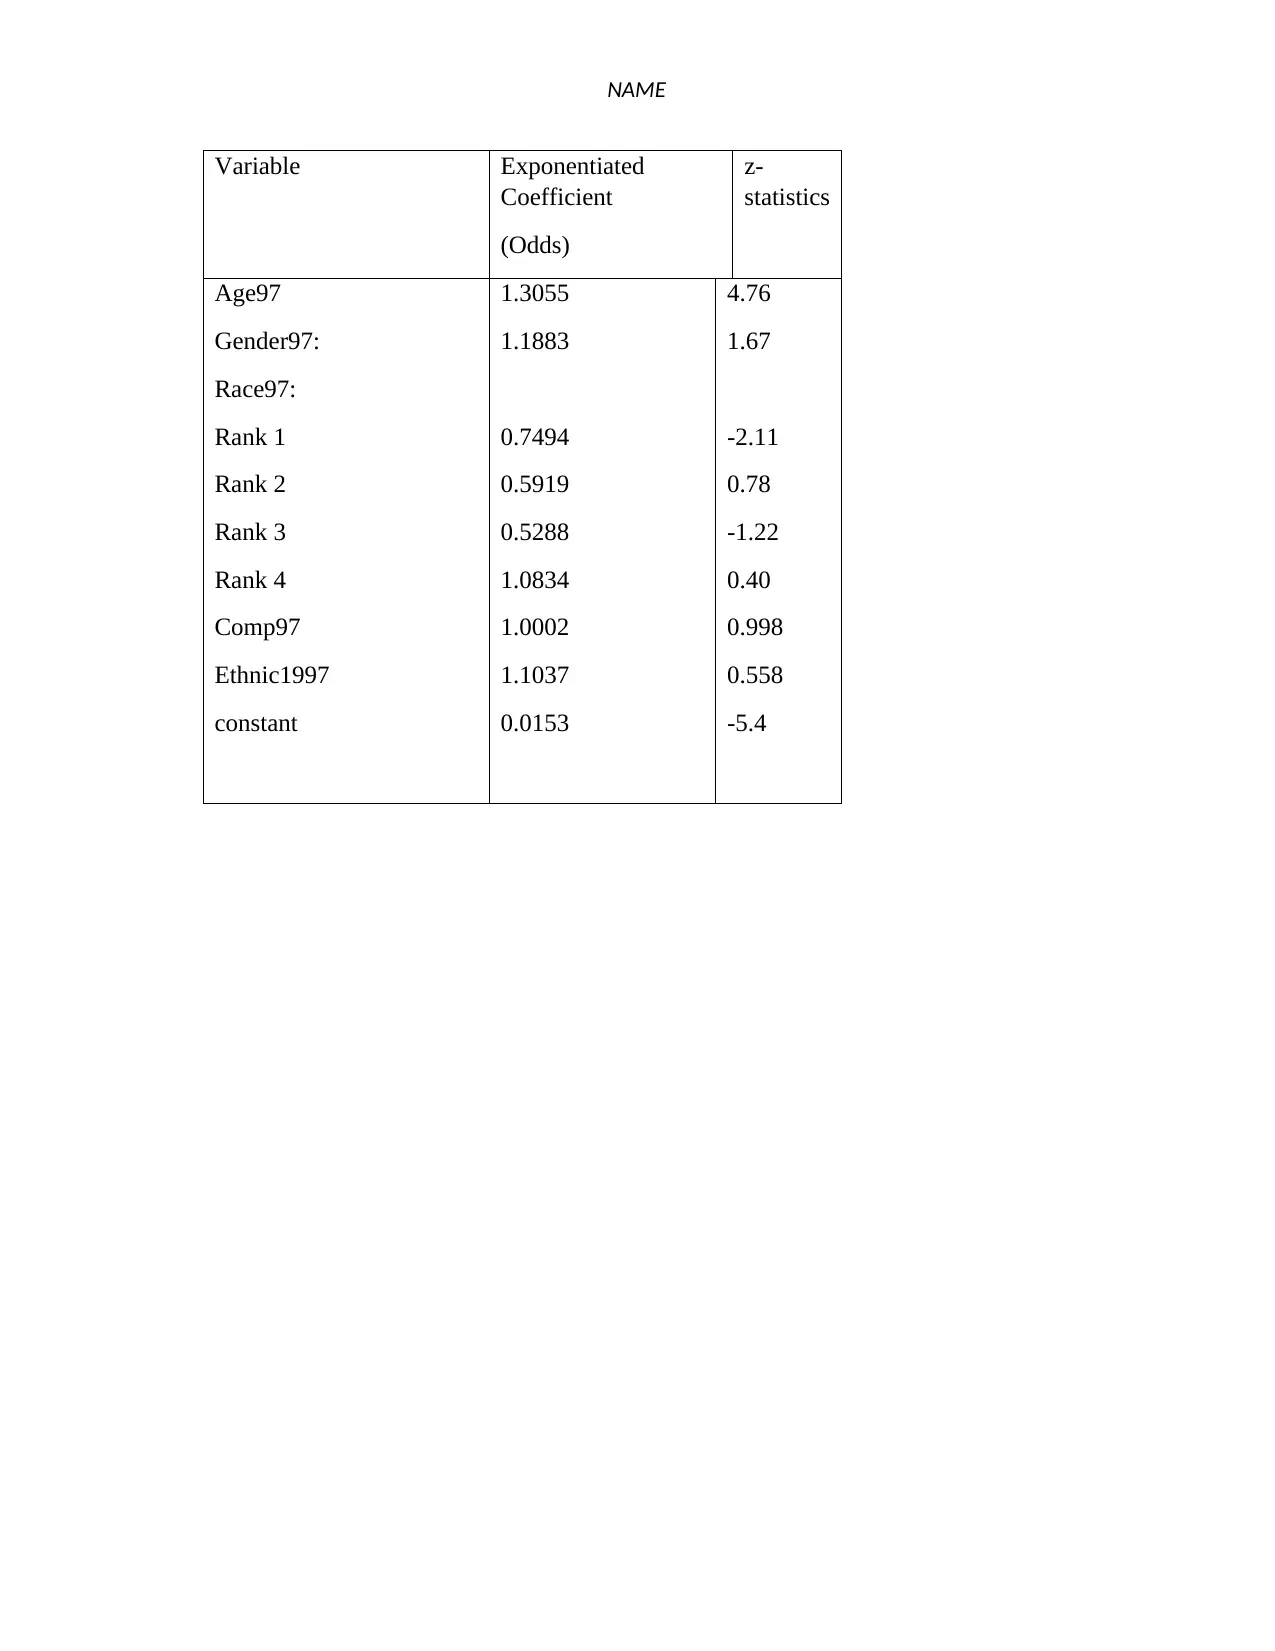
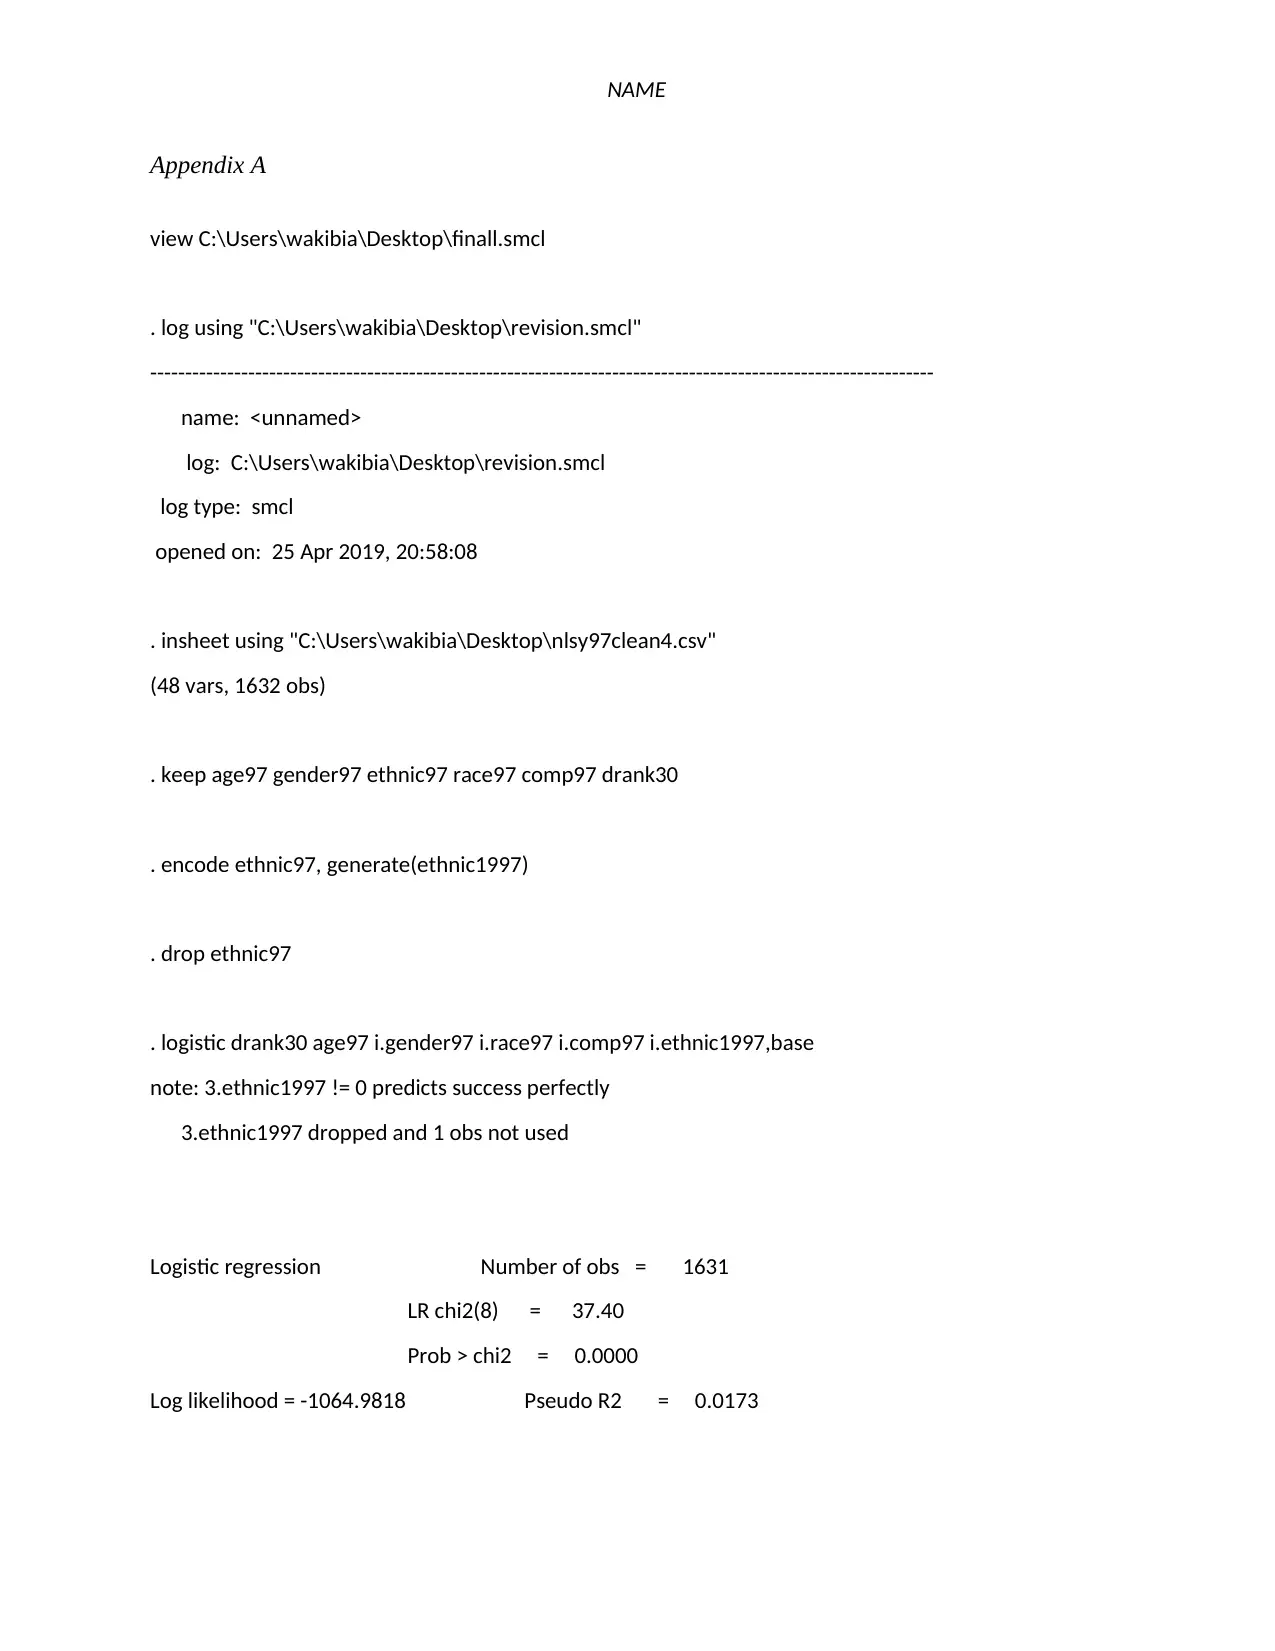
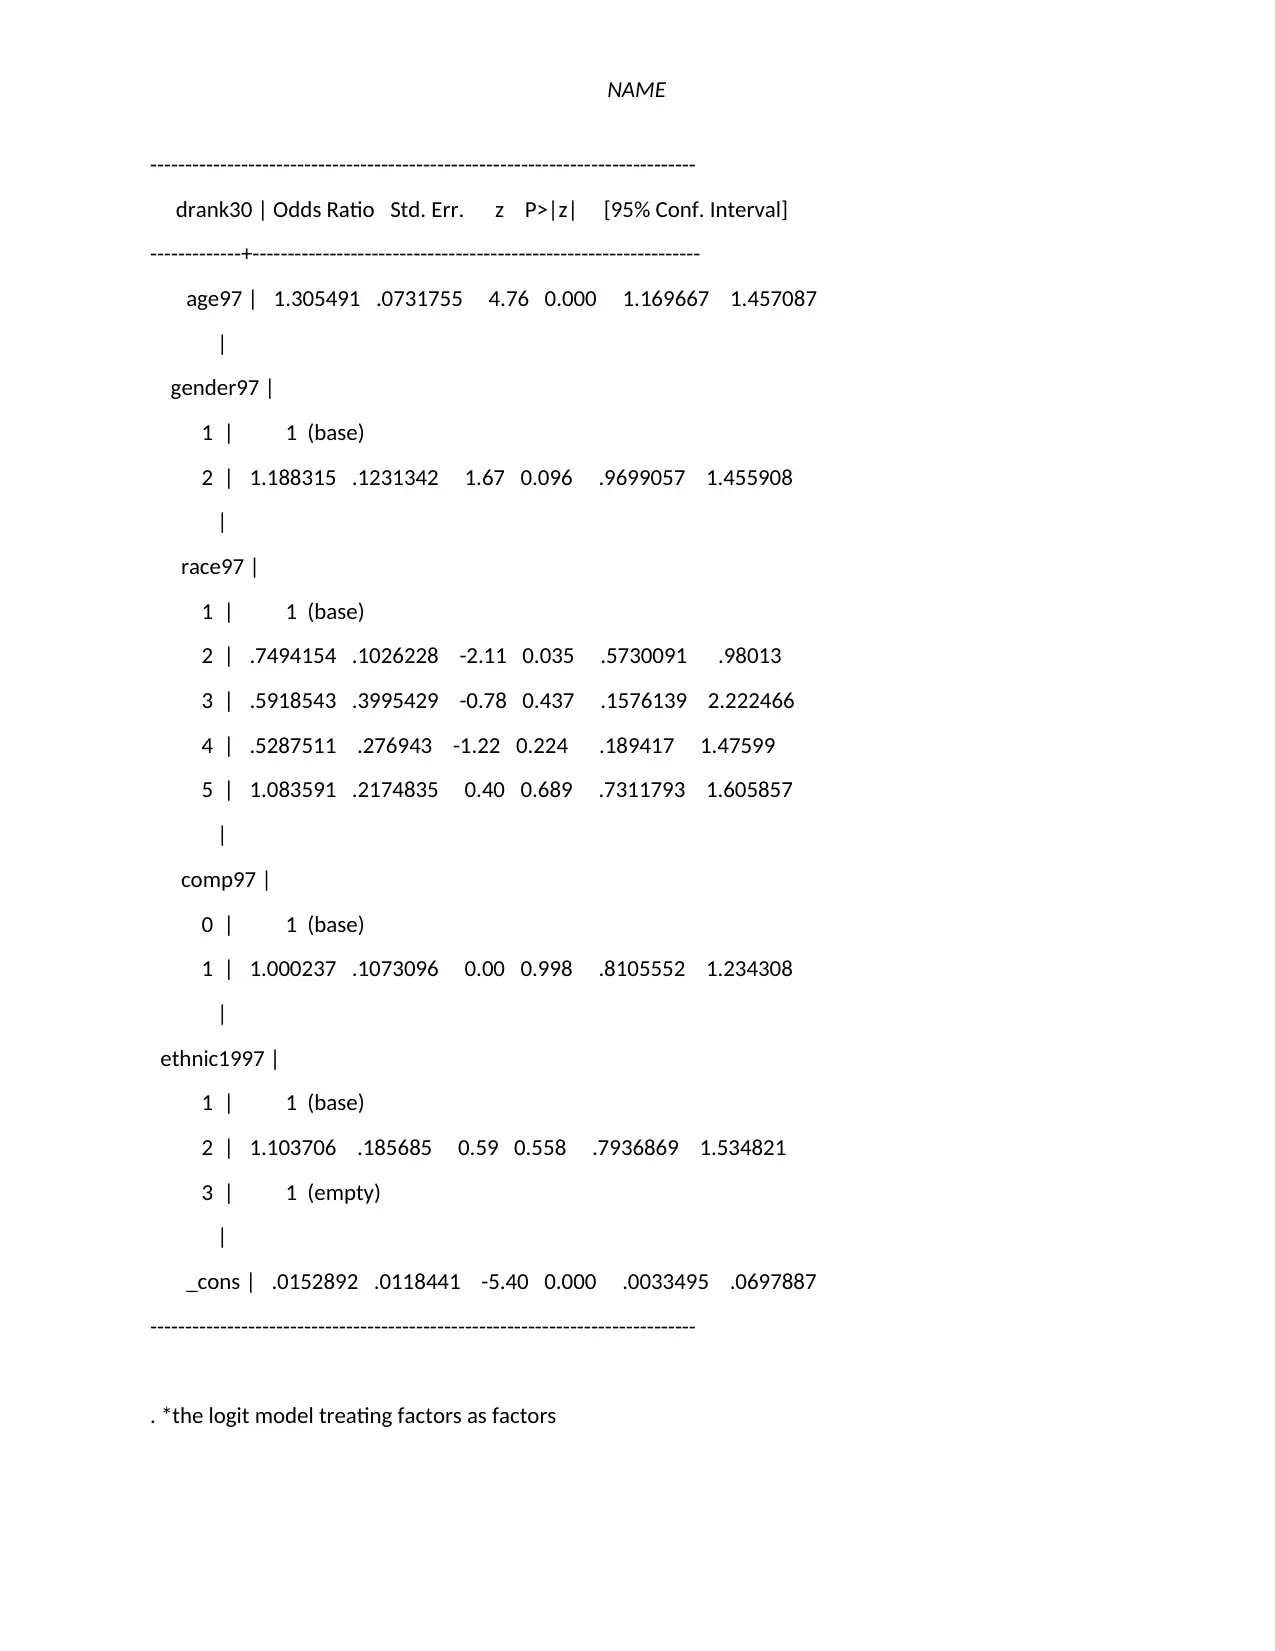
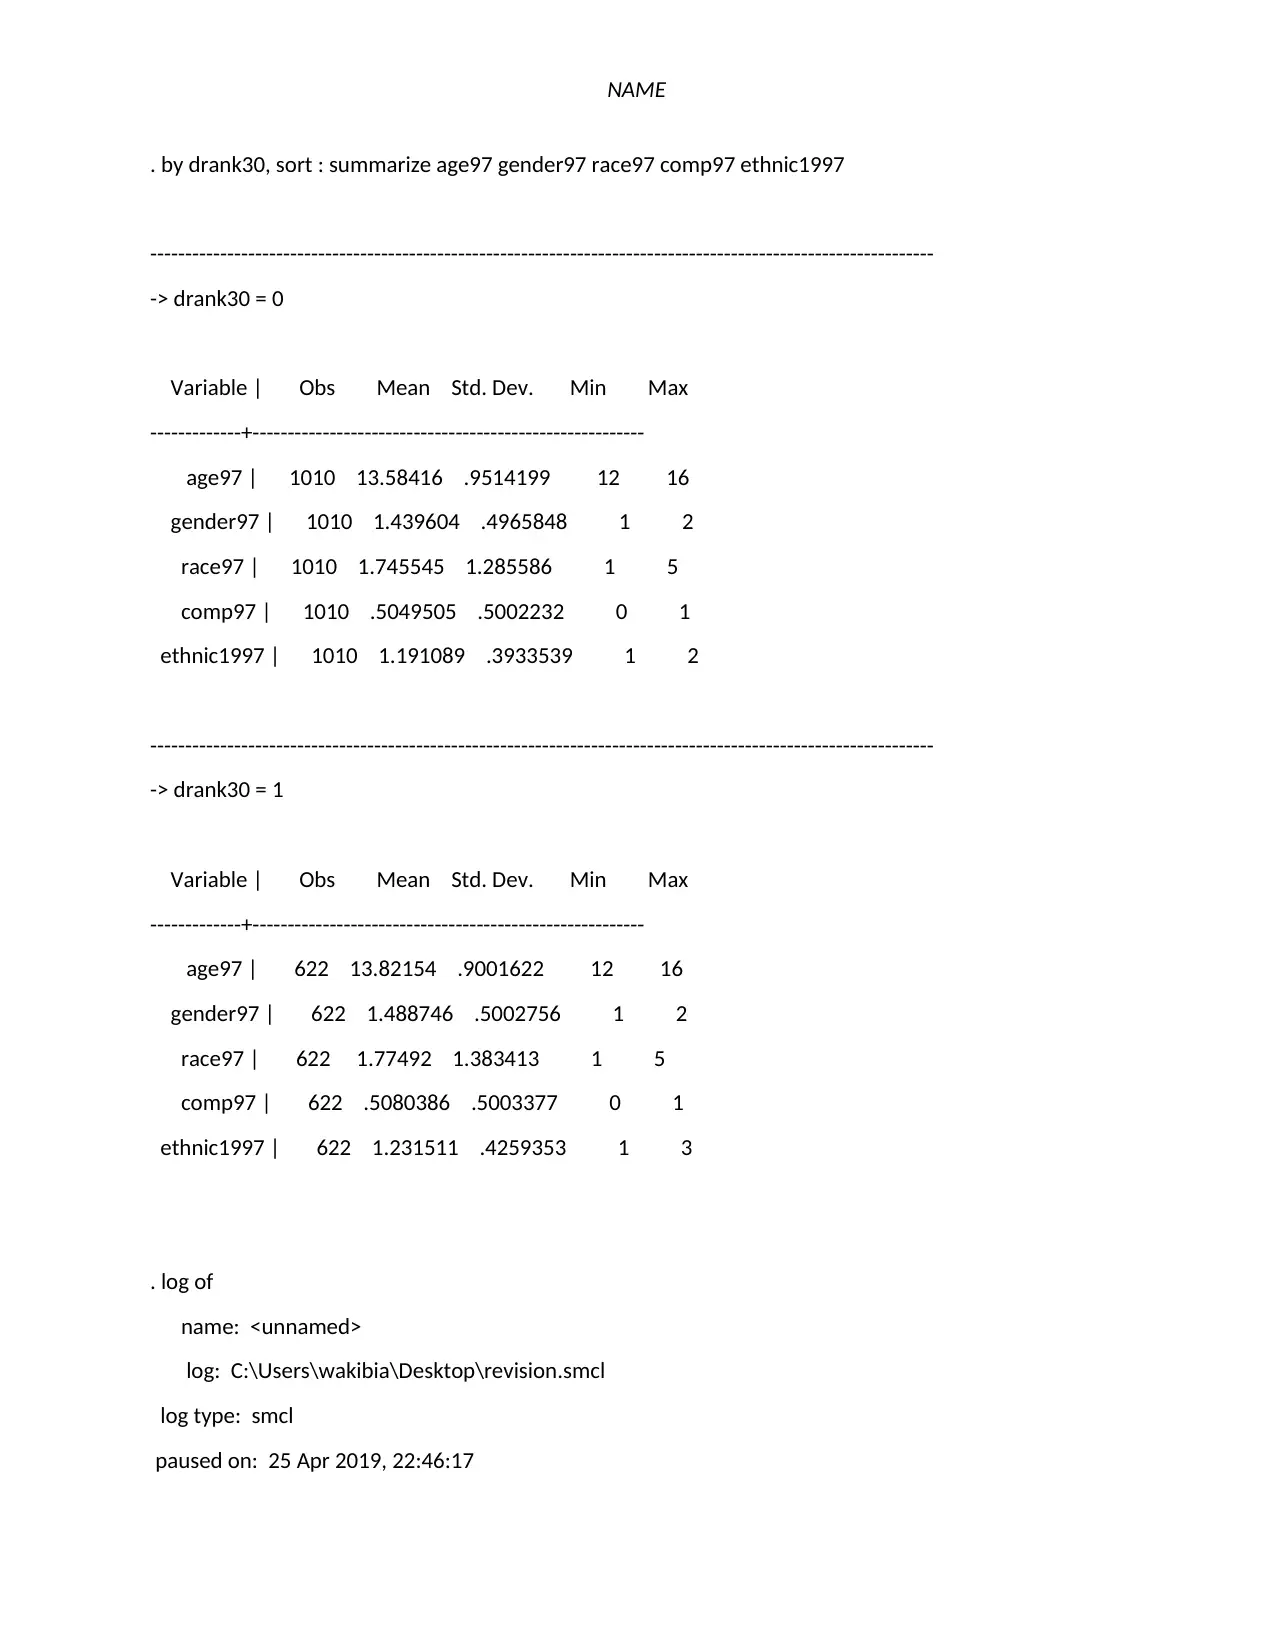
This report presents a statistical analysis of teen alcohol consumption, utilizing data from a 1997 survey. The study employed a logistic regression model to investigate factors influencing alcohol use among young people. Variables considered included age, race, gender, computer usage, and ethnicity. Descriptive statistics were performed to examine the data spread, followed by the fitting of a logit model to determine the significance of each explanatory variable. The results indicated that age and race (specifically, being African-American) were significant predictors of teen alcohol consumption, while gender, computer usage, and ethnicity were not. The model suggests that the probability of alcohol consumption increases with age and is higher among African-American teens. The report concludes with a discussion of these findings and their implications, emphasizing the need for regulation and restrictions to prevent early alcohol use and its potential consequences, such as increased risk of crime.
Document Page
NAME
Title:
Assignment Name:
Student Name:
Course Name and Number:
Professor:
Date:
tabler-icon-diamond-filled.svg

Paraphrase This Document

Need a fresh take? Get an instant paraphrase of this document with our AI Paraphraser
Document Page
NAME
Introduction
Alcohol consumption has reached a frustrating level currently among teens. Mostly the teens
start using alcohol to have fun with their peers but if uncontrolled it results in negative
consequences. In 1993 the world health organization (W.H.O.) produced statistics indicating that
alcohol use among the young people was increasing by 4% globally annually which is a greater
risk of concern (Hanson et al, 2014).
Due to this, a study was conducted to investigate various factors that lead young people to start
using alcohol at their early ages. Various factors were considered which could influence teens to
start using alcohol. The data used were obtained in a survey conducted in 1997. The response
variable used in this study is binary and hence a logistic regression model was used to model the
data.
Method and data
The data used is a sample from the data collected during the 1997 survey. The sample used was
obtained by simple random sampling so that the conclusion that will be drawn from it may be
reliable about the entire survey. The variables used are provided below and how they had been
coded.
Label Description
Drank30 Drunk alcohol (if yes it was coded1, if no it was
coded 0)
Ethnic1997 Youth ethnicity in 1997(0 if non-Hispanic, I if
Hispanic )
Age97 Age of the youth in1997
Race97 Youth race in 1997 (1 if white,2 if African
American, black, 3 if American Indian, Eskimo or
Aleut, 4 if Asian or Pacific Islander, 5 something
Document Page
NAME
else or combination)
Gender97 Youth gender 1997(1 if male, 2 if female)
Comp97 Using a home computer (1 if yes, 0 if no)
In this case to fit the model the acronyms of the names are going to be used for conveniences in
the output. The entire analysis that was conducted was done using Stata software.
A descriptive statistic was performed to investigate the spread of the data. Descriptive statistic
was done in two subcategories, for those who drank alcohol and for those who didn’t drink
alcohol. The results are presented in table 1 and table 2 respectively. From table 1 the average
age of those who drank alcohol was 13.82 and had a range of four. This implied that there was
no great age difference between those who were beginning to take alcohol. The average of race,
gender, computer usage, and ethnic group were, 1.8, 1.5, 0.5, and 1.23 respectively which were
categorical variables.
Table 2 represents the output of the descriptive statistics for those who didn’t take alcohol. The
average age for those who didn’t take alcohol was 13.58. In comparison with those who took
alcohol, those who took alcohol tend to be slightly older than those who didn’t take alcohol
(Lever et al, 2016). The averages for the race, gender, computer usage, and ethnic group were
1.7, 1.4, 0.5, and 1.29 respectively. Comparing the averages for the categorical variable its only
ethnic group that had a great difference in averages. This indicated that there is an ethnic group
which didn’t take alcohol too much. From both table1 and table2 the standard deviations are
small and hence they do not indicate greater variability among the explanatory variables.
Findings
Document Page
NAME
To investigate whether drinking alcohol (yes or no) was associated with an ethnic group, gender,
computer usage, race, and age of the teen a logistic regression model was fitted which was of the
form l ogit ( drank )=β0 +β1 gender 97+ β2 race 97+ β3 ethnic 1997+β4 comp 97+β5 age 97 . The
output in table 3 represents the output of the fitted logit model. A test was performed to
determine which explanatory variable was significant in explaining the whether a teen drank
alcohol or not.
The first test was based on the following hypothesis;
H: age97 is not significant in explaining whether a person drank alcohol or not
H: age97 is significant in explaining whether a person drank alcohol or not
Using the output in table 3. The p-value for age97 is 0.000 comparing this with a 5% level of
significance the null hypothesis was rejected and hence the age of the teen was significant in
explaining whether a teen was drinking alcohol or not (Kim et al, 2012). Similarly, race97 given
it was an African-American was significant in explaining whether the teen was drinking alcohol
or not since it had a p-value of 0.035 which is less than 5% level of significance. In contrast, the
comp97, ethnic1997, and gendr97 all had p-values which were greater than 5% level of
significance. The conclusion was that they were not significant in explaining whether a teen was
drinking alcohol or not. From the above test, it indicated that the best logit model could include
only race and ethnic group of the teen as the predictors of the teens who were taking alcohol.
The fitted logit regression model whose coefficients are represented in table 3 thus has only two
predictors that are significant in explaining the model. The two significant predictors have the
following interpretation. For age97 it has a coefficient of 0.267 which is greater than zero thus
the probability of drinking alcohol increased as age increased. Which in term of odds is
tabler-icon-diamond-filled.svg

Paraphrase This Document

Need a fresh take? Get an instant paraphrase of this document with our AI Paraphraser
Document Page
NAME
(e ¿¿ 0.267āˆ’1) Ɨ100=30.66 % Āæ which has the interpretation that the odds of a teen taking
alcohol increased by 30.66 units per unit increase in age. The coefficients of race97 given it was
African-American is 0.296 which is greater than zero, implying that the probability of drinking
alcohol increased when the race of the teen was African-American. Which in terms of the odds
can is (e ĀæĀæāˆ’0.2884āˆ’1)Ɨ100=74.94 % Āæ which had the interpretation that the odds of a teen
taking alcohol increased by 34.44 units when the race was African-American (Mutto, 2011).
Discussion and conclusion
From the above logit regression model, it's clear that once teens began taking alcohol there were
higher chances that they could continue increasing their alcohol intake and that supports the
claim that there is continued increase of alcohol consumption of alcohol among the teens. From
the study, it is also clear that teens were African-American were likely to be taking alcohol in
comparison to other races. This is indicated by their odds which indicated the odds of a teen
taking alcohol were 74.94 times for the African-American. The study also showed that teens
taking alcohol does not depend on their gender.
Finally, since the minimum age of the teen taking alcohol is 12, which is a very tender age, the
teen’s behavior should be regulated to make them avoid them from taking alcohol. Further, the
African-Americans that the teens have higher odds of beginning alcohol should put restrictions
so that the teens can stop using alcohol at their early ages. Such restriction and regulations will
help the teens to concentrate on their studies and also prevent them from joining crime in future.
References
Hanson, K. L., Thayer, R. E., & Tapert, S. F. (2014). Adolescent marijuana users have elevated risk-
taking on the balloon analog risk task. Journal of psychopharmacology, 28(11), 1080-1087.
Document Page
NAME
Kim, H. Y., Kwon, S., Lee, J. S., Choi, Y. S., Chung, H. R., Kwak, T. K., ... & Kang, M. H. (2012).
Development of a nutrition quotient (NQ) equation modeling for children and the evaluation of its
construct validity. Korean Journal of Nutrition, 45(4), 390-399.
Lever, J., Krzywinski, M., & Altman, N. (2016). Points of significance: Logistic regression.
Mutto, M., Lawoko, S., Nansamba, C., Ovuga, E., & Svanstrom, L. (2011). Unintentional childhood injury
patterns, odds, and outcomes in Kampala City: an analysis of surveillance data from the National
Pediatric Emergency Unit. Journal of injury and violence research, 3(1), 13
Document Page
NAME
Tables
Table1: descriptive statistics for those who were drinking alcohol
When drank30=1
Variable mean Std.dev.
Age97
Gender97
Race97
Comp97
Ethnic1997
13.8215
1.4887
1.7749
0.5080
1.2315
0.9002
0.5003
1.3834
0.5003
0.
4359
Table2: descriptive statistics for those who were not drinking alcohol
When drank30=0
Variable mean Std.dev.
Age97
Gender97
Race97
Comp97
Ethnic1997
13.5842
1.4396
1.7466
0.5050
1.1911
0.95114
0.4966
1.2856
0.5002
0.3934
Table3: logistic regression model
tabler-icon-diamond-filled.svg

Paraphrase This Document

Need a fresh take? Get an instant paraphrase of this document with our AI Paraphraser
Document Page
NAME
Variable Exponentiated
Coefficient
(Odds)
z-
statistics
Age97
Gender97:
Race97:
Rank 1
Rank 2
Rank 3
Rank 4
Comp97
Ethnic1997
constant
1.3055
1.1883
0.7494
0.5919
0.5288
1.0834
1.0002
1.1037
0.0153
4.76
1.67
-2.11
0.78
-1.22
0.40
0.998
0.558
-5.4
Document Page
NAME
Appendix A
view C:\Users\wakibia\Desktop\finall.smcl
. log using "C:\Users\wakibia\Desktop\revision.smcl"
----------------------------------------------------------------------------------------------------------------
name: <unnamed>
log: C:\Users\wakibia\Desktop\revision.smcl
log type: smcl
opened on: 25 Apr 2019, 20:58:08
. insheet using "C:\Users\wakibia\Desktop\nlsy97clean4.csv"
(48 vars, 1632 obs)
. keep age97 gender97 ethnic97 race97 comp97 drank30
. encode ethnic97, generate(ethnic1997)
. drop ethnic97
. logistic drank30 age97 i.gender97 i.race97 i.comp97 i.ethnic1997,base
note: 3.ethnic1997 != 0 predicts success perfectly
3.ethnic1997 dropped and 1 obs not used
Logistic regression Number of obs = 1631
LR chi2(8) = 37.40
Prob > chi2 = 0.0000
Log likelihood = -1064.9818 Pseudo R2 = 0.0173
Document Page
NAME
------------------------------------------------------------------------------
drank30 | Odds Ratio Std. Err. z P>|z| [95% Conf. Interval]
-------------+----------------------------------------------------------------
age97 | 1.305491 .0731755 4.76 0.000 1.169667 1.457087
|
gender97 |
1 | 1 (base)
2 | 1.188315 .1231342 1.67 0.096 .9699057 1.455908
|
race97 |
1 | 1 (base)
2 | .7494154 .1026228 -2.11 0.035 .5730091 .98013
3 | .5918543 .3995429 -0.78 0.437 .1576139 2.222466
4 | .5287511 .276943 -1.22 0.224 .189417 1.47599
5 | 1.083591 .2174835 0.40 0.689 .7311793 1.605857
|
comp97 |
0 | 1 (base)
1 | 1.000237 .1073096 0.00 0.998 .8105552 1.234308
|
ethnic1997 |
1 | 1 (base)
2 | 1.103706 .185685 0.59 0.558 .7936869 1.534821
3 | 1 (empty)
|
_cons | .0152892 .0118441 -5.40 0.000 .0033495 .0697887
------------------------------------------------------------------------------
. *the logit model treating factors as factors
tabler-icon-diamond-filled.svg

Paraphrase This Document

Need a fresh take? Get an instant paraphrase of this document with our AI Paraphraser
Document Page
NAME
. by drank30, sort : summarize age97 gender97 race97 comp97 ethnic1997
----------------------------------------------------------------------------------------------------------------
-> drank30 = 0
Variable | Obs Mean Std. Dev. Min Max
-------------+--------------------------------------------------------
age97 | 1010 13.58416 .9514199 12 16
gender97 | 1010 1.439604 .4965848 1 2
race97 | 1010 1.745545 1.285586 1 5
comp97 | 1010 .5049505 .5002232 0 1
ethnic1997 | 1010 1.191089 .3933539 1 2
----------------------------------------------------------------------------------------------------------------
-> drank30 = 1
Variable | Obs Mean Std. Dev. Min Max
-------------+--------------------------------------------------------
age97 | 622 13.82154 .9001622 12 16
gender97 | 622 1.488746 .5002756 1 2
race97 | 622 1.77492 1.383413 1 5
comp97 | 622 .5080386 .5003377 0 1
ethnic1997 | 622 1.231511 .4259353 1 3
. log of
name: <unnamed>
log: C:\Users\wakibia\Desktop\revision.smcl
log type: smcl
paused on: 25 Apr 2019, 22:46:17
Document Page
NAME
chevron_up_icon
1 out of 12
circle_padding
hide_on_mobile
zoom_out_icon
[object Object]