Computation of National Income
Complete the Data Exercise #1 which involves calculating GDP using the Expenditures Approach and obtaining data from the Bureau of Economic Analysis website.
18 Pages2803 Words32 Views
Added on 2023-01-10
About This Document
This document provides a detailed analysis of the computation of national income using the expenditures and income approach. It includes data exercises and explanations of GDP, GNP, and GDP per capita. The significance of GDP in analyzing economic performance is also discussed.
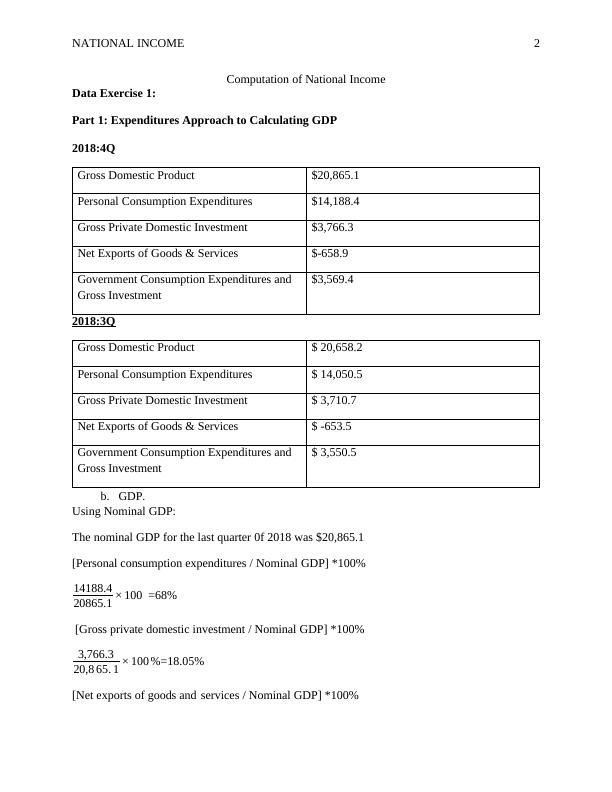
Computation of National Income
Complete the Data Exercise #1 which involves calculating GDP using the Expenditures Approach and obtaining data from the Bureau of Economic Analysis website.
Added on 2023-01-10
ShareRelated Documents

End of preview
Want to access all the pages? Upload your documents or become a member.
Approaches to Calculating GDP
|18
|3443
|281
Expenditures Approach to Calculating GDP
|13
|2649
|279
Macroeconomics: Nominal and Real GDP of US
|12
|1603
|20
Economics Assignment on GDP, Unemployment, Inflation and Aggregate Demand
|11
|2376
|217
Economic Environment Learning objectives Assignment PDF
|11
|718
|68
SEO Expert for Desklib
|9
|1554
|178