Data Analysis Report: Humidity Levels in London, UK - Forecasting
VerifiedAdded on 2023/01/16
|9
|1237
|40
Report
AI Summary
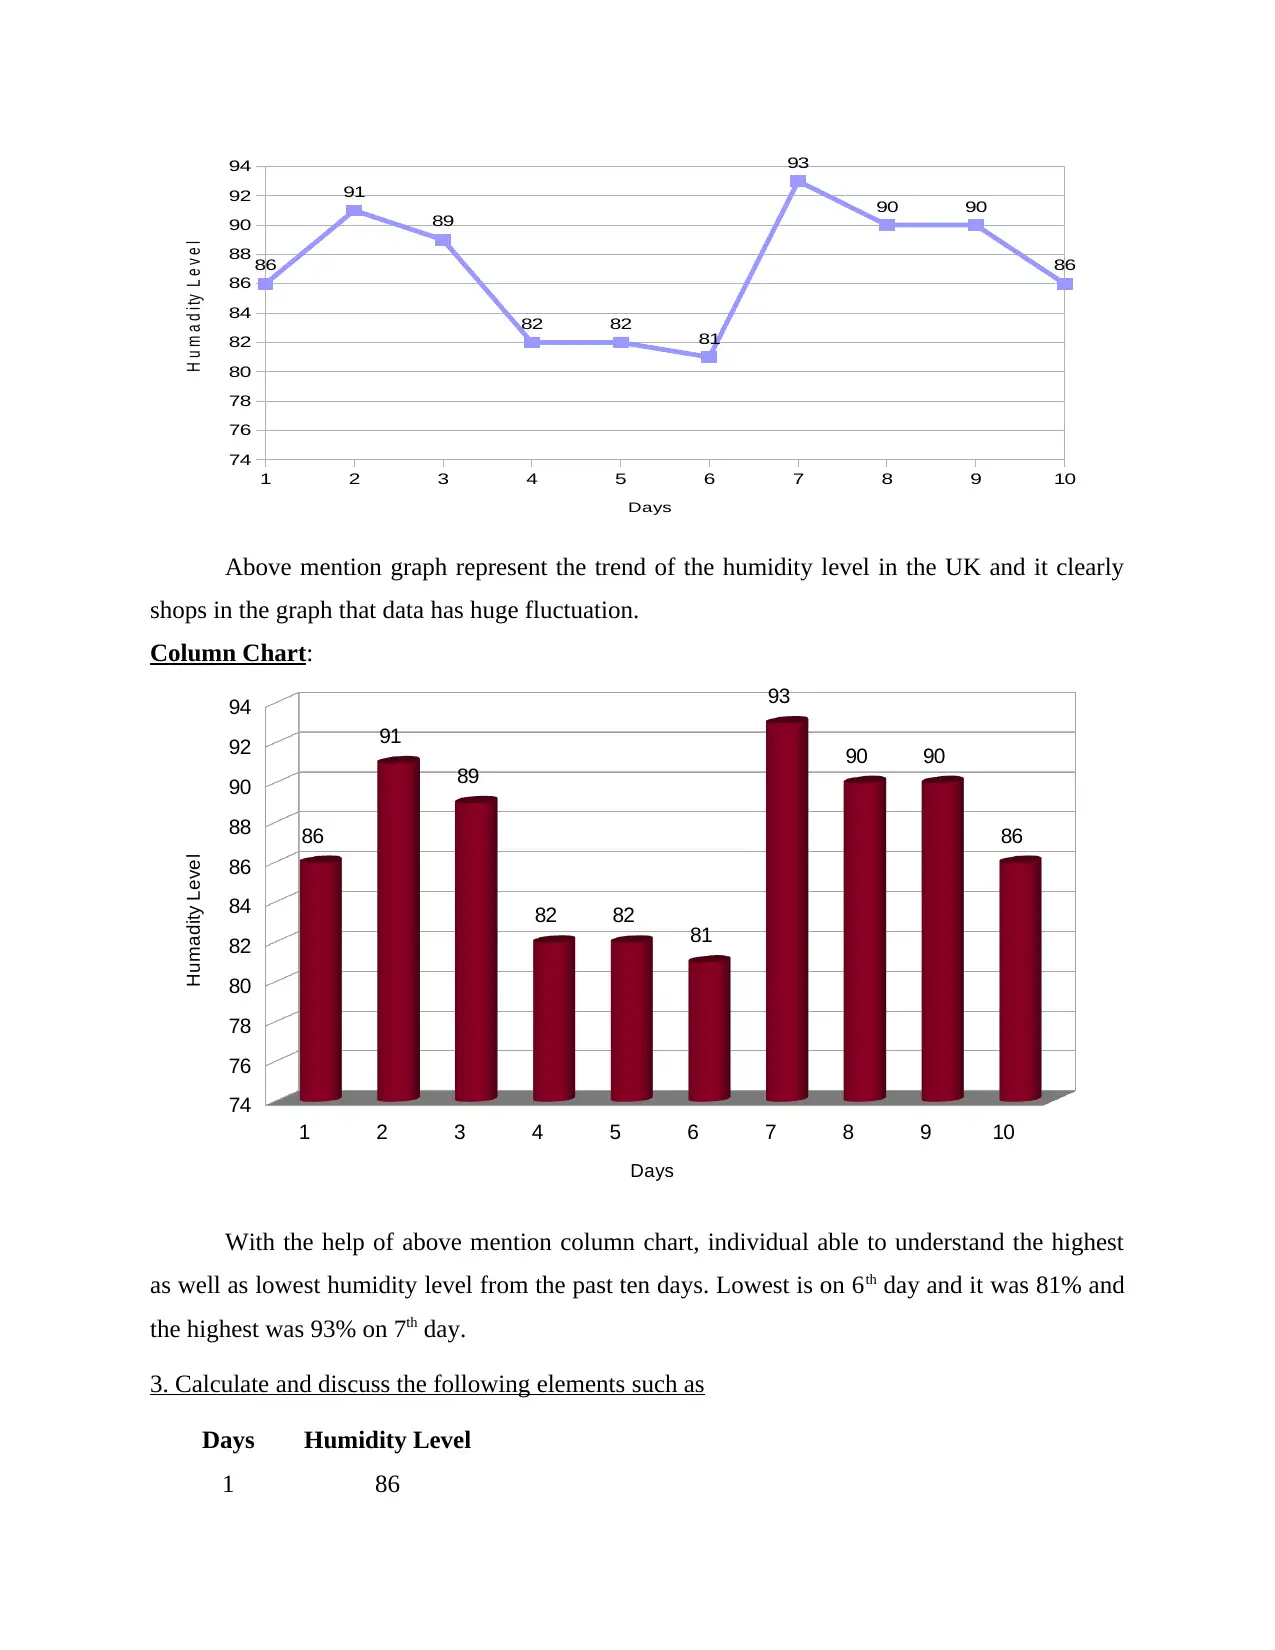
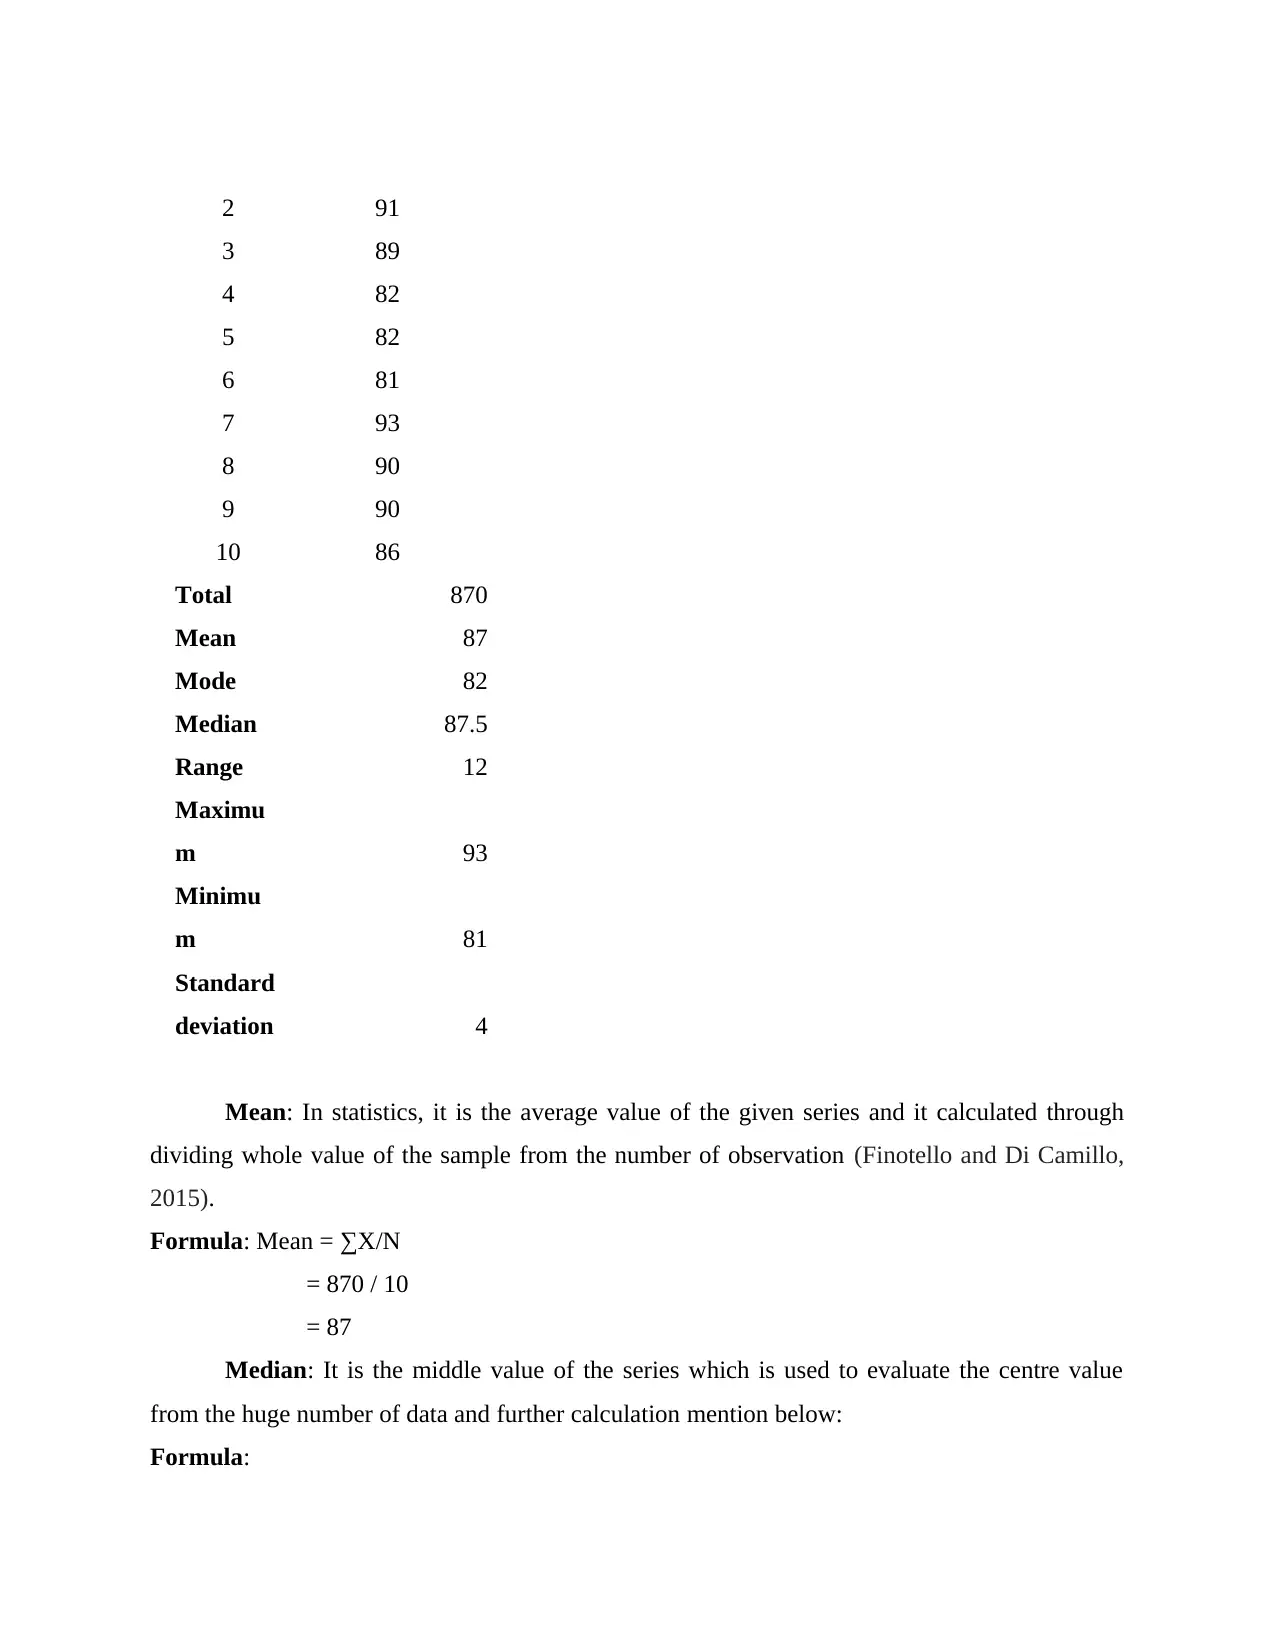
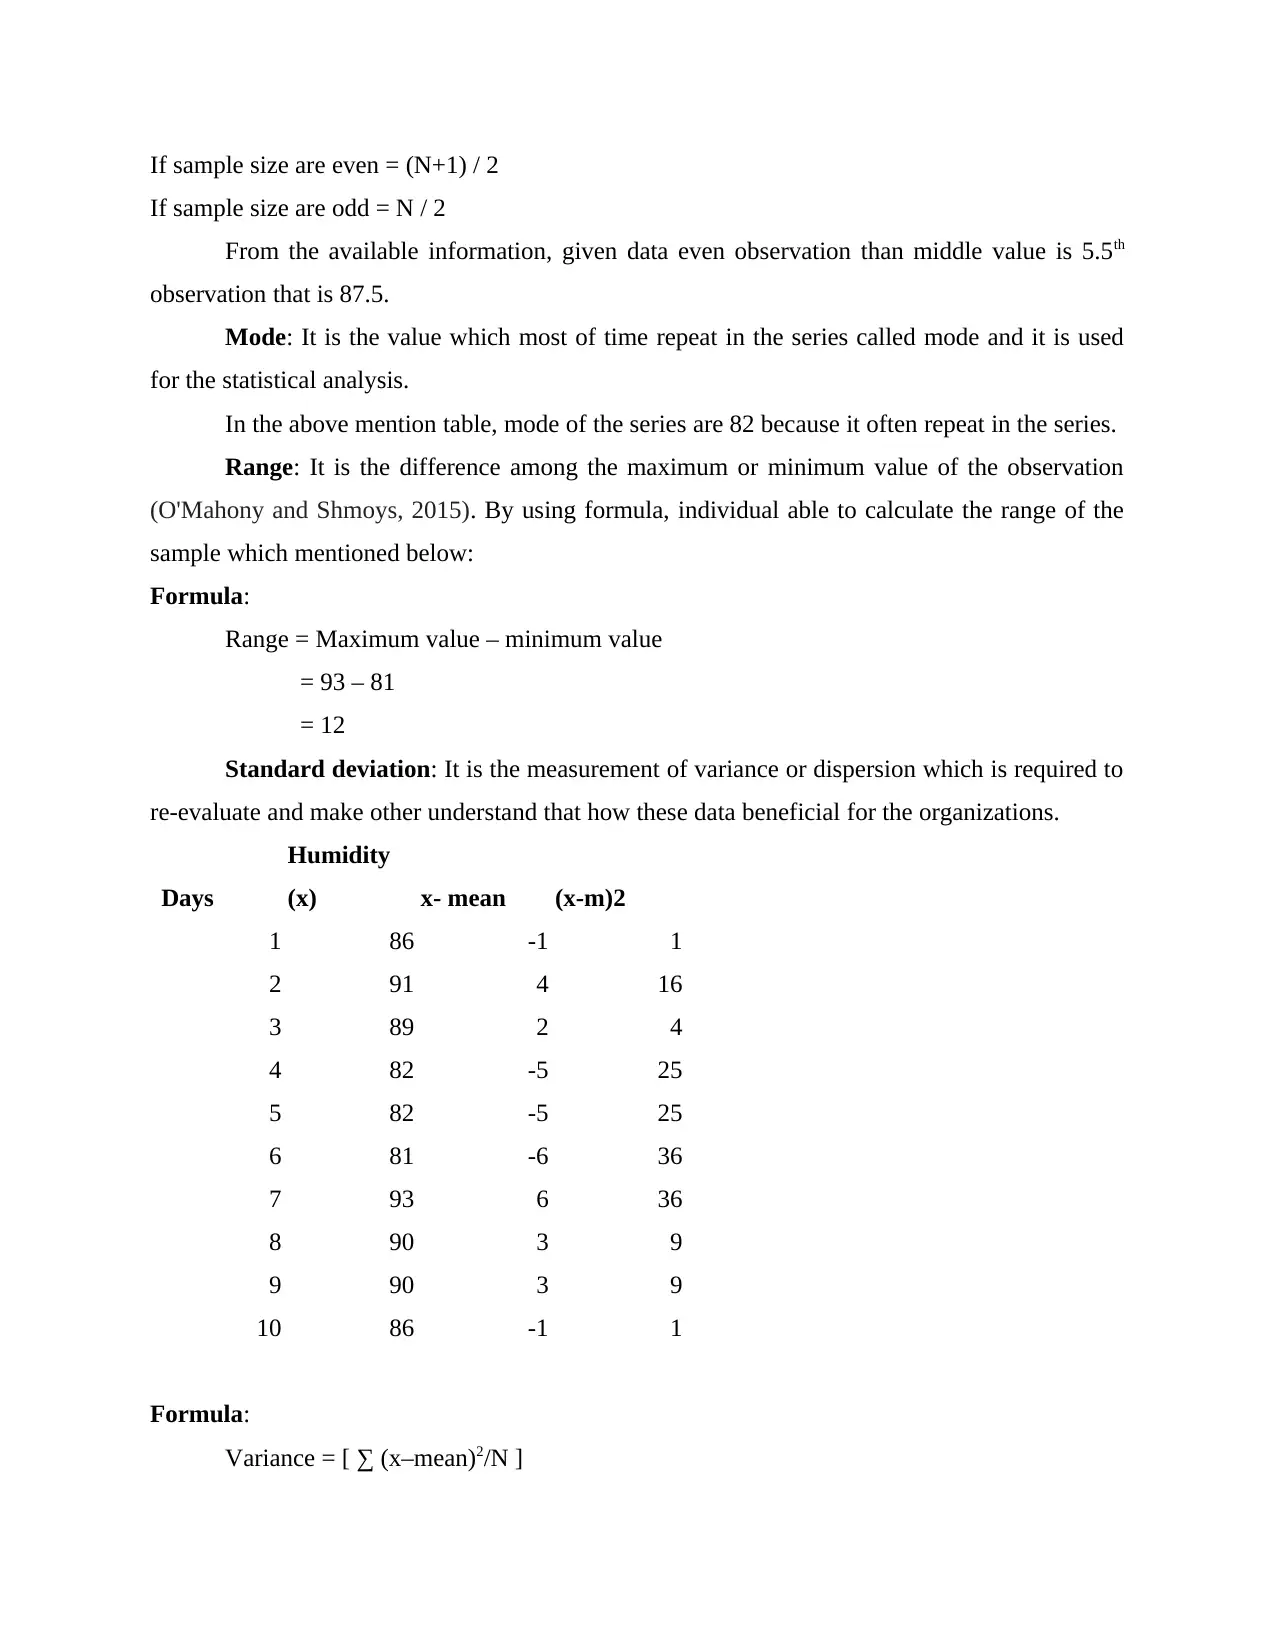
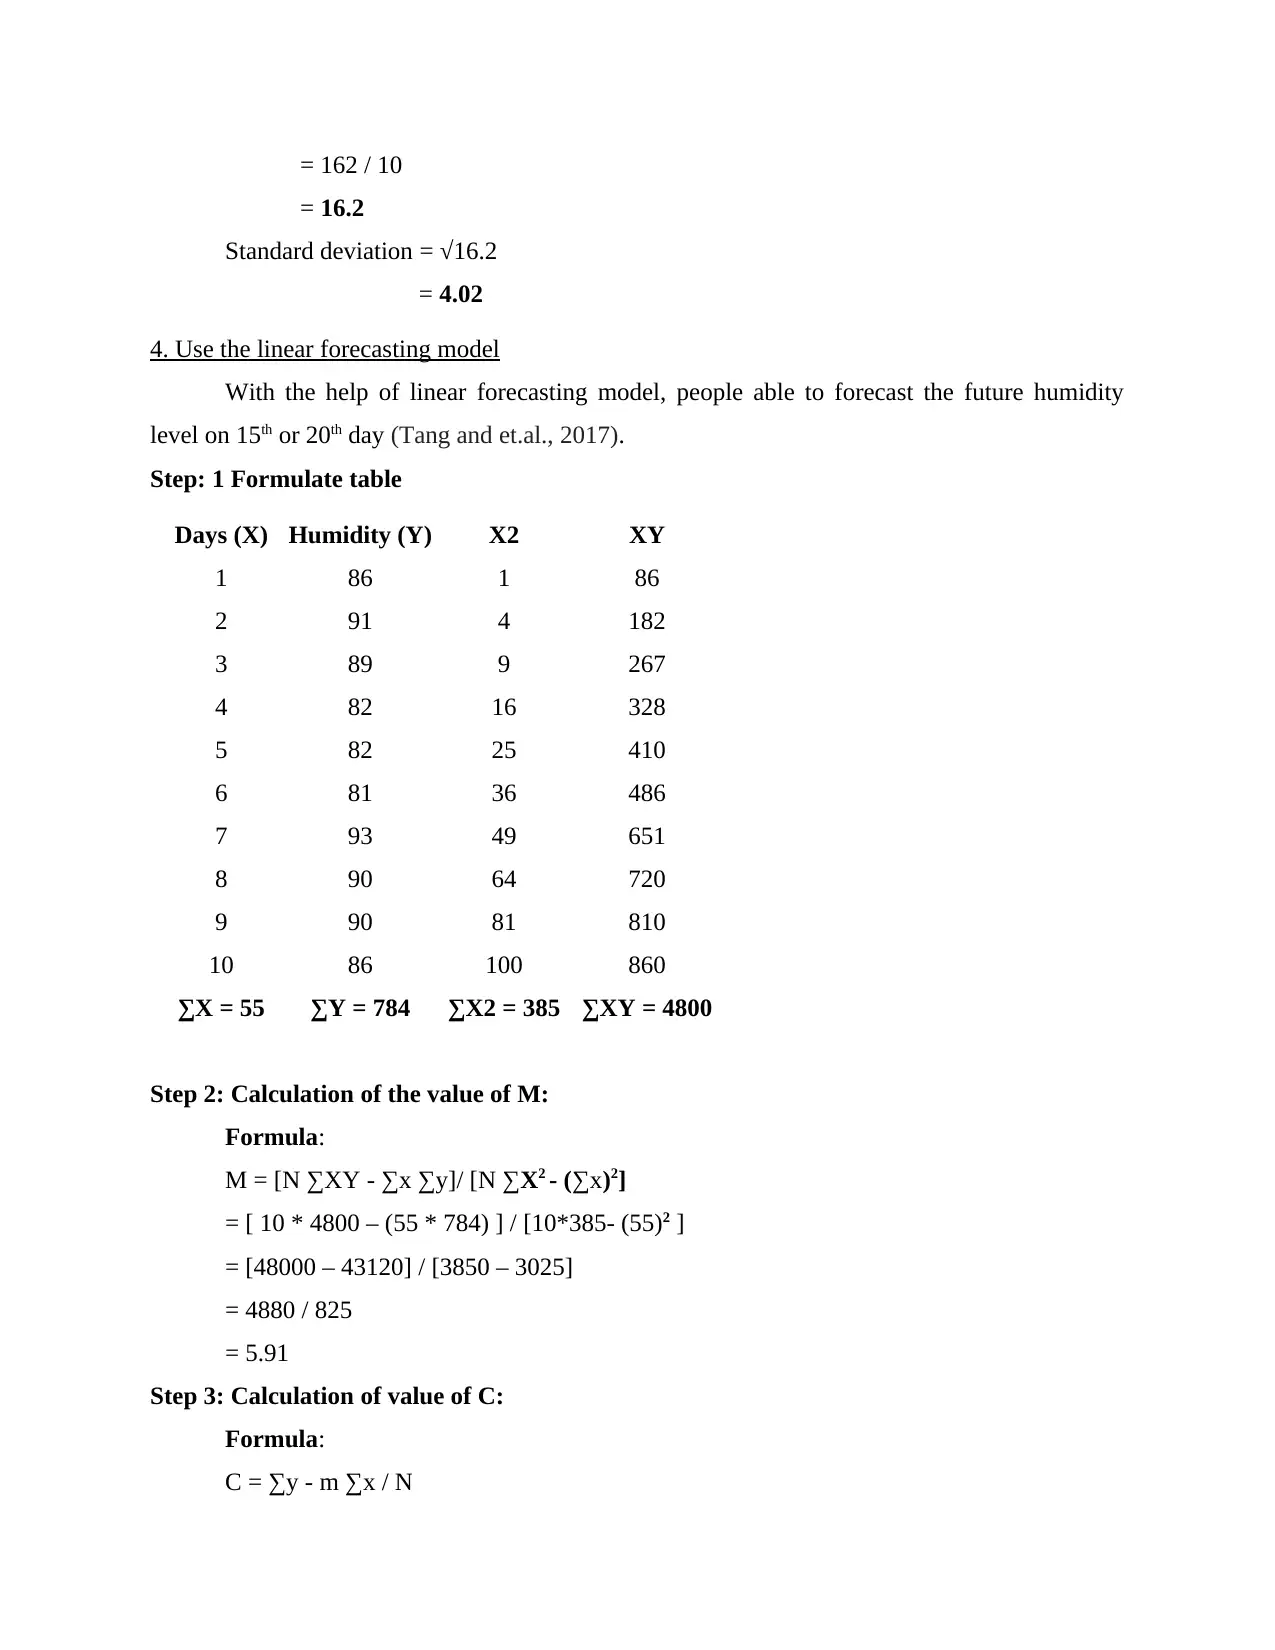
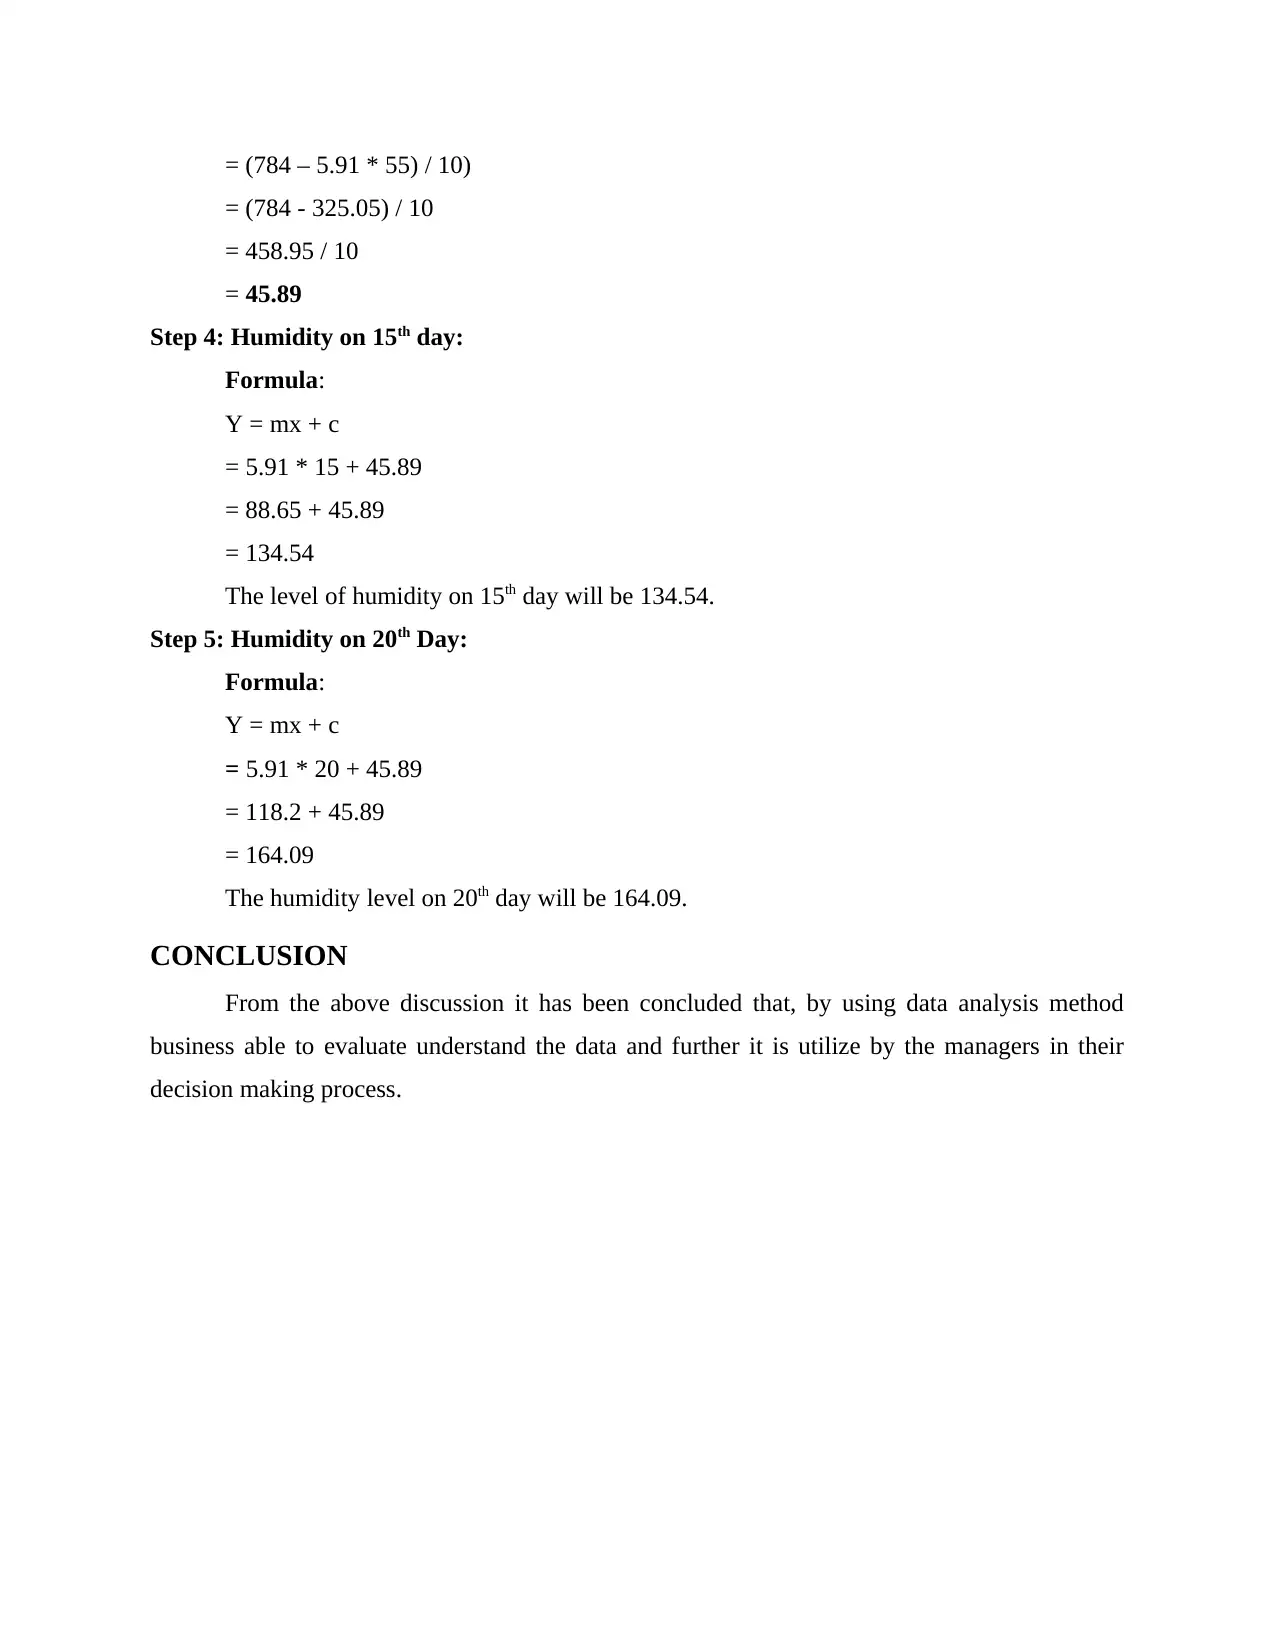
This report presents a data analysis of humidity levels in London, UK, utilizing data from December 2019 to January 2020. The analysis begins with data arrangement and presentation through line and column charts to visualize humidity trends. Statistical calculations, including mean, median, mode, range, and standard deviation, are performed to understand the central tendencies and variability of the data. Furthermore, the report employs a linear forecasting model to predict future humidity levels on the 15th and 20th days, providing insights into potential future conditions. The conclusion highlights the importance of data analysis in aiding managerial decision-making processes. The report references relevant sources to support its findings and methodologies.
1 out of 9
Related Documents


Your All-in-One AI-Powered Toolkit for Academic Success.
+13062052269
info@desklib.com
Available 24*7 on WhatsApp / Email
![[object Object]](/_next/static/media/star-bottom.7253800d.svg)
Copyright © 2020–2026 A2Z Services. All Rights Reserved. Developed and managed by ZUCOL.